REVIEW 4 major objections 5 minor 1 cited by
Optimisation of ATLAS computing resource usage through a modern HEP Benchmark Suite via HammerCloud and Big PanDA
T0 review · 4 major / 5 minor · reviewed 2026-08-08 · deepseek-v4-flash
Pith's one-line read Automated HEPScore23 benchmarking across 139 grid sites can validate the CPU 'corepower' values declared by ATLAS computing queues, and the first large-scale run finds that 32% of analyzed queues land outside the ±25% discrepancy threshold.
desk verdict An honest operational study with a real but possibly selection-biased discrepancy signal; worth a review after tightening the statistical reporting and releasing artifacts. read the letter →
The pith
A machine-rendered reading of the paper's core claim, the machinery that carries it, and where it could break.
The reading
What carries the argument
The load-bearing mechanism is the automated benchmark job: every four hours a single 8-core HEPScore23 job is dispatched to each targeted PanDA queue, running the seven-workload HEP application mix and collecting machine load, memory, and CPU frequency through plugin instrumentation. From the resulting data, the queue-level runtime corepower is formed by the walltime weighting of Eq. 1-2, and the paper's decision quantity is the relative change of Eq. 3, $\mathrm{relative\ change} = \mathrm{corepower}_{\mathrm{runtime}}/\mathrm{corepower}_{\mathrm{declared}} - 1$, with ±25% used as the acceptance band. This turns thousands of ordinary production slots into a continuously refreshed measurement of whether declared accounting numbers match delivered performance.
What would settle it
For a set of queues with known hardware inventories, benchmark every distinct CPU model at full load on the same 8-core slot type and compute a hardware-weighted corepower; if the walltime-weighted runtime corepower disagrees with this inventory-weighted value, the job-mix weights rather than the declared values are the source of the flagged discrepancies. A simpler check: rerun the fully-loaded-only analysis on a larger sample; if the discrepancies concentrate in queues whose newer CPU models were never benchmarked, missing benchmark coverage is the explanation.
Extended reading notes
Core claim
The central claim is that an automated HEPScore23 submission infrastructure can serve as a reliable cross-check for the official corepower accounting: it measures the performance actually delivered by a queue while the queue is doing normal work. A queue's runtime corepower is defined as the weighted average over CPU models, with weights set by the walltime-times-core each model contributes to PanDA jobs and per-model scores taken from benchmark measurements. Applying this to queues with complete weight data, the paper reports that 32% of the analyzed queues lie outside the ±25% discrepancy threshold, that outdated cloned declared values rather than machine load explain most of these outliers, and that the aggregate discrepancy corresponds to a 6% advantage in favor of runtime corepower.
Load-bearing premise
The analysis depends on the PanDA job stream being a fair sample of each queue's true CPU mix, and on every CPU model present in that mix having a benchmark score; biases in either would systematically skew every runtime corepower value and change the reported 32% and 6% numbers.
Editorial extensions
If this is right
- Queues flagged beyond ±25% can be sent back to site administrators with an automated, evidence-based request to update their corepower values in the central configuration database.
- The 6% aggregate advantage implies that accounting numbers are conservative across the board, so decisions based on declared capacity understate the computing actually available to ATLAS.
- The HS23-to-HS06 conversion can be verified in production: old processors from 2012 show a scaling ratio near 0.7, explaining a recognizable class of negative discrepancies.
- Because benchmark jobs collect load and memory alongside scores, the same infrastructure doubles as a health monitor, catching underloaded, overloaded, or misconfigured queues.
Reading between the lines
- Because the Eq. 1 weights come from ATLAS's own job stream, the 6% aggregate advantage is an ATLAS-specific number; another experiment with a different CPU-mix footprint on the same sites could see a different overall discrepancy.
- The reported 32% is defined against the ±25% band; re-expressing the same data with per-queue uncertainty intervals would show how stable that fraction is at other thresholds without re-running the campaign.
- The same four-hourly benchmark cadence could be extended to other slot sizes, such as single-core or 16-core slots, to test whether HEPScore23's multi-core behaviour changes the per-core score, since production slots vary in size.
- If site inventory data were made machine-readable, the method could predict a queue's corepower from its hardware list alone and flag likely mismatches before any benchmark run.
Signed reviews
Editorial analysis
A structured set of objections, weighed in public.
Referee Report
Summary. The paper describes an automated infrastructure, built on HammerCloud and PanDA, that submits HEPScore23 benchmark jobs to ATLAS WLCG queues every four hours, collects benchmark results and system metrics, and compares the resulting 'runtime corepower' with the 'declared corepower' that sites report through ATLAS-CRIC. The analysis covers 72 of 139 sites with what the authors call 'complete weight data', and it reports that 32% of those sites show critical discrepancies beyond a ±25% threshold, with an overall 6% advantage in favor of runtime corepower. The paper also examines the correlation between server load and measured performance, discusses the role of outdated or cloned declared values, and concludes that the infrastructure provides a reliable cross-check for the official accounting system.
Significance. The infrastructure itself is a substantial and valuable operational contribution: 187,045 benchmark jobs were executed across 139 sites and 251 CPU models, with continuous 4-hourly submission and rich system-metric collection. If the quantitative claims were robust, they would provide a strong evidence base for correcting WLCG accounting values. However, the headline figures—the 32% discrepancy rate and the 6% overall advantage—are computed on a self-selected subset of sites and depend on undocumented weighting and threshold choices. The paper is therefore best regarded as a promising infrastructure demonstration whose quantitative conclusions require further justification before they can be considered reliable.
major comments (4)
- [Section 3.1 and Section 4] The paper restricts the analysis to 72 of 139 sites because of 'complete weights data' but never defines what completeness means, how many queues were dropped per site, or how the included and excluded sites compare on observable variables such as declared corepower, CPU-model age, queue size, or benchmark coverage. If completeness is correlated with modern, well-benchmarked hardware and current declared values, the reported 32% critical-discrepancy rate and the 6% overall advantage are selection-biased and cannot be taken as representative of ATLAS sites as a whole. Please provide the definition of complete weights, report the excluded-set characteristics, and re-run the analysis on the full dataset with a documented imputation or on a clearly defined representative subset.
- [Section 3.1, Eq. (2)] The runtime corepower of a queue is computed by renormalizing the CPU-model weights over only the models with benchmark data. For a queue with a substantial unmeasured model, this imputes that model's corepower as equal to the weighted average of the measured models, which is an untested assumption. The paper lists 'errors in weight calculations critical to the analysis' as a systematic uncertainty but does not quantify the sensitivity of the 32% and 6% conclusions to missing benchmark coverage. Please add a per-queue benchmark-coverage metric and a sensitivity study that truncates or down-weights queues with low coverage.
- [Section 4] The ±25% discrepancy threshold is introduced as 'conservative' without a derivation or a sensitivity analysis. Because the systematic uncertainties are only enumerated and not quantified, the reader cannot judge whether 25% is appropriate or whether the 32% figure is an artifact of this choice. Please report the relative-change distribution and the critical-discrepancy rate for several thresholds (e.g., 10%, 15%, 20%, 30%, 40%) and justify the chosen value in terms of the stated uncertainty sources.
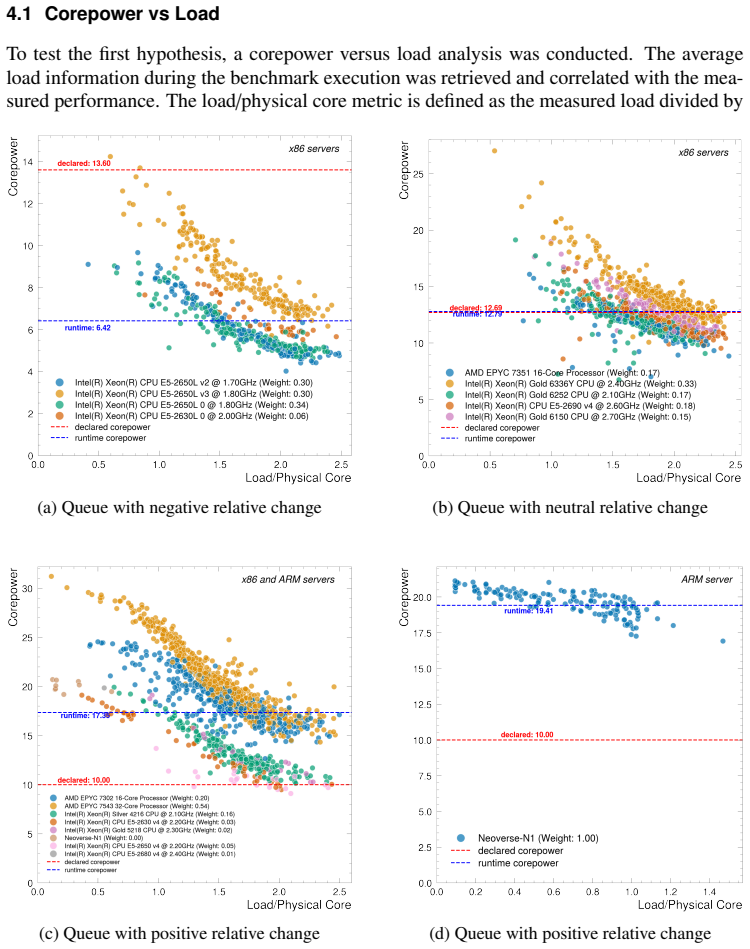
- [Section 4.1 and Figure 4] The claim that restricting the analysis to fully loaded servers 'did slightly reduce discrepancies... it did not bring them entirely within the expected threshold' and therefore that the full-load-range method is 'valid and... uncertainty... minimal' is not supported by any numbers. Please provide a quantitative comparison, such as the distribution of relative changes before and after the load restriction, the number of sites crossing the threshold in each case, or a scatter plot of full-range versus full-load relative changes, to substantiate this methodological conclusion.
minor comments (5)
- [Abstract and Section 4] The abstract states that benchmarks ran across 136 computing sites, while Table 1 and Section 4 report 139 sites; please harmonize this number.
- [Section 3.1, Eq. (2)] The subscript 'queue' in both the numerator and denominator of Eq. (2) is confusing; the numerator should carry the CPU-model index for the per-model runtime corepower.
- [Section 4] The word 'treshold' is a typo for 'threshold'.
- [Section 4.2] The statement that 80% of PanDA queues were cloned and 50% inherited corepower values would benefit from a brief explanation of how this was determined from ATLAS-CRIC data, for example which metadata fields were used.
- [References] Reference [13] is a generic WLCG URL with a note that the citation may vary; a stable technical-standard document or DOI would be more appropriate.
Circularity Check
No significant circularity: runtime corepower is derived from external HEPScore23 benchmark measurements and compared to independently site-declared values; the central claim does not reduce to its inputs.
full rationale
The derivation chain is self-contained with respect to the comparison object. Eq. 1 computes CPU-model weights w_x from PanDA walltime_x_core (production job usage), Eq. 2 forms a weighted average of measured runtime HS23 corepower per CPU model, and Eq. 3 compares that measured average to the declared corepower stored in ATLAS-CRIC. The declared values are supplied by site administrators or imported from external data sources; the runtime values are produced by the independent execution of the HEPScore23 workload on the actual queues. No fitted parameter is renamed as a prediction and no equation is defined in terms of the quantity it is used to validate. The self-citations to the HEPScore benchmark [2], the HEP Benchmark Suite [4], and the HEPiX solution [15] describe the construction and scaling of the measurement tool; they do not supply the target discrepancy result as an unverified premise. The only notable limitation is the data-selection statement in Sections 3.1 and 4 that only queues with complete weight data were analyzed (72 of 139 sites), which creates a potential selection-bias concern for the 32% and 6% figures; however, selection bias is a statistical validity issue, not a circularity, because the relative change for each included queue is still computed from two independent quantities: an externally reported declared value and a benchmark-derived runtime value.
Assumptions & free parameters
free parameters (1)
- discrepancy_threshold =
0.25
assumptions (6)
- domain assumption Jobs run on 8-core slots following WLCG standards.
- domain assumption HEPScore23 workloads represent ATLAS production workloads.
- domain assumption PanDA walltime_x_core gives unbiased weights for CPU model mixes.
- domain assumption CPU models without benchmark data are negligible or random.
- domain assumption Excluding sites with incomplete weight data does not bias results.
- domain assumption Declared corepower values are converted one-to-one from HS06 to HS23.
Cite this review
Pith. "Pith review of Optimisation of ATLAS computing resource usage through a modern HEP Benchmark Suite via HammerCloud and Big PanDA." pith.science (2026). https://pith.science/paper/TY4FTPKS
@misc{pith2026250204853,
  author       = {Pith},
  title        = {Pith review of: Optimisation of ATLAS computing resource usage through a modern HEP Benchmark Suite via HammerCloud and Big PanDA},
  year         = {2026},
  howpublished = {\url{https://pith.science/paper/TY4FTPKS}},
  note         = {Machine review of arXiv:2502.04853}
}
read the original abstract
In April 2023, HEPScore23, the new benchmark based on HEP specific applications, was adopted by WLCG, replacing HEP-SPEC06. As part of the transition to the new benchmark, the CPU corepower published by the sites needed to be compared with the effective power observed while running ATLAS workloads. One aim was to verify the conversion rate between the scores of the old and the new benchmark. The other objective was to understand how the HEPScore performs when run on multi-core job slots, so exactly like the computing sites are being used in the production environment. Our study leverages the HammerCloud infrastructure and the PanDA Workload Management System to collect a large benchmark statistic across 136 computing sites using an enhanced HEP Benchmark Suite. It allows us to collect not only performance metrics, but, thanks to plugins, it also collects information such as machine load, memory usage and other user-defined metrics during the execution and stores it in an OpenSearch database. These extensive tests allow for an in-depth analysis of the actual, versus declared computing capabilities of these sites. The results provide valuable insights into the real-world performance of computing resources pledged to ATLAS, identifying areas for improvement while spotlighting sites that underperform or exceed expectations. Moreover, this helps to ensure efficient operational practices across sites. The collected metrics allowed us to detect and fix configuration issues and therefore improve the experienced performance.
Figures


Figures from the paper (1 more)

Forward citations
Cited by 1 Pith paper
-
Towards an Introspective Dynamic Model of Globally Distributed Computing Infrastructures
SMOTE can reproduce the marginal distributions of nine PanDA job-record fields, but the paper does not validate joint dependencies or build the intended dynamic simulation model.
Reference graph
Works this paper leans on
-
[1]
M. Michelotto, M. Alef, A. Iribarren, H. Meinhard, P. Wegner, M. Bly, G. Benelli, F. Brasolin, H. Degaudenzi, A.D. Salvo et al., A comparison of HEP code with SPEC1 benchmarks on multi-core worker nodes (2010), https://dx.doi.org/10.1088/ 1742-6596/219/5/052009
work page 2010
-
[2]
D. Giordano, J.M. Barbet, T. Boccali, G.M. Borge, C. Hollowell, V . Innocente, W. Lampl, M. Michelotto, H. Meinhard, L. Ondris et al.,HEPScore: A new CPU bench- mark for the WLCG (2024), https://doi.org/10.1051/epjconf/202429507024
arXiv 2024
-
[3]
ATLAS Collaboration, The ATLAS Experiment at the CERN Large Hadron Collider (2008), https://dx.doi.org/10.1088/1748-0221/3/08/S08003
-
[4]
N. Szczepanek, D. Britton, A.D. Girolamo, E. Ketele, I. Glushkov, D. Giordano, et al., HEP Benchmark Suite: Enhancing E fficiency and Sustainability in Worldwide LHC Computing Infrastructures (2024), 2408.12445, https://arxiv.org/abs/2408. 12445
arXiv 2024
-
[5]
CERN, HammerCloud - Distributed Analysis Testing Framework (2024), Accessed on: 26 November 2024, https://hammercloud.cern.ch/
work page 2024
-
[6]
T. Maeno, A. Alekseev, F.H.B. Megino, K. De, W. Guan, E. Karavakis, A. Klimentov, T. Korchuganova, F. Lin, P. Nilsson et al.,PanDA: Production and Distributed Analysis System (2024), https://doi.org/10.1007/s41781-024-00114-3
-
[7]
CERN HEP Benchmarks Project, HEP Benchmark Suite (2024), Accessed on: 26 November 2024, https://gitlab.cern.ch/hep-benchmarks/ hep-benchmark-suite
work page 2024
-
[8]
Apache Software Foundation, Apache ActiveMQ (2024), Accessed on: 26 November 2024, https://activemq.apache.org/
work page 2024
Show all 15 references
-
[9]
OpenSearch Project, OpenSearch (2024), Accessed on: 26 November 2024, https: //opensearch.org/
2024
-
[10]
Grafana Labs, Grafana (2024), Accessed on: 26 November 2024, https://grafana. com/
2024
-
[11]
elastic.co/elasticsearch
Elastic, Elasticsearch (2024), Accessed on: 26 November 2024, https://www. elastic.co/elasticsearch
2024
-
[12]
co/kibana
Elastic, Kibana (2024), Accessed on: 26 November 2024, https://www.elastic. co/kibana
2024
-
[13]
Specific citation may vary based on context., https://wlcg.web.cern.ch/
Worldwide LHC Computing Grid (WLCG), Worldwide LHC Computing Grid: Techni- cal Standards (2024), each job runs on 8 cores, following WLCG standards. Specific citation may vary based on context., https://wlcg.web.cern.ch/
2024
-
[14]
ATLAS Collaboration, ATLAS CRIC (2024), Accessed on: 26 November 2024, https: //atlas-cric.cern.ch
2024
-
[15]
Giordano, M
D. Giordano, M. Alef, L. Atzori, J.M. Barbet, O. Datskova, M. Girone, C. Hollow- ell, M. Javurkova, R. Maganza, M.F. Medeiros et al., HEPiX Benchmarking Solution for WLCG Computing Resources (2021), https://link.springer.com/misc/10. 1007/s41781-021-00074-y
2021
Reviewed August 8, 2026 · model on record in the stance chip above.
Discussion (0). Continue with ORCID to comment.