REVIEW 3 major objections 6 minor 30 references
Improving the soil water module of the Decision Support System for Agrotechnology Transfer cropping system model for subsurface irrigation
T0 review · 3 major / 6 minor · reviewed 2026-08-14 · deepseek-v4-flash
Pith's one-line read Adding gradient-driven unsaturated flow to DSSAT's soil module halves soil-moisture error and restores realistic tomato yields under buried drip irrigation.
desk verdict A transparent, well-documented engineering adaptation of DSSAT for subsurface drip irrigation, but the headline accuracy gain is confounded by in-sample calibration and post-hoc data exclusion. read the letter →
The pith
A machine-rendered reading of the paper's core claim, the machinery that carries it, and where it could break.
The reading
What carries the argument
The load-bearing addition is the van Genuchten closed-form model of unsaturated soil hydraulic properties, used here to drive vertical water movement by the moisture gradient between adjacent layers. The original bucket logic still handles infiltration, saturation overflow, and gravity drainage; the new term computes an additional flux from the volumetric-water-content difference between neighboring layers, scaled by the geometric mean of their hydraulic diffusivity and conductivity, with conductivity $K(\theta)$ following the Mualem-van Genuchten expression and the suction head $\Psi$ following the van Genuchten retention curve. The second piece of machinery is the parameter-optimization loop: a particle swarm optimizer, split into one pass for original DSSAT parameters and one for the added soil parameters, recalibrates against observed soil moisture and satellite leaf-area index as each analysis day arrives. The 10-second sub-daily time stepping keeps the new flux numerically stable and makes the daily one-step bucket update accurate enough to resolve flow from the 20-36 cm deep irrigation pipe.
What would settle it
Take a field with a different bed width, pipe depth, or sensor distance from the drip line and run the modified model with soil parameters fixed from one of the five study fields; if the soil-moisture error returns to roughly the original model's $0.065\ \mathrm{m^3\,m^{-3}}$ level, the reported improvement was calibration fit rather than a transferable fix. A cleaner test is to calibrate in one season and evaluate on the next season's observations without re-fitting.
Extended reading notes
Core claim
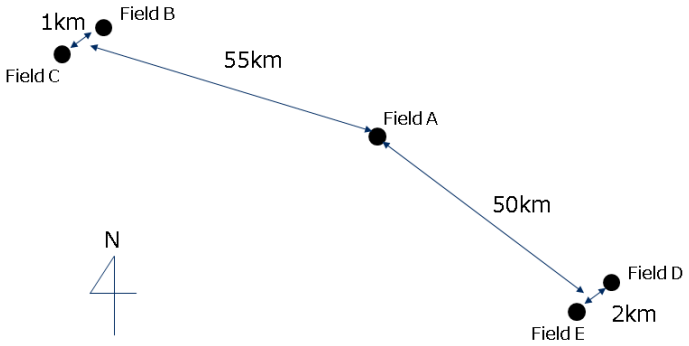
On its own terms, the paper claims that the original DSSAT model is a bucket-type soil-water model: drainage moves downward only when a layer exceeds its drained upper limit, and capillary rise is represented as upward flow only under saturated conditions, which cannot describe water rising from a buried drip line in unsaturated soil. The modification adds an unsaturated vertical flux between adjacent layers, $$V_{\mathrm{out}}(L) = \left[D_{\mathrm{GM}}\frac{\$\theta$(L)-\$\theta$(L+1)}{(\$\Delta$ z(L)+\$\Delta$ z(L+1))/2} + K_{\mathrm{GM}}\right]\$\Delta$ t,$$ with $D_{\mathrm{GM}}$ and $K_{\mathrm{GM}}$ the geometric means of the van Genuchten hydraulic diffusivity and conductivity of the two layers, and it splits each simulation day into 8640 steps of $\Delta t = 10$ s to keep discretization error negligible. With a particle-swarm optimizer tuning $K_s$, $\alpha$, $\theta_r$, $\theta_s$, $n$, and a small set of plant parameters against soil-moisture sensors and satellite-derived leaf-area data, the modified model reduced the all-field mean soil-moisture error from $0.065$ to $0.029\ \mathrm{m^3\,m^{-3}}$ (from $0.081$ to $0.048\ \mathrm{m^3\,m^{-3}}$ when the flagged 10-cm-layer data from high-clay fields are included) and produced yields of 80-150 ton/ha where the original model had produced essentially none.
Load-bearing premise
The model treats each field as a one-dimensional, horizontally uniform soil column with all irrigation injected uniformly at the pipe depth at midnight, even though a buried drip line actually creates a three-dimensional wetting bulb around each emitter.
Editorial extensions
If this is right
- DSSAT can be extended to subsurface drip irrigation without replacing its crop-growth core: adding a gradient-driven vertical flow term fixes the water-deficit overestimate that previously killed the simulated crop.
- Irrigation schedules produced by the modified model are close to or below what farmers actually applied, with field D 19% lower, indicating the model can support water-saving decisions while keeping simulated yield realistic.
- The optimizer's daily re-calibration means the system can be used in-season: later analysis days (June 19) give consistently higher and more plausible yields than early-season analyses as more observations accumulate.
- The 10-cm soil-moisture readings in high-clay fields were treated as unreliable and excluded; improving sensor calibration or placement would likely extend the improvement to those layers.
Reading between the lines
- Because the module is one-dimensional, the lateral spread of wetting from a buried pipe is not modeled; the fitted parameters may be absorbing the distance between pipe and sensor, so predictions for other sensor positions or bed geometries may need re-calibration.
- The reported RMSE is computed after optimizing parameters on the same fields and sensors used for evaluation; a leave-one-field-out or multi-season test would show how much of the gain is genuine physical improvement rather than fitting flexibility.
- If the same gradient-flow scheme were applied to other crops or to surface-irrigated fields with a shallow water table, the van Genuchten term would also alter upward capillary flow there, potentially correcting known biases in DSSAT's bucket drainage beyond the subsurface case.
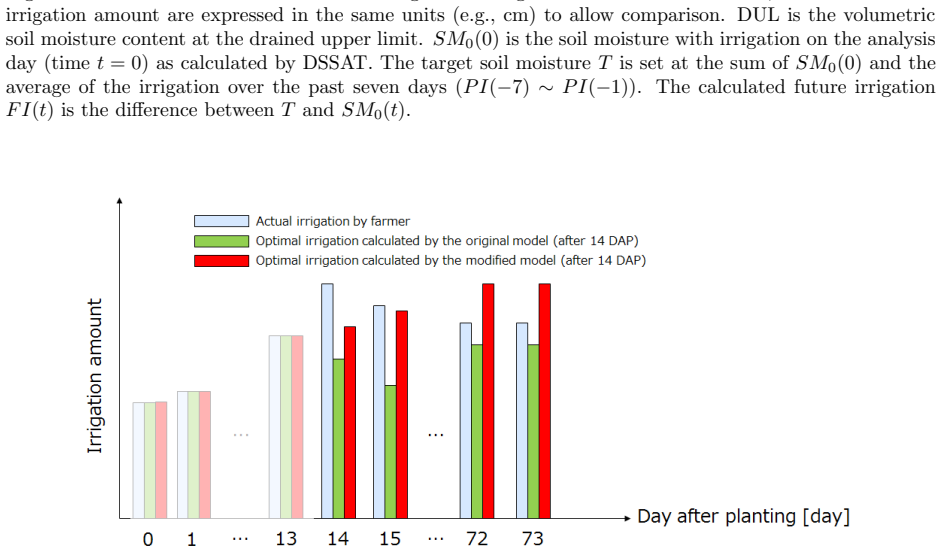
- Because the irrigation comparison uses actual farmer irrigation for the first 14 days and a target tied to the past week's farmer-applied amounts, the reported water savings are conservative and tied to existing grower practice rather than to a fully model-controlled schedule.
Signed reviews
Editorial analysis
A structured set of objections, weighed in public.
Referee Report
Summary. The paper modifies the DSSAT cropping-system model to simulate subsurface irrigation by adding van Genuchten gradient-driven vertical soil-water movement and a particle-swarm parameter optimization system (APOS/OPOS). The modified model is tested on five processing-tomato fields in California with buried drip irrigation at two or three depths. The authors report that the original DSSAT fails to produce yield, while the modified model reduces the average soil-moisture RMSE from 0.065 to 0.029 m3/m3 and gives yields in a 'reasonable' range of 80–150 ton/ha. The paper concludes that the modification improves soil-moisture precision under subsurface irrigation and can support irrigation decision-making.
Significance. If the reported improvement were properly validated, the work would be a useful step toward adapting a widely used crop model to subsurface drip irrigation, a management system of growing importance in water-scarce regions. The model modification is clearly described, the field dataset spans five fields and three weather regions, and the discretization check in Appendix D is a useful addition. However, the central quantitative claim rests on an in-sample evaluation: the PSO objective in Section 2.3 is the same soil-moisture mismatch that is later reported as RMSE in Section 2.4, and the abstract's headline numbers are obtained only after post-hoc removal of 10 cm sensor data in two clay fields. The yield comparison uses a regional average rather than measured yields. Therefore the significance is conditional: the paper establishes a plausible modeling approach, but not, on the present evidence, that the added physics rather than calibration flexibility is responsible for the improvement.
major comments (3)
- [Sections 2.3–2.4, Eqs. (15)–(16)] The reported error reduction is computed on the same observations used for calibration. In Section 2.3, APOS and OPOS use PSO whose evaluation function is the difference between simulated and observed five-layer soil moisture, and in Section 2.4 the RMSE in Eq. (15) is averaged over the same field-sensor observations. For the June 19 analysis day, the calibration window spans essentially the whole observed season, so the resulting error is a fitting residual rather than a prediction error. Because the modified model also contains additional fitted parameters (Ks, alpha, theta_r, theta_s, n), a lower in-sample RMSE is expected even if the added physics were wrong. Please provide a genuine out-of-sample evaluation, for example by calibrating only on data before May 10 and reporting RMSE only for dates after calibration, or by leave-one-field-out cross-validation, and report calibration and validation RMSE separately.
- [Section 3.2 and Figure 9; Abstract] The abstract's headline numbers (0.065 to 0.029 m3/m3) are not the all-layer averages. Figure 9 shows that with all five layers included the average error decreases from 0.081 to 0.048 m3/m3; the 0.065-to-0.029 figure is obtained only after excluding the 10 cm layer data in fields B and C. The decision to exclude those data is made after inspecting the errors ('We found that this is due to some problems with the soil moisture sensors'), which is a post-hoc selection that can inflate the apparent improvement. Please report the full-layer results and the excluded-layer results side by side, and justify the exclusion with a pre-specified, reproducible data-quality criterion rather than the observed error magnitude.
- [Section 3.2 and Figure 10] The yield claim is not validated against measured yields. The text compares simulated yields (80–150 ton/ha) with a regional average of 120 ton/ha and calls the range 'reasonable,' but no field-level measured yields are reported for the five fields. The statement that '24 of 30 analyses exceed 50 ton/ha' is a weak test because the range is broad and the comparison is to an areal statistic. Please either report the actual yields for the fields used or explicitly state that yield prediction is not validated and confine the paper's central claim to soil-moisture simulation.
minor comments (6)
- [Abstract] The word 'producting' should be 'production.'
- [Table 3] The word 'optimazation' should be 'optimization.'
- [Section 2.2] The text refers to 'clearly anomalous values at L1' but L1 is not defined; please identify which sensor or location L1 denotes.
- [Section 2.3] In the description of the automatic-irrigation target T in Eq. (13), the notation PI(t) is used for both irrigation and precipitation but the text says 'also including precipitation'; please define the term precisely here rather than only in the sentence after Eq. (14).
- [Appendices A and B] Repeated phrase 'In the each analysis' should be 'In each analysis.'
- [Section 3.2 / Figure 9] The caption of Figure 9 refers to 'soil moisture differences' but the y-axis and text use 'soil moisture difference'; please make the unit and quantity naming consistent.
Circularity Check
Reported half-error soil-moisture improvement is an in-sample PSO fit statistic, not an independent prediction; the headline also relies on post-hoc exclusion of 10 cm data in two clay fields.
-
fitted input called prediction
[Section 2.3 (Parameter optimization) and Section 2.4, Eqs. (15)-(16); results in Abstract and Section 3.2]
"APOS estimates the parameters of the additional model as given in Table 3 again using PSO with an evaluation function that uses the difference between observed data and simulated value of five layers soil moisture. ... We calculate the root mean square error (RMSE) ϵ between the simulation results and the observed data for the original DSSAT and the modified DSSAT by ϵ = sqrt(Σd (Od,l −Sd,l)2 / Nd)"
The objective minimized by APOS is the same five-layer soil-moisture discrepancy that Eq. (15) reports as RMSE, and Eq. (16) averages over the same analysis days, sensors, and layers used for calibration, with no held-out field or season. For the June 19 analysis day, nearly all observed seasonal data precede the analysis day, so the headline decrease from 0.065 to 0.029 m3/m3 mainly reports the minimized calibration objective. The modified model also gains fitted van Genuchten parameters (Ks, α, θr, θs, n), so lower in-sample error is expected even if the added physics were wrong. The claim that the module 'improves precision' therefore reduces to a fit statistic rather than an out-of-sample prediction.
-
other
[Section 3.2 and Figure 9 caption; Abstract]
"For this reason, we redo the calculations for those two fields without using the data for the 10 cm layer. ... The all-field average error Σf Em,f decreases from 0.065 m3 m−3 to 0.029 m3 m−3."
The headline improvement is obtained after deleting, from the evaluation, the 10 cm observations in fields B and C that the model fits worst; the figure caption says the ignored data 'contain large errors because of the high clay content of the soil.' The evaluation set is thus chosen after inspecting residuals, and the abstract repeats this post-exclusion number as the general improvement. This selection on the target variable, combined with the PSO objective, makes the reported 0.065 to 0.029 reduction a constructed comparison rather than a fixed, pre-specified test of the modified model.
full rationale
This is not a self-citation circularity: the van Genuchten equations and the DSSAT base model are external, and no uniqueness theorem is imported from the authors. The central problem is instead the fitted-input-called-prediction pattern. Section 2.3 makes the PSO objective explicitly 'the difference between observed data and simulated value of five layers soil moisture,' and Section 2.4 evaluates the headline RMSE with the same observed values and the same layers, sensors, and analysis days, without a held-out field or season. For the June 19 analysis most of the season is in-sample; the May 10 and May 30 analyses contribute some out-of-sample days, so the circularity is partial rather than complete. The post-hoc removal of the 10 cm data in fields B and C further conditions the evaluation set on the outcome, and the abstract reports the resulting 0.065 to 0.029 m3/m3 numbers as the general improvement. The yield estimates (80-150 ton/ha) and irrigation comparisons are not fitted directly to yield observations, so they retain some independent content, but they are not validated against measured yields field by field. Overall, the central claim that the modified module improves soil-moisture precision under subsurface irrigation partially reduces to a calibration statistic, warranting a score of 6.
Assumptions & free parameters
free parameters (5)
- PENV, PAGE, PH2T5 (plant growth parameters) =
Estimated by PSO; values not tabulated in paper
- SLDR, LL, DUL, SAT (original DSSAT soil parameters) =
Estimated per layer by OPOS; values not tabulated
- Ks(L) (saturated hydraulic conductivity) =
Estimated per layer by APOS; initial values from literature ranges in Table 4
- alpha, theta_r, theta_s, n (van Genuchten parameters for pressure head) =
Estimated by APOS; literature values used as initial guesses
- Target soil moisture T in automatic irrigation =
Computed from past 7-day average irrigation (Eq. 13), not a fitted constant
assumptions (4)
- domain assumption van Genuchten-Mualem closed-form equations describe unsaturated hydraulic conductivity in each soil layer at field scale
- domain assumption Vertical flow between layers can be computed from geometric mean diffusivity and conductivity of adjacent layers
- ad hoc to paper All daily irrigation and precipitation are applied instantaneously at the first time step at midnight
- domain assumption A one-dimensional vertically discretized soil column represents the three-dimensional ridge-bed drip-irrigation field
Cite this review
Pith. "Pith review of Improving the soil water module of the Decision Support System for Agrotechnology Transfer cropping system model for subsurface irrigation." pith.science (2026). https://pith.science/paper/UC72Q2PK
@misc{pith2026190810523,
  author       = {Pith},
  title        = {Pith review of: Improving the soil water module of the Decision Support System for Agrotechnology Transfer cropping system model for subsurface irrigation},
  year         = {2026},
  howpublished = {\url{https://pith.science/paper/UC72Q2PK}},
  note         = {Machine review of arXiv:1908.10523}
}
read the original abstract
Ensuring that crops use water and nutrients efficiently is an important strategy for increasing the profitability of farming and reducing the environmental load from agriculture. Subsurface irrigation can be an alternative to surface irrigation as a means of losing less irrigation water, but the application timing and amount are often difficult to determine. Well-defined soil and crop models are useful for assisting decision support, but most of the models developed to date have been for surface irrigation. The present study examines whether the Decision Support System for Agrotechnology Transfer (DSSAT, version 4.5) cropping system model is applicable for the production of processing tomatoes with subsurface irrigation, and it revises the soil module to simulate irrigation schemes with subsurface irrigation. Five farmed fields in California, USA, are used to test the performance of the model. The original DSSAT model fails to produce fruit yield by overestimating the water deficiency. The soil water module is then revised by introducing the movement of soil moisture due to a vertical soil moisture gradient. Moreover, an external parameter optimization system is constructed to minimize the error between the simulation and observations. The revised module reduces the errors in the soil moisture profile at each field compared to those by the original DSSAT model. The average soil moisture error decreases from 0.065m^3/m^3 to 0.029m^3/m^3. The yields estimated by the modified model are in a reasonable range from 80 to 150 ton/ha, which is commonly observed under well-managed conditions. The present results show that although further testing is required for yield prediction, the present modification to the original DSSAT model improves the precision of the soil moisture profile under subsurface irrigation and can be used for decision support for efficient producting of processing tomatoes.
Figures


Figures from the paper (8 more)




Reference graph
Works this paper leans on
-
[1]
[WPTC, 2018] World Processing Tomato Council,
work page 2018
-
[3]
Model structure and validation. Ecol Model. 82(2), 109-129. https://doi.org/10.1016/0304-3800(94)00084-U. [van Genuchten, 1980] Van Genuchten, M. T.,
-
[4]
Soil Sci. Soc. Am. J., 44(5), 892-898. https://doi.org/10.2136/sssaj1980.03615995004400050002x. [Jones et al., 2014] Jones C.D., Morgan K.T., Porter C.H., Wu J.Z., Fraisse C.W., Zotarelli L.,
arXiv 2014
-
[11]
[GlobalSecurity.org] GlobalSecurity.org,
http://www.soilmanagementindia.com/soil-water/flow- of-water-in-the-soil-soil-water-relationship-agronomy/4509 (accessed on 2nd August 2019). [GlobalSecurity.org] GlobalSecurity.org,
work page 2019
-
[13]
[DACOM, Emmen, The Nederlands] DACOM, Emmen, Nederlands,
https://www.dacom.nl/en/products/ weather-station/ (accessed on 2nd August 2019). [DACOM, Emmen, The Nederlands] DACOM, Emmen, Nederlands,
work page 2019
-
[14]
[CIMIS Sensors] CIMIS Sensors,
https://www.dacom.nl/en/ (ac- cessed on 2nd August 2019). [CIMIS Sensors] CIMIS Sensors,
work page 2019
-
[15]
[CIMIS] The California Irrigation Management Information System (CIMIS),
https://cimis.water.ca.gov/Stations.aspx (accessed on 2nd August 2019). [CIMIS] The California Irrigation Management Information System (CIMIS),
work page 2019
- [16]
Show all 30 references
-
[17]
[Clevers, 1988] Clevers J.G.P.W.,
http://www.esa.int/Our Activities/Observing the Earth/Copernicus/Sentinel-2 (ac- cessed on 2nd August 2019). [Clevers, 1988] Clevers J.G.P.W.,
2019
-
[20]
Nature, 562, 519-525
Options for keeping the food system within environmental limits. Nature, 562, 519-525. https://doi.org/10.1038/s41586-018-0594-0. [Ayars, 1999] Ayars, J.E., Phene, C.J., Hutmacher, R.B., Davis, K.R., Schoneman, R.A., Vail, S.S., Mead, R.M.,
1999 doi
-
[25]
University of Hawaii, Honolulu, HI [Jones et al., 2003] Jones, J., Hoogenboom, G., Porter, C., Boote, K., Batchelor, W., Hunt, L., Wilkens, P., Singh, U., Gijsman, A., Ritchie, J.,
DSSAT v4.5: Crop Model Documentation. University of Hawaii, Honolulu, HI [Jones et al., 2003] Jones, J., Hoogenboom, G., Porter, C., Boote, K., Batchelor, W., Hunt, L., Wilkens, P., Singh, U., Gijsman, A., Ritchie, J.,
2003
-
[27]
DSSAT Foundation, Gainesville, Florida, USA
Decision Support System for Agrotechnology Transfer (DSSAT) Version 4.7.5 (https://DSSAT.net). DSSAT Foundation, Gainesville, Florida, USA. [Heuvelink, 1999] Heuvelink, E.,
1999
-
[28]
Evaluation of a Dynamic Simulation Model for Tomato Crop Growth and Development. Ann. Bot. 83, 413-422. https://doi.org/10.1006/anbo.1998.0832. [Soto et al., 2014] Soto, F., Gallardo, M., Gimnez, C., Pea-Fleitas, T., Thompson, R.B.,
1998
-
[29]
Sim- ulation of tomato growth, water and N dynamics using the EU-Rotate N model in Mediter- ranean greenhouses with drip irrigation and fertigation. Agric. Water Manag., 132, 46-59. https://doi.org/10.1016/j.agwat.2013.10.002. [Boote et al., 2012] Boote, K.J., Rybak, M.R., Sch...
2013 doi
-
[1976]
Water Resour
A new model for predicting the hydraulic conductivity of unsatu- rated porous media. Water Resour. Res., 12(3), 513-522. http://dx.doi.org/10.1029/WR012i003p00513. [Kosugi, 2007] Kosugi K.,
2007 doi
-
[1979]
[Soil Management HP] Soil Management HP,
http://hydrogeologistswithoutborders.org/wordpress/ 1979-english/chapter-2/ (accessed on 2nd August 2019). [Soil Management HP] Soil Management HP,
1979
-
[1988]
Remote Sensing Environ., 25, 53-69
The derivation of a simplified reflectance model for the estimation of leaf area index. Remote Sensing Environ., 25, 53-69. https://doi.org/10.1016/0034-4257(88)90041-7. [Clevers, 1991] Clevers J.G.P.W.,
1991 doi
-
[1991]
Application of the WDVI in estimating LAI at the generative stage of barley. ISPRS J. Photogramm. Remote Sens., 46, 37-47. https://doi.org/10.1016/0924-2716(91)90005- G. [USDA, 2018 Tomato Report] USDA, 2018 Tomato Report, 2018.https://www.nass.usda.gov/ Statistics by State/Ca...
2018 doi
-
[1994]
[DACOM WEATHER STATION] DACOM Weather Station,
https://www.globalsecurity.org/military/library/policy/ army/fm/5-484/Ch2.htm (accessed on 2nd August 2019). [DACOM WEATHER STATION] DACOM Weather Station,
2019
-
[1999]
Subsurface drip irrigation of row crops: a review of 15 years of research at the Wa- ter Management Research Laboratory. Agric. Water Manag., 42, 1-27. https://doi.org/10.1016/S0378- 3774(99)00025-6. [Ayars, 2015] Ayars, J.E., Fulton, A., Taylor, B.,
2015 doi
-
[2003]
The DSSAT cropping system model. Eur. J. Agron., 18, 235-265. https://doi.org/10.1016/S1161-0301(02)00107-7. [Hoogenboom et al., 2019] Hoogenboom, G., Porter, C.H., Shelia, V., Boote, K.J., Singh, U., White, J.W., Hunt, L.A., Ogoshi, R., Lizaso, J.I., Koo, J., Asseng, S., Sing...
2019 doi
-
[2007]
A new model for predicting the hydraulic conductivity of unsaturated porous media
Reviewing classical studies in soil physics “A new model for predicting the hydraulic conductivity of unsaturated porous media” By Y. Mualem Water Resources Research, Vol. 12, No. 3, 513-522 (1976) and “A closed-form equation for predicting the hydraulic conductivity of unsatu...
1976
-
[2008]
University of California, Agriculture and Natural Re- sources
Processing Tomato Production in California. University of California, Agriculture and Natural Re- sources. https://doi.org/10.3733/ucanr.7228. [DSSAT manual] Jones, J.W., Hoogenboom, G., Wilkens, P.W., Porter, C.H., Tsuji, G.Y. (Editors),
-
[2011]
Water SA, 37(4), 483-494
A comparison of soil moisture re- lations between standing and clearfelled plots with burnt and unburnt harvest residue treatments of a clonal eucalypt plantation on the Zululand Coastal Plain, South Africa. Water SA, 37(4), 483-494. http://dx.doi.org/10.4314/wsa.v37i4.6. [Ack...
-
[2012]
HortScience, 47, 1038-1049
Improving the CROPGRO-Tomato Model for Predicting Growth and Yield Response to Temperature. HortScience, 47, 1038-1049. https://doi.org/10.21273/HORTSCI.47.8.1038
-
[2013]
Reduced nitrous oxide emissions and increased yields in California tomato cropping systems under drip irrigation and fertigation. Agric. Ecosyst. Env- iron., 170, 16-27. https://doi.org/10.1016/j.agee.2013.02.002. [Hartz, 2008] Hartz, T., Miyao, G., Mickler, J., Lestrange, M.,...
2013 doi
-
[2014]
Addi- tion of a two-dimensional water balance model to the DSSAT-CSM. Trans. ASABE, 57(6), 1643-1656. https://doi.org/10.13031/trans.57.10629. [Mualem et al., 1976] Mualem, Y.,
1976 doi
-
[2015]
Water Manag., 157, 39-47
Subsurface drip irrigation in CaliforniaHere to stay? Agric. Water Manag., 157, 39-47. https://doi.org/10.1016/j.agwat.2015.01.001. [Kennedy, 2013] Kennedy, T.L., Suddick, E.C., Six, J.,
2015 doi
-
[2018]
[Samuel et al., 1995] Evans, S.P
http://www.westconfoods.com/wp-content/uploads/2018/12/WPTC-announcement-10-25- 2018.pdf (accessed 2nd August 2019). [Samuel et al., 1995] Evans, S.P. and Trevisan, M.,
2018
-
[2019]
[SB Dovey et al., 2011] Dovey, S.B., de Cercq, W., du Toit,B.,
https://www.nrcs.usda.gov/wps/portal/nrcs/detail/ soils/survey/office/ssr10/tr/?cid=nrcs144p2 074846 (accessed on 2nd August 2019). [SB Dovey et al., 2011] Dovey, S.B., de Cercq, W., du Toit,B.,
2019
Reviewed August 14, 2026 · model on record in the stance chip above.
Discussion (0). Continue with ORCID to comment.