REVIEW 4 major objections 5 minor 31 references
Transient Blurring of the Scintillation Arc of Pulsar B1737+13
T0 review · 4 major / 5 minor · reviewed 2026-08-11 · deepseek-v4-flash
Pith's one-line read The weeks-long blurring of the scintillation arc of pulsar B1737+13 is traced to a compact secondary scattering screen crossing the line of sight at about 2065 pc, with a transverse size of 1-3 au.
desk verdict The transient event is real and the new screen-localization method is promising, but the specific distances and the 1–3 au size are provisional and the paper's own boundary problem is not resolved. read the letter →
The pith
A machine-rendered reading of the paper's core claim, the machinery that carries it, and where it could break.
The reading
What carries the argument
The central machinery is the mapping between the measured conjugate-spectrum coordinates, Doppler shift $f_D$ and delay $\tau$, and positions on the sky: $\tau = d_{\rm eff}\theta^2/(2c)$ and $f_D = -\vec{V}_{\rm eff}\cdot\vec{\theta}/\lambda$. The arc curvature $\eta = d_{\rm eff}\lambda^2/(2cV_{\rm eff}^2)$ identifies each screen, and the paper's new tool is a displacement test: for each assumed secondary-screen distance, project the wavefield features onto the sky and measure how far their positions drift across six epochs; the distance that minimizes the drift (2065 pc) is adopted. Phase retrieval and the $\theta$-$\theta$ transform provide the feature positions, two-screen simulations check the geometry, and the paper introduces 'interaction arcs' to explain the diffuse power produced when light scatters off both screens.
What would settle it
A VLBI observation of B1737+13 that directly images the two scattering screens would settle the geometry: if the secondary screen is not near 2065 pc or does not remain stationary on the sky, the displacement-test solution and the derived 1-3 au size are wrong. A cheaper check is to evaluate the displacement metric at several distances slightly above 2060 pc; a monotonic decrease toward the boundary would indicate that the 2065 pc solution is an artifact.
Extended reading notes
Core claim
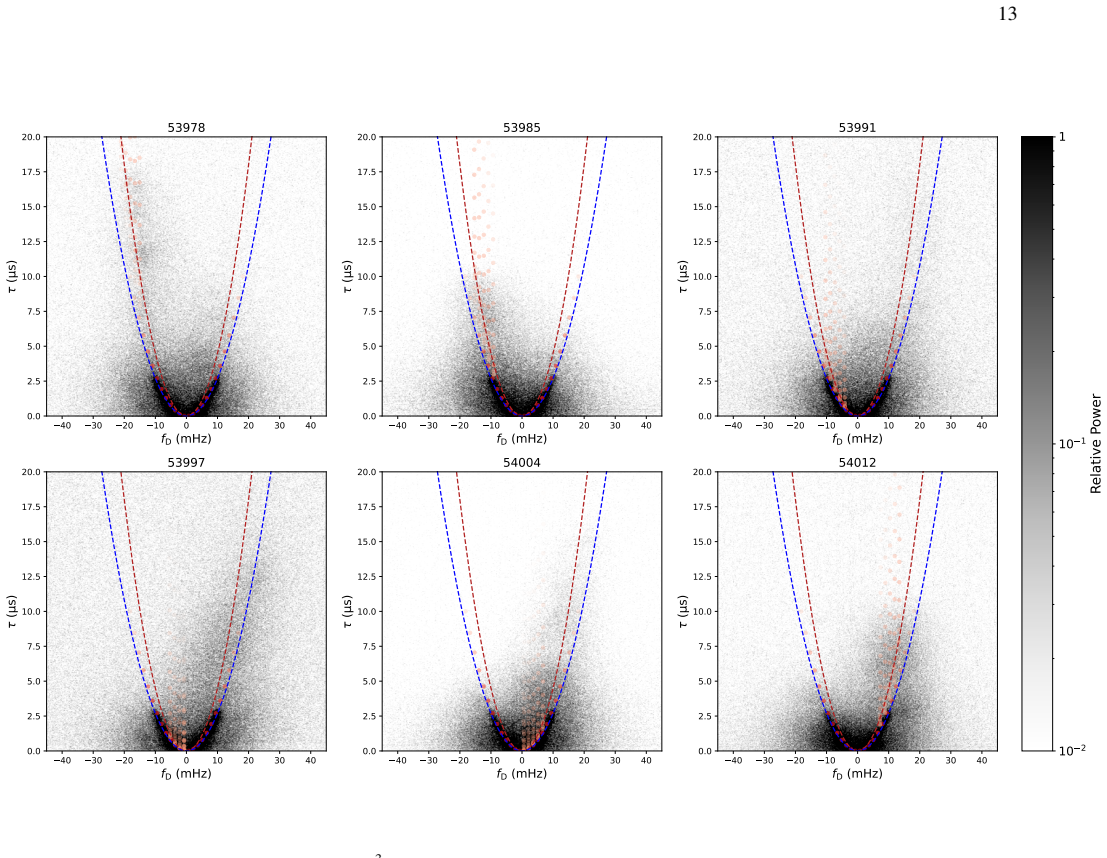
On the paper's own terms, the discovery is that the transient 'fuzziness' in the secondary spectra of PSR B1737+13 between MJD 53978 and 54050 is the signature of a compact secondary scattering screen passing through the line of sight. The main screen stays at its long-lived location, while the secondary screen—located at roughly 2065 pc, oriented near 48 degrees, and moving with negligible transverse velocity—produces a separate parabolic arc and, when light scatters off both screens, diffuse interaction power that washes out the main arc. The paper argues that the secondary screen's distance is fixed by a displacement test that minimizes the on-sky motion of the feature over six epochs, that this test recovers the known geometry of B0834+06, and that the inferred 1-3 au transverse size is consistent with the structures invoked for extreme scattering events.
Load-bearing premise
The secondary screen's distance is found by minimizing the on-sky displacement of features, but the solution sits at the minimum distance (about 2060 pc) at which any real sky image exists for the measured $(f_D,\tau)$ pairs; if the displacement metric falls monotonically as that boundary is approached, the inferred distance, orientation, and lens size are coordinate artifacts rather than physical constraints.
Editorial extensions
If this is right
- Single-dish observations can localize a transient secondary scattering screen, not merely notice its effect.
- The displacement test offers a way to search archival dynamic spectra for similar double-lensing transits in other pulsars.
- The inferred 1-3 au secondary lens size, together with its roughly six-week transit, matches the size and timescale expected for extreme-scattering-event structures.
- The interaction-arc picture predicts that 'fuzzy' secondary spectra are a diagnostic of double scattering, so such fuzziness can be used to identify candidate two-screen geometries.
Reading between the lines
- If the displacement metric decreases monotonically as the screen distance approaches its geometric minimum, then the 2065 pc distance and 48-degree orientation may be boundary artifacts; this can be checked by plotting the displacement as a function of distance above 2060 pc.
- The analysis assumes both screens have zero transverse velocity; relaxing that assumption would shift the fitted distances and the 1-3 au size estimate, so the size should be read as conditional on the static-screen assumption.
- The method should be applicable to other weakly lensed pulsars, but B0834+06—where the true distance lies near the same boundary—does not fully test the boundary-bias concern.
- If the secondary structure is a corrugated sheet feature rather than a discrete lens, the measured 'size' combines spatial extent with crossing time, and the 1-3 au may not be a physical radius.
Editorial analysis
A structured set of objections, weighed in public.
Referee Report
Summary. The paper reports a transient blurring episode in the scintillation arcs of PSR B1737+13 observed with Arecibo over 37 weeks. The authors show that the secondary spectra become "fuzzy" between MJD 53978 and 54050, and they attribute this to a secondary scattering screen crossing the line of sight. Using phase retrieval, they isolate a moving feature that they associate with the secondary screen, measure its approximate curvature (0.045 s^3), and track its Doppler motion. They attempt to constrain the screen geometry by annual fitting of the main-arc curvature and by a new displacement test that maps the secondary feature onto the sky for different assumed screen distances. They propose a main screen at 2740 pc and 76 degrees and a secondary screen at 2065 pc and 48 degrees, validate the displacement method on B0834+06, and use the resulting geometry to estimate the secondary lens size as 1-3 au. The paper also introduces the concept of interaction arcs to explain the fuzziness in double-lensing events.
Significance. If the proposed geometry is correct, this is one of the few doubly lensed pulsar events studied in detail, and the displacement test would be a valuable single-dish tool for localizing screens without VLBI. The qualitative phenomenon -- a transient change from clear arclets to a blurred arc and back -- is directly visible in the secondary spectra and is likely real. The paper is honest about the limitations of the analysis, explicitly stating that the parameters in Table 1 are only one possible solution and that the secondary lens size is a rough estimate. The validation on B0834+06, recovering a distance within 1.8 sigma of the VLBI value, lends some support to the method. However, the quantitative geometry rests on fragile assumptions, and the derived distances and sizes are not yet firmly established.
major comments (4)
- [§3.2, Figure 8] The main screen solution is not actually determined by the data. The grid search finds the minimum reduced chi^2 at about 3830 pc, but the paper selects 2740 pc with reduced chi^2 = 2.88 based on the prior that screens near the midpoint are preferred. This is an arbitrary choice that is not statistically justified, and a reduced chi^2 of 2.88 indicates a poor fit. Since the subsequent sky mapping, displacement test, and lens-size estimate all depend on the main screen distance and orientation, the quoted geometry should be treated as a working assumption, and the sensitivity of the results to the main-screen parameters should be quantified over the full allowed range.
- [§3.5, text before Eq. (6) and Figure 10] The displacement test for the secondary screen searches distances from 2060 to 3400 pc, but the minimum is found at 2065 pc, only 5 pc above the real-solution boundary. The paper does not show the displacement statistic as a function of distance over the full search range; it only displays the sky images for 2065 and 2600 pc. If the displacement decreases monotonically as the boundary is approached, the inferred 2065 pc distance and 48-degree orientation are artifacts of the coordinate transformation rather than physical constraints. Please present the full displacement-versus-distance curve and demonstrate that an interior minimum exists. The B0834+06 validation in Appendix B does not retire this concern, because that system's solution is well interior to its boundary.
- [§3.4, Eq. (5) and Figure 9] The consistency check for the secondary curvature uses the same eta = 0.045 s^3 that was obtained by eye-fitting in the same section. The predicted motion of 22 mHz over 27 days and the measured shift of about 25 mHz therefore constitute a self-consistency check, not an independent confirmation of the curvature. Because the Hough transform and theta-theta methods both failed to measure the secondary curvature, the value is not robustly determined. This uncertainty affects the identification of the feature and the simulation. An independent estimate of the secondary curvature, or an explicit statement that it is assumed, is needed.
- [§3.7] The lens size estimate of 1-3 au depends on the magnification measured from flux in chosen boxes and on the assumed screen geometry. Given the weakly constrained screen distances and the lack of a robust secondary-screen distance, the size range should be reported as a rough scale estimate with a clear discussion of systematic uncertainties, not as a measured size. In particular, the transverse size scales linearly with the assumed secondary-screen distance, so the 1-3 au range inherits the uncertainty of the 2065 pc solution.
minor comments (5)
- [Figure 1 and throughout] There are several typos: "Frequency" is misspelled in Figure 1, "conjugated spectrum" should be "conjugate spectrum" in multiple places, and the abstract reads "Although this an appropriate size," which is missing "is."
- [§3.3 and Figure 9] The text refers to "MJD 58985" in several places; this should be MJD 53985 to match the observation dates.
- [Appendix B, Figure 18] The caption of Figure 18 says "415 pc is the distance with the minimum displacement in the displacement test," but the text and Figure 19 state that the minimum is at 435 pc. This inconsistency should be corrected.
- [§3.5] The description of the displacement test does not specify how the top and bottom points of the secondary feature are selected or how their uncertainties are estimated. A short explanation would improve reproducibility.
- [Appendix A] The phrase "capable of causing fuzziness in a secondary spectra of" is an incomplete sentence; please rephrase.
Circularity Check
Mostly self-contained; the secondary-arc curvature is fitted by eye and then used in Eq. (5) to 'predict' the same feature motion, a self-consistency check rather than an independent test.
-
fitted input called prediction
[Section 3.4, Equation (5) and following paragraph (Figure 9)]
"We can further justify this curvature by noting that, for the one-dimensional screen assumption, the time derivative of fD for any image on the arc is given by fdot = 1/(2η ν) = 0.82±0.08 mHz day−1 (5)... For an arc with curvature 0.045 s3, features are expected to move 22 mHz during the 27 days from MJD 58985 and 54012. In Figure 9, the distance between the two moving feature is about 25 mHz, which is consistent with the value we got from the time derivative."
The curvature η=0.045 s3 was obtained by eye-fitting a parabola through the centers of the secondary feature at MJD 53985 and MJD 54012 (Figure 9). The 25 mHz separation between those two epochs is an input to that fit. Equation (5) then uses the same η to compute an expected 22 mHz drift, and the agreement is quoted as justification ('We can further justify this curvature'). The 'prediction' is therefore a restatement of the fitted curvature in rate units, not an independent test; the 22 vs 25 mHz agreement is a self-consistency check.
full rationale
The paper's central claims are the transient double-lensing event, the two-screen geometry, and the 1-3 au secondary-lens size. These are not circular: they are derived from the dynamic spectra via phase retrieval and a displacement test, and the displacement test is externally checked on B0834+06 against VLBI distances (Appendix B), where the recovered 435 pc is near the known 415 pc. The one clear circularity is in Sec. 3.4: the secondary curvature η=0.045 s3 is chosen by eye to pass through the feature at MJD 53985 and 54012, and then Eq. (5) uses that same η to compute an expected 22 mHz drift that is compared with the 25 mHz separation between the same two epochs. This is a self-consistency check, not an independent prediction; the agreement does not independently validate the curvature. A separate robustness concern, not a circularity, is that the displacement minimum for the secondary screen occurs at 2065 pc, only 5 pc above the 2060 pc real-image boundary; the paper shows the displacement statistic only at two distances and does not establish that the minimum is interior, so the quoted geometry and size may be vulnerable to a boundary artifact. This does not make the derivation circular, but it lowers confidence in the headline distance. No load-bearing self-citation chain or uniqueness import was found.
Assumptions & free parameters
free parameters (5)
- Main screen distance =
2740 pc
- Main screen orientation =
76 deg
- Secondary screen curvature =
0.045 s^3 (approx. error 0.005)
- Secondary screen distance =
2065 pc
- Secondary screen orientation =
48 deg
assumptions (5)
- domain assumption Single thin-screen scintillation model with parabolic arcs (tau = eta f_D^2) applies to the main screen.
- domain assumption All scattering screens have zero transverse velocity.
- domain assumption The phase retrieval algorithm of Baker et al. (2022) correctly recovers the wavefield from the secondary spectrum.
- domain assumption The pulsar distance of 4.2 kpc and proper motion [-22, -20] mas/yr from Brisken et al. (2003) are correct.
- domain assumption The magnification-size relation mu = dtheta/dbeta and isotropic pulsar emission are valid for the size estimate.
invented entities (1)
-
Interaction arcs and interaction curvature
Cite this review
Pith. "Pith review of Transient Blurring of the Scintillation Arc of Pulsar B1737+13." pith.science (2026). https://pith.science/paper/UDDXJWQ2
@misc{pith2026241210323,
  author       = {Pith},
  title        = {Pith review of: Transient Blurring of the Scintillation Arc of Pulsar B1737+13},
  year         = {2026},
  howpublished = {\url{https://pith.science/paper/UDDXJWQ2}},
  note         = {Machine review of arXiv:2412.10323}
}
read the original abstract
For many pulsars, the scattering structures responsible for scintillation are typically dominated by a single, thin screen along the line of sight, which persists for years or decades. In recent years, an increasing number of doubly-lensed events have been observed, where a secondary lens crosses the line of sight. This causes additional or distorted scintillation arcs over time scales ranging from days to months. In this work we report such a transient event for pulsar B1737+13 and propose a possible lensing geometry including the distance to both lenses, and the orientation of the main screen. Using phase retrieval techniques to separate the two lenses in the wavefield, we report a curvature and rate of motion of features associated with the secondary lens as it passed through the line of sight. By fitting the annual variation of the curvature, we report a possible distance and orientation for the main screen. The distance of the secondary lens is found by mapping the secondary feature onto the sky and tracking its position over time for different distances. We validate this method using B0834+06, for which the screen solutions are known through VLBI, and successfully recover the correct solution for the secondary feature. With the identified lensing geometry, we are able to estimate the size of the secondary lens, 1 - 3 au. Although this an appropriate size for a structure that could cause an extreme scattering event, we do not have conclusive evidence for or against that possibility.
Figures


Figures from the paper (16 more)




Reference graph
Works this paper leans on
-
[1]
, " * write output.state after.block = add.period write newline
ENTRY address archivePrefix author booktitle chapter doi edition editor eprint howpublished institution journal key month number organization pages publisher school series title misctitle type volume year version url label extra.label sort.label short.list INTEGERS output.state before.all mid.sentence after.sentence after.block FUNCTION init.state.consts ...
-
[2]
write newline
" write newline "" before.all 'output.state := FUNCTION format.url url empty "" new.block "" url * "" * if FUNCTION format.eprint eprint empty "" archivePrefix empty "" archivePrefix "arXiv" = new.block " " eprint * " " * new.block " " eprint * " " * if if if FUNCTION format.doi doi empty "" " " doi * " " * if FUNCTION format.pid doi empty eprint empty ur...
-
[3]
lr Z Ԡ GԢ/ Bxp d #Au'(6y <Z X u OW|V b f :I, ˢZe ^1MA e#Q Z0Fp9G 3*ܴ -g &* g;B P2' ?
thebibliography [1] 20pt to REFERENCES 6pt =0pt -12pt 10pt plus 3pt =0pt =0pt =1pt plus 1pt =0pt =0pt -12pt =13pt plus 1pt =20pt =13pt plus 1pt \@M =10000 =-1.0em =0pt =0pt 0pt =0pt =1.0em @enumiv\@empty 10000 10000 `\.\@m \@noitemerr \@latex@warning Empty `thebibliography' environment \@ifnextchar \@reference \@latexerr Missing key on reference command E...
2021
-
[4]
Baker , D., Brisken , W., van Kerkwijk , M. H., et al. 2022, , 510, 4573, 10.1093/mnras/stab3599
-
[5]
H., van Lieshout, R., & Pen, U.-L
Baker, D., Brisken, W., van Kerkwijk, M. H., van Lieshout, R., & Pen, U.-L. 2023, Monthly Notices of the Royal Astronomical Society, 525, 211, 10.1093/mnras/stad2318
-
[6]
2002, , 581, 495, 10.1086/344169
Bogdanov , S., Pruszy \'n ska , M., Lewandowski , W., & Wolszczan , A. 2002, , 581, 495, 10.1086/344169
doi:10.1086/344169 2002
-
[7]
Brisken, W. F., Fruchter, A. S., Goss, W. M., Herrnstein, R. M., & Thorsett, S. E. 2003, The Astronomical Journal, 126, 3090, 10.1086/379559
doi:10.1086/379559 2003
-
[8]
Brisken , W. F., Macquart , J. P., Gao , J. J., et al. 2010, , 708, 232, 10.1088/0004-637X/708/1/232
Show all 31 references
- [9]
-
[10]
M., Rickett , B
Cordes , J. M., Rickett , B. J., Stinebring , D. R., & Coles , W. A. 2006, , 637, 346, 10.1086/498332
2006 doi
-
[11]
L., Dennison , B., Johnston , K
Fiedler , R. L., Dennison , B., Johnston , K. J., & Hewish , A. 1987, , 326, 675, 10.1038/326675a0
1987 doi
-
[12]
A., & Stinebring , D
Hemberger , D. A., & Stinebring , D. R. 2008, , 674, L37, 10.1086/528985
2008 doi
- [13]
-
[14]
2016, , 458, 1289, 10.1093/mnras/stw314
Liu , S., Pen , U.-L., Macquart , J.-P., Brisken , W., & Deller , A. 2016, , 458, 1289, 10.1093/mnras/stw314
2016 doi
-
[15]
Lyne , A. G. 1984, , 310, 300, 10.1038/310300a0
1984 doi
-
[16]
A., Sanidas , S
Main , R. A., Sanidas , S. A., Antoniadis , J., et al. 2020, , 499, 1468, 10.1093/mnras/staa2955
2020 doi
-
[17]
R., Simard , D., Main , R
Marthi , V. R., Simard , D., Main , R. A., et al. 2021, , 506, 5160, 10.1093/mnras/stab1970
2021 doi
-
[18]
W., Zhu , H., Stinebring , D
McKee , J. W., Zhu , H., Stinebring , D. R., & Cordes , J. M. 2022, , 927, 99, 10.3847/1538-4357/ac460b
2022 doi
- [19]
-
[20]
2014, , 442, 3338, 10.1093/mnras/stu1020
Pen , U.-L., & Levin , Y. 2014, , 442, 3338, 10.1093/mnras/stu1020
2014 doi
- [23]
-
[24]
Rickett , B. J. 1990, , 28, 561, 10.1146/annurev.aa.28.090190.003021
1990
-
[25]
J., Lyne , A
Rickett , B. J., Lyne , A. G., & Gupta , Y. 1997, , 287, 739, 10.1093/mnras/287.4.739
1997 doi
-
[27]
2014 b , , 787, 161, 10.1088/0004-637X/787/2/161
---. 2014 b , , 787, 161, 10.1088/0004-637X/787/2/161
2014 doi
-
[28]
2018, , 478, 983, 10.1093/mnras/sty1140
Simard , D., & Pen , U.-L. 2018, , 478, 983, 10.1093/mnras/sty1140
2018 doi
-
[29]
2022, , 515, 6198, 10.1093/mnras/stac2160
Sprenger , T., Main , R., Wucknitz , O., Mall , G., & Wu , J. 2022, , 515, 6198, 10.1093/mnras/stac2160
2022 doi
-
[31]
2021, , 500, 1114, 10.1093/mnras/staa3353
Sprenger , T., Wucknitz , O., Main , R., Baker , D., & Brisken , W. 2021, , 500, 1114, 10.1093/mnras/staa3353
2021 doi
-
[32]
R., McLaughlin , M
Stinebring , D. R., McLaughlin , M. A., Cordes , J. M., et al. 2001, , 549, L97, 10.1086/319133
2001 doi
-
[33]
H., & van Lieshout, R
van Kerkwijk, M. H., & van Lieshout, R. 2022, mhvk/screens: v0.1, v0.1, Zenodo, 10.5281/zenodo.7455536
2022 doi
-
[34]
A., Melrose , D
Walker , M. A., Melrose , D. B., Stinebring , D. R., & Zhang , C. M. 2004, MNRAS, 354, 43, 10.1111/j.1365-2966.2004.08159.x
2004
-
[35]
R., & van Kerkwijk , M
Zhu , H., Baker , D., Pen , U.-L., Stinebring , D. R., & van Kerkwijk , M. H. 2023, , 950, 109, 10.3847/1538-4357/accde0
2023 doi
Reviewed August 11, 2026 · model on record in the stance chip above.
Discussion (0). Continue with ORCID to comment.