REVIEW 4 major objections 6 minor 7 references
Low-cost low-power in-vehicle occupant detection with mm-wave FMCW radar
T0 review · 4 major / 6 minor · reviewed 2026-08-14 · deepseek-v4-flash
Pith's one-line read This paper reports that a low-cost 77 GHz FMCW radar, using Capon range-azimuth maps and an SVM classifier, detects in-vehicle occupancy by row with 97.8% average accuracy and 100% accuracy on the empty-versus-occupied decision.
desk verdict Useful application note, but the empirical claims are not yet established because the evaluation protocol is under-reported and possibly leaky. read the letter →
The pith
A machine-rendered reading of the paper's core claim, the machinery that carries it, and where it could break.
The reading
What carries the argument
The central object is the range-azimuth map produced by the Capon filter, a minimum-variance beamformer that estimates the angle-of-arrival spectrum while suppressing interference. The map is built per range bin from the covariance matrix $R$ of the eight virtual receiver channels using $\Phi(\hat{\theta}) = 1/[a^H(\hat{\theta}) R^{-1} a(\hat{\theta})]$, where $a(\hat{\theta})$ is the steering vector for a test angle. Because the steering matrix in the covariance model is Vandermonde, $R$ is positive definite and therefore invertible, so the Capon output is well defined. The resulting range-azimuth maps replace the one-dimensional range profile as the input to PCA and then to the SVM, giving the classifier spatial structure to work with despite poor angular resolution.
What would settle it
Collect a new test set in a different minivan with different subjects, retrain with the same 8-to-2 protocol, and check whether empty-versus-occupied accuracy stays at 100% and average row accuracy stays near 97.8%; a large drop would show the reported accuracy is an artifact of the original recording setup. A cheaper check is to inspect whether PCA was fit only on the training portion of the split; if it used the full dataset, the reported test accuracy is optimistically biased.
Extended reading notes
Core claim
The central discovery is that a 77 GHz FMCW radar with only 14 degrees of azimuth resolution (about 25 cm at one meter) can still localize occupants to rows when raw range profiles are converted into range-azimuth maps by a Capon beamformer and those maps are fed to an SVM. The authors define eight classes—empty car, one person in row 1, 2, or 3, one person in each of two rows, and one person in each of three rows—and their classifier separates them, with no false alarms when the car is empty and no occupied case reported as empty. The authors attribute the success to using joint range-azimuth information rather than a one-dimensional range profile, plus PCA to keep the feature set minimal. Their claim is that intelligent feature extraction can make low-resolution, low-cost radar sufficient for row-level occupancy detection.
Load-bearing premise
The accuracy figures stand or fall on the assumption that the evaluation data are independent and representative: if the 8-to-2 split or the 5-fold cross-validation leaks information—for example, the same person appearing in both training and test sets, or PCA fit on the full dataset—the 97.8% and 100% numbers will not reproduce for new people, vehicles, or sessions.
Editorial extensions
If this is right
- A single low-cost automotive radar chip can supply presence and row-level occupancy information without cameras, making child-presence alerts and seat-belt reminders feasible in any trim level.
- The 100% accuracy on the empty-versus-occupied decision means a binary “someone is still in the car” alert is reliable under the tested conditions.
- Reducing the problem from all 128 possible seat combinations to eight row-level classes keeps the classifier tractable while still covering the realistic single-passenger and multi-passenger cases.
- After PCA, the feature dimension is small enough that the SVM step is computationally light, which matters for embedded vehicle hardware.
Reading between the lines
- A testable extension is to compare the Capon range-azimuth maps against ordinary FFT-based beamforming maps with the same SVM; that would show how much of the accuracy gain comes from the Capon filter itself.
- The pipeline likely transfers to other confined cabins such as SUVs or truck cabs, but the 97.8% figure is tied to this minivan's geometry, seat layout, and recording conditions, so per-vehicle retraining would be needed.
- The error pattern visible in the confusion matrix—localization of three occupants is the hardest case—suggests a hierarchical design that first detects empty versus occupied and then localizes occupants might be more robust than a single eight-way classifier.
- A stricter evaluation that splits by subject or by recording session, rather than a random 8-to-2 split, would test whether the method generalizes across people and days.
Signed reviews
Editorial analysis
A structured set of objections, weighed in public.
Referee Report
Summary. The manuscript proposes an in-vehicle occupant detection system using a 77 GHz FMCW radar. The signal processing chain is: range FFT on the received chirps, stationary clutter removal, covariance-matrix estimation across the virtual channels per range bin, 2D Capon range-azimuth spectrum, PCA dimensionality reduction, and SVM classification into eight occupancy scenarios (empty car, each row occupied, and multi-row combinations). Experiments were carried out in a minivan with a TI radar (3Tx/4Rx, two transmitters in TDM mode giving eight virtual receivers). The paper reports 97.8% average accuracy with 5-fold cross-validation and 100% accuracy for distinguishing empty versus occupied. The Capon derivation is standard, but the empirical reporting is incomplete in ways that affect the validity of the headline claims.
Significance. If the reported accuracy is reproducible, the work is practically valuable: it suggests that a low-cost, low-power mm-wave radar combined with a Capon/SVM pipeline can detect occupant presence and coarse row localization in a vehicle, with potential applications in automotive safety, child-presence detection, and IoT sensing. The Capon range-azimuth formulation is standard and is not circular; no fitted quantity is fed back into the accuracy claim. The use of eight clearly defined occupancy classes is a useful framing. However, the empirical contribution is not yet fully validated because the evaluation protocol is under-specified and may suffer from feature leakage. The practical significance therefore depends on the outcome of a properly described and executed cross-validation procedure.
major comments (4)
- [II-B, III] Section II-B states that PCA is applied to reduce the size of the range-azimuth dataset before the 80/20 split, and Section III then reports evaluation with 5-fold cross-validation. If PCA is fit on the entire dataset before any split, the test folds contribute to the feature extractor, violating the independence of training and test data and potentially inflating the reported 97.8% and 100% accuracies. This is load-bearing because these accuracies are the entire empirical contribution. Please specify whether PCA was fit only on the training portion within each cross-validation fold; if it was not, re-run the evaluation with PCA nested inside the cross-validation loop and report the resulting figures.
- [III, experimental setup] The manuscript does not report the number of recordings, subjects, sessions, or samples per class. The statement that recording duration is the same for all classes does not quantify the dataset. Without these numbers, the reader cannot assess class balance, the statistical uncertainty of the 97.8% figure, or whether the test set is representative of the intended operating conditions (e.g., different occupants, seat positions, movements, or sessions). Please provide the total dataset size, the number of samples per class, the number of distinct participants, and the number of recording sessions.
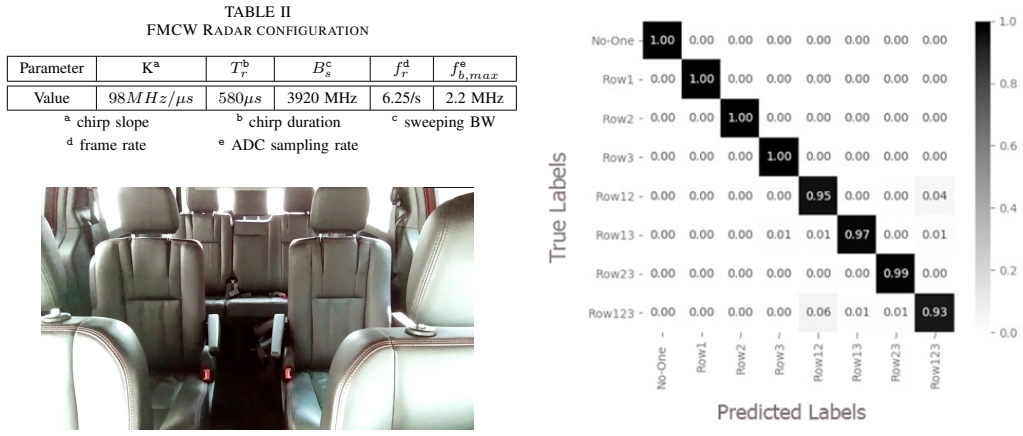
- [III, accuracy reporting] The text is ambiguous about whether 97.8% comes from the 80/20 split described in Section II-B or from the 5-fold cross-validation: Section II-B describes a split 'by the ratio of 8 to 2,' while Section III concludes 'by using 5-fold cross validation, 97.8% correct detection rate is obtained.' Please clarify which protocol produced the reported number, report the per-fold accuracies, and specify whether the confusion matrix in Fig. 4 is aggregated over all test folds or corresponds to a single holdout split.
- [II-B, hyperparameter selection] The SVM hyperparameters are selected by grid search with k-fold cross-validation, and the model is then evaluated with 5-fold cross-validation. Please clarify whether the hyperparameter search was conducted inside each training fold of the 5-fold evaluation (nested cross-validation) or on the full dataset. If the latter, the reported accuracy may be optimistically biased because the test folds would have influenced model selection.
minor comments (6)
- [II-A] There is an incomplete sentence at the end of Section II-A (the fragment 'In an') that should be removed or completed.
- [II-B] The phrase 'principle component analysis' should be 'principal component analysis'; the same typo appears in the Introduction.
- [Fig. 4] The confusion matrix in Fig. 4 has no axis labels; please label the axes with the class names from Table I so that the claims about the first column are directly verifiable.
- [Table II] The row/column headers of Table II are garbled; they should be readable as 'chirp slope, chirp duration, sweeping bandwidth, frame rate, ADC sampling rate' with their corresponding values.
- [Eqs. (1)-(4)] The notation is not fully defined: the signal s(ts) in Eq. (4) is not defined earlier, and the function y(v, fb, tf, ts) in Eq. (2) has an inconsistent argument list relative to its use in Eq. (3). Please define all symbols consistently.
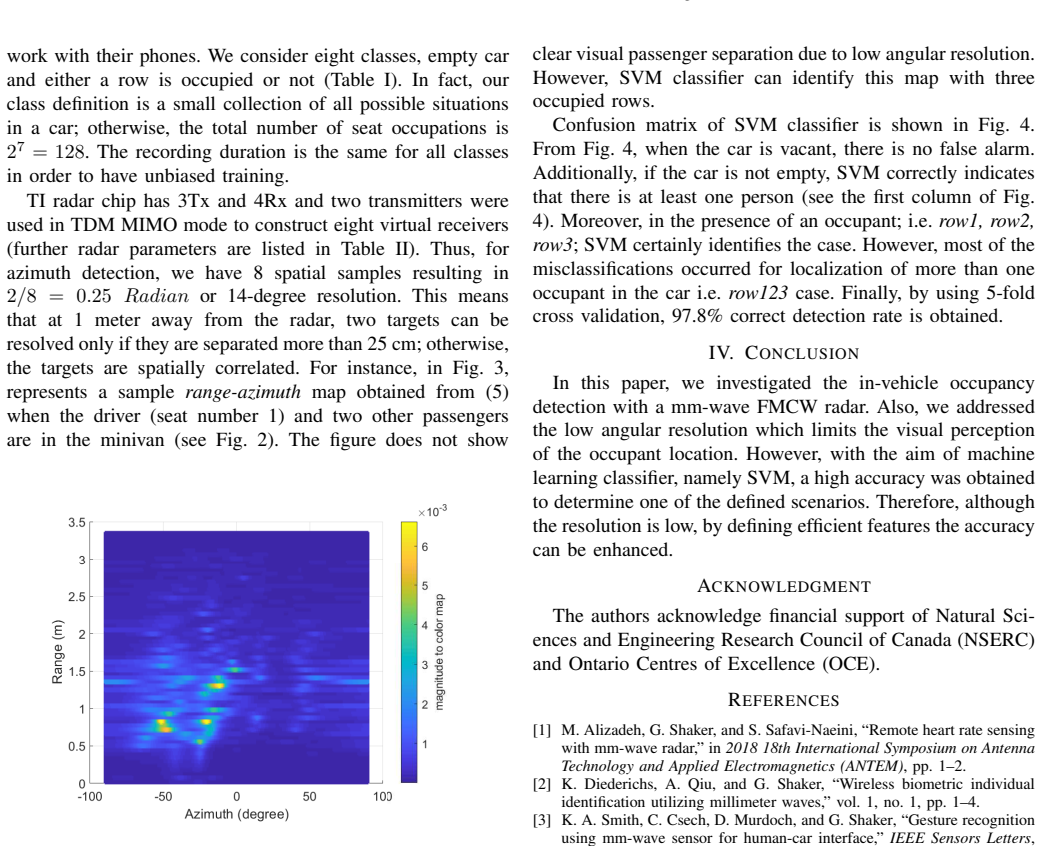
- [Figs. 2 and 3] Figure 2's caption 'Minivan indoor look' is unclear, and Fig. 3 would benefit from labeled axes (range and azimuth) and a colorbar to make the range-azimuth map interpretable.
Circularity Check
No circular derivation: measured accuracy and external Capon formulation make the central claim independent of its inputs.
full rationale
The paper's central claim is an empirical accuracy result obtained by training an SVM on range-azimuth features and testing it with cross-validation. The Capon spectrum in Eq. (5), Phi(theta-hat) = 1 / (a^H(theta-hat) R^{-1} a(theta-hat)), is a standard external signal-processing estimator; it is not derived from the occupancy labels or from the reported accuracy. The 97.8% and 100% figures are presented as measured outcomes, not as quantities that are fitted then re-predicted. The PCA step is described as dimensionality reduction 'without information loss' before the train/test split, and while the evaluation-protocol details are ambiguous, that is a data-leakage or reproducibility concern, not a circularity of the kind where an input is equivalent to the output by construction. The self-citations in the introduction ([1], [4]) are background references for mm-wave radar applications and are not load-bearing for the claimed detection result. No equation is defined in terms of the target result, no fitted parameter is renamed as a prediction, and no uniqueness theorem is imported from the authors' prior work. Therefore the circularity score is 0.
Assumptions & free parameters
free parameters (1)
- SVM hyperparameters =
not reported
assumptions (5)
- domain assumption FMCW point-target signal model of Eq. (1)
- domain assumption Independent receiver noise with positive-definite covariance Rn
- standard math A(theta) is a Vandermonde matrix with positive kernels, making the signal covariance positive definite
- domain assumption Stationary clutter removal by subtracting the average of each range bin
- domain assumption The recording conditions in one minivan represent deployment conditions
Cite this review
Pith. "Pith review of Low-cost low-power in-vehicle occupant detection with mm-wave FMCW radar." pith.science (2026). https://pith.science/paper/UDPBZ6RP
@misc{pith2026190804417,
  author       = {Pith},
  title        = {Pith review of: Low-cost low-power in-vehicle occupant detection with mm-wave FMCW radar},
  year         = {2026},
  howpublished = {\url{https://pith.science/paper/UDPBZ6RP}},
  note         = {Machine review of arXiv:1908.04417}
}
read the original abstract
In this paper, we use a low-cost low-power mm-wave frequency modulated continuous wave (FMCW) radar for the in-vehicle occupant detection. We propose an algorithm using Capon filter for the joint range-azimuth estimation. Then, the minimum necessary features are extracted to train machine learning classifiers to have reasonable computational complexity while achieving high accuracy. In addition, experiments were carried out in a minivan to detect occupancy of each row using support vector machine (SVM). Finally, our proposed system achieved 97.8% accuracy on average in finding the defined scenarios. Moreover, the system can correctly identify if the vehicle is occupied or not with 100% accuracy.
Figures

Reference graph
Works this paper leans on
-
[1]
Remote heart rate sensing with mm-wave radar,
M. Alizadeh, G. Shaker, and S. Safavi-Naeini, “Remote heart rate sensing with mm-wave radar,” in 2018 18th International Symposium on Antenna Technology and Applied Electromagnetics (ANTEM) , pp. 1–2
work page 2018
-
[2]
Wireless biometric individual identification utilizing millimeter waves,
K. Diederichs, A. Qiu, and G. Shaker, “Wireless biometric individual identification utilizing millimeter waves,” vol. 1, no. 1, pp. 1–4
-
[3]
Gesture recognition using mm-wave sensor for human-car interface,
K. A. Smith, C. Csech, D. Murdoch, and G. Shaker, “Gesture recognition using mm-wave sensor for human-car interface,” IEEE Sensors Letters , vol. 2, no. 2, pp. 1–4, June 2018
work page 2018
-
[4]
Remote monitoring of human vital signs using mm-wave fmcw radar,
M. Alizadeh, G. Shaker, J. C. M. D. Almeida, P. P. Morita, and S. Safavi- Naeini, “Remote monitoring of human vital signs using mm-wave fmcw radar,” IEEE Access, vol. 7, pp. 54 958–54 968, 2019
work page 2019
-
[5]
Principal component analysis-based occupancy detection with ultra wideband radar,
Z. Baird, I. Gunasekara, M. Bolic, and S. Rajan, “Principal component analysis-based occupancy detection with ultra wideband radar,” in 2017 IEEE 60th International Midwest Symposium on Circuits and Systems (MWSCAS), Aug 2017, pp. 1573–1576
work page 2017
-
[6]
Short-range millimetric-wave radar system for occupancy sensing application,
A. Santra, R. V . Ulaganathan, and T. Finke, “Short-range millimetric-wave radar system for occupancy sensing application,” IEEE Sensors Letters , vol. 2, no. 3, pp. 1–4, Sep. 2018
work page 2018
-
[7]
Spectral properties of totally positive kernels and matrices,
A. Pinkus, “Spectral properties of totally positive kernels and matrices,” in Total positivity and its applications . Springer, 1996, pp. 477–511
work page 1996
Reviewed August 14, 2026 · model on record in the stance chip above.
Discussion (0). Continue with ORCID to comment.