REVIEW 4 major objections 5 minor 80 references
Flud: a hybrid crowd-algorithm approach for visualizing biological networks
T0 review · 4 major / 5 minor · reviewed 2026-08-14 · deepseek-v4-flash
Pith's one-line read Flud claims that alternating novice crowd workers with a high-temperature simulated annealing algorithm produces higher-scoring layouts of cyclic signaling networks than state-of-the-art automated layout tools, and that the hybrid…
desk verdict A serious GWAP study with a plausible core result, but the printed DP recurrence in the appendix returns zero for every layout, so the headline numbers are unreproducible until the authors correct the text and release code. read the letter →
The pith
A machine-rendered reading of the paper's core claim, the machinery that carries it, and where it could break.
The reading
What carries the argument
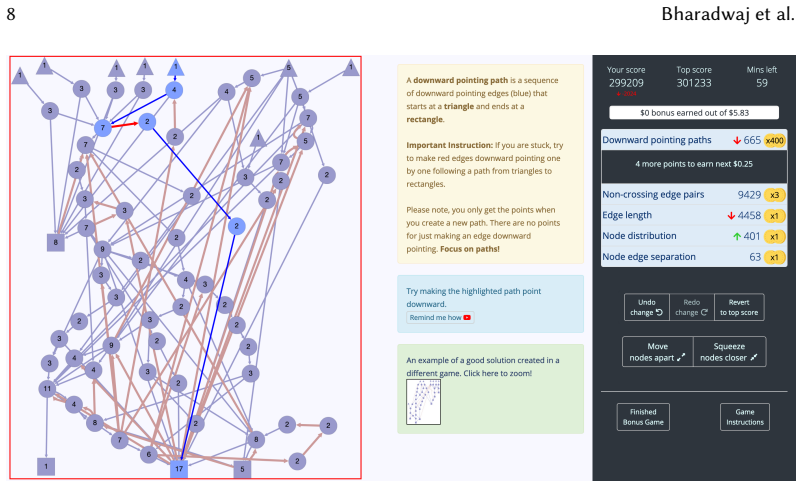
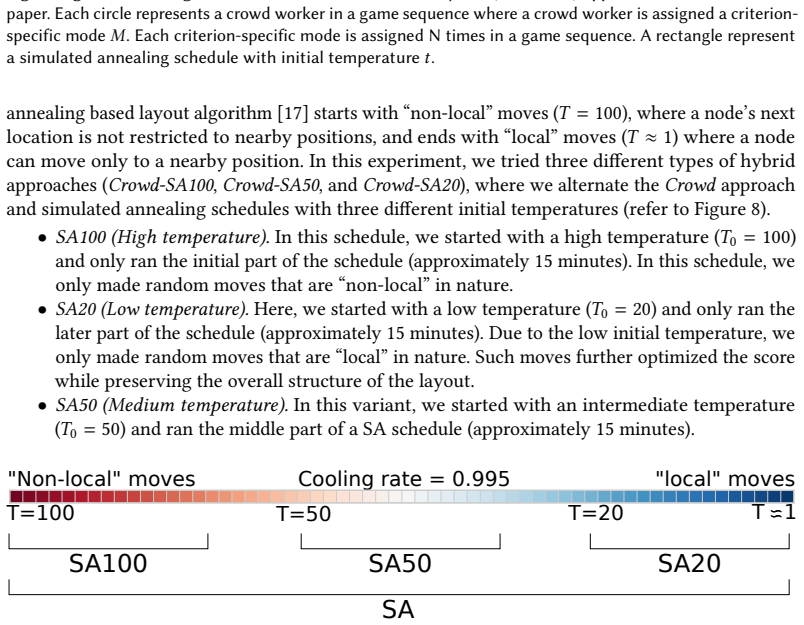
The load-bearing mechanism is the alternating hybrid protocol: a sequence of game sessions in which each crowd worker starts from the best layout so far and is assigned one criterion-specific mode with an algorithmically generated clue, and a simulated annealing schedule begins each of its sessions from the best human layout. The temperature variant matters: SA100 starts at a high temperature ($T_0 = 100$) and makes large, non-local node jumps, which is what lets it reorient edges for the downward-pointing-path criterion after humans have roughly placed them, while low-temperature SA20 only makes local adjustments and behaves differently on distance-based criteria. The paper's central scoring object is the normalized downward-path ratio $\mathrm{DP}(G) = \pi(G)/\rho(G)$, the number of downward-pointing paths divided by the total number of directed paths from sources to targets, combined into an overall weighted score with the four aesthetic criteria.
What would settle it
A pre-registered study in which biologists rank layouts from Crowd-SA100, plain simulated annealing, and Dig-Cola for readability of signal flow, with the DP score hidden and other aesthetics roughly matched, would settle whether the metric the paper optimizes tracks what biologists find useful; if readers show no preference for high-DP layouts, the claimed advantage is an advantage on an author-defined score rather than on biological readability.
Extended reading notes
Core claim
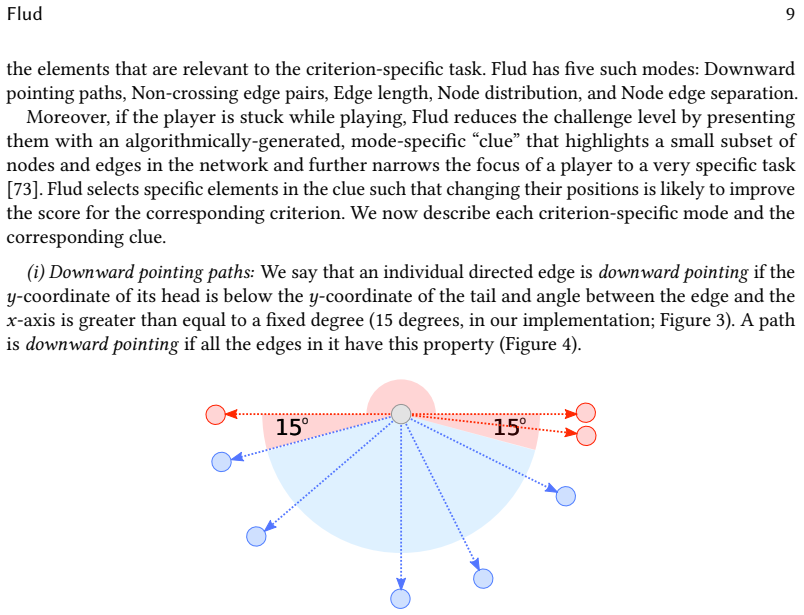
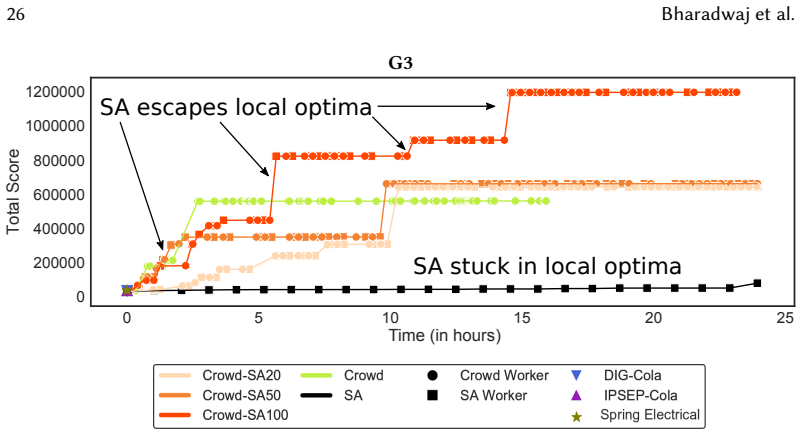
Flud's central claim is that a mixed-initiative loop, in which humans move nodes guided by criterion-specific clues and simulated annealing runs then start from the human-produced layout, can escape the local optima that trap fully automatic layout algorithms on cyclic signaling networks. The paper evaluates this with a weighted score combining five criteria, the dominant one being the number of downward-pointing paths from receptor nodes at the top to transcription-factor targets at the bottom, where an edge counts as downward if it descends at least 15 degrees. On networks G2 and G3, which contain thousands to hundreds of thousands of simple cycles, the crowd and hybrid approaches clearly outperformed simulated annealing, Dig-Cola, IPSEP-Cola, and a spring-electrical force model on both total score and number of downward paths, and Crowd-SA100 achieved a better rate of score improvement per minute than the crowd alone. The authors also report that moving a node that Flud highlighted in a clue increased the criterion score on average, while moving a non-clue node decreased it, evidence that the algorithmic suggestions are what let novices make productive moves.
Load-bearing premise
The paper's measure of a biologically meaningful layout is the number of downward-pointing paths, but this proxy is never validated against actual biologists reading signaling flow, and the paper itself concedes the normalization is a poor approximation on cyclic networks.
Editorial extensions
If this is right
- On signaling networks with many feedback cycles, prioritizing the downward-pointing-path criterion is exactly where automated algorithms collapse and where crowd and hybrid methods win, so biologists working with cyclic networks are the natural users of this approach.
- Crowd-SA100 improves the total score faster per minute than crowd-only play or pure simulated annealing, making the hybrid the efficient choice when crowd time is budgeted.
- Clue-guided moves improve per-criterion scores on average while non-clue moves hurt them, so the algorithmically generated suggestions carry real weight in the reported gains.
- Assigning criterion-specific modes in priority order beats random assignment, giving a concrete design rule for future game-with-a-purpose layout systems.
Reading between the lines
- Because the 15-degree threshold and the DP normalization are implementation choices rather than validated perceptual thresholds, the measured margins over the baselines could shift under a different but equally defensible definition of downward; a sensitivity analysis over that angle parameter would show how brittle the headline result is.
- The hybrid recipe likely generalizes to any cooperative layout task with a cheap scoring function: high-temperature annealing serves as a non-local move generator between human sessions, a pattern the paper itself gestures toward for circuit and interior-design layouts.
- The DP upper bound $\rho(G)$ counts all directed source-to-target paths and is loose on cyclic networks; a tighter bound would rescale the DP scores for G2 and G3 and might narrow the apparent crowd advantage, though probably not reverse it.
- If volunteers engage more deeply than paid crowd workers, as the paper's discussion suggests, the measured crowd advantage may be a lower bound on what a motivated player community could achieve.
Signed reviews
Editorial analysis
A structured set of objections, weighed in public.
Referee Report
Summary. The paper introduces Flud, a game-with-a-purpose for laying out biological signaling networks, along with a hybrid approach in which crowd workers and simulated annealing alternate sessions and build on each other's layouts. Layout quality is measured by a weighted sum of five criteria, including a new downward-pointing-paths (DP) criterion that is given priority weight 400. The authors report two experiments on three signaling networks with varying numbers of cycles: Experiment 1 compares priority-ordered versus random assignment of criterion-specific modes, and Experiment 2 compares Crowd, Crowd-Random, and three Crowd-SA hybrids against SA, Dig-Cola, IPSEP-Cola, and a spring-electrical layout. The central claims are that Crowd and Hybrid approaches clearly outperform automated baselines on the cyclic networks G2 and G3, that Crowd-SA100 achieves a better rate of score improvement than Crowd or SA, and that clue-based suggestions help players improve criterion-specific scores.
Significance. If the results hold, the paper makes a useful empirical contribution to mixed-initiative and human-computation visualization: it demonstrates a concrete, implementable hybrid loop between non-expert crowd workers and simulated annealing for a domain-specific layout objective, and it provides a system (Flud) with publicly described scoring and gameplay mechanics. Strengths include the use of raw downward-pointing-path counts as a corroborating outcome alongside the weighted score, repeated game sequences per network, parameter searches for the automated baselines, and qualitative layout comparisons. The main limitations are that the DP recurrence as printed is internally inconsistent (yielding zero for every layout), no significance tests or confidence intervals are reported, only three networks are used, and the biological meaningfulness of the DP proxy is asserted rather than validated.
major comments (4)
- [Appendix 1, Section 3.3] The downward-pointing-paths recurrence as printed cannot produce the reported results. The recurrence π(v) = Σ_{(v,u) downward} π(u) with base case π(v) = 0 for every node with no downward outgoing edge forces π(v) = 0 for all v by induction on the acyclic downward-edge subgraph, so π(G) = 0 and DP(G) = 0 for every layout. This contradicts the nonzero DP counts in Figure 11 and makes the total-score rankings in Figures 9–13 unreproducible from the text. Please state the intended base case and summation convention (e.g., whether a sink contributes 1 and whether single-edge paths count), define π(G) and ρ(G) unambiguously, and ideally release the scoring code so the reported numbers can be checked.
- [Section 5.2, Figures 10–13] The central comparison relies on medians, distributions, and bar aggregates without significance tests, confidence intervals, or per-condition sample sizes. Because Experiment 2 stopped recruitment once total gameplay exceeded 24 hours (Section 4.5.2), the number of crowd sessions and SA runs can differ across methods and networks. The large effect sizes for G2 and G3 are encouraging, but the statement that Crowd and Hybrid approaches 'clearly outperform' automated methods needs statistical support: report n per condition and provide bootstrap confidence intervals or permutation tests for the total-score and raw-DP-count comparisons.
- [Section 5.2, Figure 13] The rate-of-improvement comparison may be confounded by unequal time horizons. The SA baseline was run for 24 hours (Section 4.5.2), whereas each hybrid SA segment was about 15 minutes and each crowd session up to one hour; average improvement per minute over a 24-hour run is not directly comparable to per-minute improvement over short sessions because SA's early high-rate phase is diluted by long later phases. Please compare methods over matched time budgets or report per-interval rates and learning curves, not only the aggregate per-minute averages.
- [Section 6.2.1, Section 4.5] The headline metric is dominated by the downward-pointing-paths criterion (priority 400 versus 3 and 1 for the other criteria), and the paper itself states that the normalizing denominator ρ(G) is a poor approximation for cyclic networks. The network-specific normalization does not invalidate within-network method comparisons, but it does mean that the quantitative rankings are driven by an author-defined proxy whose biological validity is asserted rather than measured. The raw DP counts in Figure 11 partially ground the claim, yet they are subject to the same recurrence issue as the normalized scores. Please either validate the DP proxy against biologist judgments or explicitly scope the conclusion to 'higher scores on Flud's stated objective,' and show that the G2/G3 conclusions are robust to the DP weight (e.g., wDP = 4, 40, 400).
minor comments (5)
- [Section 3.3] The definition of DP(G) uses ρ(v) where ρ(G) is intended, and the notation for π(v) versus π(G) should be clarified so it is clear that π(G) is the sum over relevant start nodes.
- [Appendix 1] In the recurrence description, 'outgoing neighbors of v that have smaller y-coordinate than u' appears to contain a typo; it should be 'smaller y-coordinate than v' or should otherwise specify the coordinate convention for downward edges.
- [Section 3.4] There is a typo in 'xcur r ent', and the sign convention for Δs in the acceptance probability e^{−Δs/T} should be stated explicitly.
- [Section 3.1] The text contains the typo 'arequester' at the start of Section 3.
- [Section 4.4] The bonus formula uses b and starget without prior definition; please define these variables in the text before the equation.
Circularity Check
No significant circularity: the evaluation compares methods on a disclosed author-defined objective; self-citations are contextual, and the printed DP recurrence bug is a correctness issue, not a circular reduction.
full rationale
The paper's central comparisons (Section 5.2, Figures 10-13) are empirical head-to-head evaluations on the explicitly defined overall score OS(G)=wDP*DP(G)+wEC*EC(G)+wEL*EL(G)+wND*ND(G)+wNED*NED(G) (Section 3.3). All methods—SA, Dig-Cola, IPSEP-Cola, spring-electrical, Crowd, and the Crowd-SA hybrids—are optimized or scored with this same objective, so no method's result is derived from a fitted parameter that is then renamed as a prediction. Measuring success on the same objective used to drive the optimization is standard for layout benchmarking and does not by itself make the comparison circular. The two overlapping-author citations (CrowdLayout [63] and GraphSpace [8]) are related-work and implementation references, not load-bearing premises: no uniqueness theorem or prior result is invoked to force the paper's choice, so the self-citation-chain patterns do not apply. The DP priority of 400 is a disclosed design decision (Section 6.2.1: "we decided to select a very high priority of 400 so that the weighted contribution of downward pointing paths to the overall layout score is generally higher"), not a hidden fit presented as a prediction. There is a genuine correctness problem: Appendix 1 defines pi(v)=sum_{(v,u) downward} pi(u) with base case pi(v)=0, which makes pi(G)=0 for every layout, and Section 6.2.1 concedes the normalizer rho(G) is "a poor approximation" for cyclic networks. That makes the reported DP counts and score differences hard to reproduce from the printed text, and it weakens the external validity of the biological-meaningfulness claim, but it is a bug or limitation rather than an equivalence between premises and conclusion. Accordingly, no circular step is established.
Assumptions & free parameters
free parameters (5)
- DP criterion priority weight wDP =
400
- EC, EL, ND, NED priority weights =
3, 1, 1, 1
- Downward edge angle threshold =
15 degrees
- Bounding box and edge-length constants =
w=5000, h=6000, min edge length=300, penalty=10000
- Simulated annealing schedule parameters =
T0=100, 50, or 20; cooling factor 0.995; 500 iterations; 10n steps
assumptions (5)
- domain assumption Downward-pointing paths proxy the biological flow of signaling information from receptors to transcription factors.
- domain assumption The weighted sum OS(G) is a valid measure of overall layout quality for comparing methods.
- domain assumption Non-expert MTurk workers, after the tutorial puzzles, perform the layout task in good faith and their layouts reflect human spatial reasoning.
- standard math The standard simulated annealing framework (Davidson-Harel) with the stated move generator explores layout space as intended.
- domain assumption The three test networks G1-G3 are representative of signaling pathways in which the DP criterion matters.
Cite this review
Pith. "Pith review of Flud: a hybrid crowd-algorithm approach for visualizing biological networks." pith.science (2026). https://pith.science/paper/UJVFYE44
@misc{pith2026190807471,
  author       = {Pith},
  title        = {Pith review of: Flud: a hybrid crowd-algorithm approach for visualizing biological networks},
  year         = {2026},
  howpublished = {\url{https://pith.science/paper/UJVFYE44}},
  note         = {Machine review of arXiv:1908.07471}
}
read the original abstract
Modern experiments in many disciplines generate large quantities of network (graph) data. Researchers require aesthetic layouts of these networks that clearly convey the domain knowledge and meaning. However, the problem remains challenging due to multiple conflicting aesthetic criteria and complex domain-specific constraints. In this paper, we present a strategy for generating visualizations that can help network biologists understand the protein interactions that underlie processes that take place in the cell. Specifically, we have developed Flud, an online game with a purpose (GWAP) that allows humans with no expertise to design biologically meaningful graph layouts with the help of algorithmically generated suggestions. Further, we propose a novel hybrid approach for graph layout wherein crowdworkers and a simulated annealing algorithm build on each other's progress. To showcase the effectiveness of Flud, we recruited crowd workers on Amazon Mechanical Turk to lay out complex networks that represent signaling pathways. Our results show that the proposed hybrid approach outperforms state-of-the-art techniques for graphs with a large number of feedback loops. We also found that the algorithmically generated suggestions guided the players when they are stuck and helped them improve their score. Finally, we discuss broader implications for mixed-initiative interactions in human computation games.
Figures

Figures from the paper (17 more)






Reference graph
Works this paper leans on
-
[1]
Bo An, Manish Jain, Milind Tambe, and Christopher Kiekintveld. 2011. Mixed-Initiative Optimization in Security Games: A Preliminary Report. In Help Me Help You: Bridging the Gaps in Human-Agent Collaboration, Papers from the 2011 AAAI Spring Symposium, Technical Report SS-11-05, Stanford, California, USA, March 21-23, 2011 . AAAI. http://www.aaai.org/ocs/...
work page 2011
-
[2]
J. Anderson-Lee, E. Fisker, V. Kosaraju, M. Wu, J. Kong, J. Lee, M. Lee, M. Zada, A. Treuille, and R. Das. 2016. Principles for Predicting RNA Secondary Structure Design Difficulty. J. Mol. Biol. 428, 5 Pt A (Feb 2016), 748–757
work page 2016
-
[3]
A.L. Barabasi and Z.N. Oltvai. 2004. Network biology: understanding the cell’s functional organization. Nat Rev Genet 5, 2 (2004), 101–13
work page 2004
-
[4]
Vladimir Batagelj and Andrej Mrvar. 2001. Pajek - Analysis and Visualization of Large Networks. In Graph Drawing. 477–478. https://doi.org/10.1007/3-540-45848-4_54
-
[5]
Andreas Bauer, Michael Kaufmann, Ignaz Rutter, and Julian Vordermeier. CycleXings: Game Idea
-
[6]
Michael Baur and Ulrik Brandes. 2004. Crossing Reduction in Circular Layouts. InGraph-Theoretic Concepts in Computer Science, 30th International Workshop,WG 2004, Bad Honnef, Germany, June 21-23, 2004, Revised Papers (Lecture Notes in Computer Science), Juraj Hromkovic, Manfred Nagl, and Bernhard Westfechtel (Eds.), Vol. 3353. Springer, 332–343. https://d...
-
[7]
Chris Bennett, Jody Ryall, Leo Spalteholz, and Amy Gooch. 2007. The aesthetics of graph visualization. Computational aesthetics 2007 (2007), 57–64
work page 2007
-
[8]
A. Bharadwaj, D. P. Singh, A. Ritz, A. N. Tegge, C. L. Poirel, P. Kraikivski, N. Adames, K. Luther, S. D. Kale, J. Peccoud, J. J. Tyson, and T. M. Murali. 2017. GraphSpace: stimulating interdisciplinary collaborations in network biology. Bioinformatics 33, 19 (Oct 2017), 3134–3136
work page 2017
Show all 80 references
-
[9]
Ria Mae Borromeo and Motomichi Toyama. 2016. An investigation of unpaid crowdsourcing.Human-centric Computing and Information Sciences 6, 1 (2016), 11
2016
-
[10]
Hong, and Christos Faloutsos
Duen Horng Chau, Aniket Kittur, Jason I. Hong, and Christos Faloutsos. 2011. Apolo: making sense of large network data by combining rich user interaction and machine learning. In Proceedings of the SIGCHI Conference on Human Factors in Computing Systems (CHI ’11) . ACM, 167–17...
2011
-
[11]
Bernstein
Justin Cheng and Michael S. Bernstein. 2015. Flock: Hybrid Crowd-Machine Learning Classifiers. In Proceedings of the 18th ACM Conference on Computer Supported Cooperative Work & Social Computing, CSCW 2015, Vancouver, BC, , Vol. 1, No. 1, Article . Publication date: August 201...
2015
-
[12]
Haeyong Chung, Sai Prashanth Dasari, Santhosh Nandhakumar, and Christopher Andrews. 2017. CRICTO: Supporting Sensemaking through Crowdsourced Information Schematization. In 2017 IEEE Conference on Visual Analytics Science and Technology, V AST 2017, Phoenix, AZ, USA, October 3...
2017
-
[13]
Seth Cooper. 2014. A Framework for Scientific Discovery through Video Games (dissertation, updated version) . ACM Books, Vol. 3. ACM / Morgan & Claypool
2014
-
[14]
Seth Cooper, Firas Khatib, Adrien Treuille, Janos Barbero, Jeehyung Lee, Michael Beenen, Andrew Leaver-Fay, David Baker, Zoran Popović, et al. 2010. Predicting protein structures with a multiplayer online game. Nature 466, 7307 (2010), 756
2010
-
[15]
Ben Cowley, Darryl Charles, Michaela Black, and Ray Hickey. 2008. Toward an Understanding of Flow in Video Games. Comput. Entertain. 6, 2, Article 20 (July 2008), 27 pages. https://doi.org/10.1145/1371216.1371223
2008
-
[16]
M Csikszentmihalyi. 1990. Flow: The Psychology of Optimal Experience. HarperCollins Publishers
1990
-
[17]
Ron Davidson and David Harel. 1996. Drawing graphs nicely using simulated annealing.ACM Transactions on Graphics (TOG) 15, 4 (1996), 301–331
1996
-
[18]
Giuseppe Di Battista, Peter Eades, Roberto Tamassia, and Ioannis G Tollis. 1994. Algorithms for drawing graphs: an annotated bibliography. Computational Geometry 4, 5 (1994), 235–282
1994
-
[19]
Duncan, Carsten Gutwenger, Lev Nachmanson, and Georg Sander
Christian A. Duncan, Carsten Gutwenger, Lev Nachmanson, and Georg Sander. 2012. Graph Drawing Contest Report. In Graph Drawing - 20th International Symposium, GD 2012, Redmond, W A, USA, September 19-21, 2012, Revised Selected Papers (Lecture Notes in Computer Science) , Walte...
2012 doi
-
[20]
Tim Dwyer and Yehuda Koren. 2005. DIG-COLA: Directed Graph Layout through Constrained Energy Minimization. In IEEE Symposium on Information Visualization (InfoVis 2005), 23-25 October 2005, Minneapolis, MN, USA , John T. Stasko and Matthew O. Ward (Eds.). IEEE Computer Society...
2005
-
[21]
Tim Dwyer, Yehuda Koren, and Kim Marriott. 2006. IPSep-CoLa: An incremental procedure for separation constraint layout of graphs. IEEE Transactions on Visualization and Computer Graphics 12, 5 (2006), 821–828
2006
-
[22]
Robertson, and Chris North
Tim Dwyer, Bongshin Lee, Danyel Fisher, Kori Inkpen Quinn, Petra Isenberg, George G. Robertson, and Chris North
-
[23]
Peter Eades, Qing-Wen Feng, and Xuemin Lin. 1996. Straight-Line Drawing Algorithms for Hierarchical Graphs and Clustered Graphs. In Graph Drawing, Symposium on Graph Drawing, GD ’96, Berkeley, California, USA, September 18-20, Proceedings (Lecture Notes in Computer Science) , ...
1996 doi
-
[24]
Markus Eiglsperger, Ulrich Fößmeier, and Michael Kaufmann. 2000. Orthogonal graph drawing with constraints. In Proceedings of the Eleventh Annual ACM-SIAM Symposium on Discrete Algorithms, January 9-11, 2000, San Francisco, CA, USA., David B. Shmoys (Ed.). 3–11. http://dl.acm....
2000
-
[25]
Gansner, Eleftherios Koutsofios, Stephen C
John Ellson, Emden R. Gansner, Eleftherios Koutsofios, Stephen C. North, and Gordon Woodhull. 2001. Graphviz - Open Source Graph Drawing Tools. In International Symposium on Graph Drawing . Springer, Springer, 483–484. https://doi.org/10.1007/3-540-45848-4_57
2001 doi
-
[26]
David Eppstein. 2014. Drawing Arrangement Graphs In Small Grids, Or How To Play Planarity. J. Graph Algorithms Appl. 18, 2 (2014), 211–231. https://doi.org/10.7155/jgaa.00319
2014 doi
-
[27]
John Ferrara. 2013. Games for persuasion: Argumentation, procedurality, and the lie of gamification. Games and Culture 8, 4 (2013), 289–304
2013
-
[28]
Franz, C
M. Franz, C. T. Lopes, G. Huck, Y. Dong, O. Sumer, and G. D. Bader. 2016. Cytoscape.js: a graph theory library for visualisation and analysis. Bioinformatics 32, 2 (Jan 2016), 309–311
2016
-
[29]
Thomas MJ Fruchterman and Edward M Reingold. 1991. Graph drawing by force-directed placement.Software: Practice and experience 21, 11 (1991), 1129–1164
1991
-
[30]
Gansner and Yehuda Koren
Emden R. Gansner and Yehuda Koren. 2006. Improved Circular Layouts. InGraph Drawing, 14th International Symposium, GD 2006, Karlsruhe, Germany, September 18-20, 2006. Revised Papers (Lecture Notes in Computer Science) , Michael Kaufmann and Dorothea Wagner (Eds.), Vol. 4372. S...
2006 doi
-
[31]
Emden R Gansner, Eleftherios Koutsofios, Stephen C North, and K-P Vo. 1993. A technique for drawing directed graphs. IEEE Transactions on Software Engineering 19, 3 (1993), 214–230
1993
-
[32]
Helen Gibson, Joe Faith, and Paul Vickers. 2013. A survey of two-dimensional graph layout techniques for information visualisation. Information visualization 12, 3-4 (2013), 324–357
2013
-
[33]
Spence Green, Jason Chuang, Jeffrey Heer, and Christopher D. Manning. 2014. Predictive translation memory: a mixed-initiative system for human language translation. InThe 27th Annual ACM Symposium on User Interface Software , Vol. 1, No. 1, Article . Publication date: August 2...
2014
-
[34]
Aric Hagberg, Pieter Swart, and Daniel S Chult. 2008. Exploring network structure, dynamics, and function using NetworkX. Technical Report. Los Alamos National Lab.(LANL), Los Alamos, NM (United States)
2008
-
[35]
Juho Hamari, Jonna Koivisto, and Harri Sarsa. 2014. Does Gamification Work? - A Literature Review of Empirical Studies on Gamification. In 47th Hawaii International Conference on System Sciences, HICSS 2014, Waikoloa, HI, USA, January 6-9, 2014. IEEE Computer Society, 3025–303...
2014 doi
-
[36]
David Harel and Meir Sardas. 1995. An incremental drawing algorithm for planar graphs . Technical Report. Cornell University
1995
-
[37]
Puzzle Bridges
Hashi Puzzle Bridges Game. Puzzle Bridges. https://www.puzzle-bridges.com/
-
[38]
Jeffrey Heer. 2019. Agency plus automation: Designing artificial intelligence into interactive systems. Proceedings of the National Academy of Sciences 116, 6 (2019), 1844–1850
2019
-
[39]
Viégas, and Martin Wattenberg
Jeffrey Heer, Fernanda B. Viégas, and Martin Wattenberg. 2007. Voyagers and voyeurs: supporting asynchronous collaborative information visualization. In Proceedings of the 2007 Conference on Human Factors in Computing Systems, CHI 2007, San Jose, California, USA, April 28 - Ma...
2007
-
[40]
Chien-Ju Ho, Aleksandrs Slivkins, Siddharth Suri, and Jennifer Wortman Vaughan. 2015. Incentivizing High Quality Crowdwork. In Proceedings of the 24th International Conference on World Wide Web, WWW 2015, Florence, Italy, May 18-22, 2015, Aldo Gangemi, Stefano Leonardi, and Al...
2015
-
[41]
Yifan Hu. 2005. Efficient, high-quality force-directed graph drawing. Mathematica Journal 10, 1 (2005), 37–71
2005
-
[42]
Mathieu Jacomy, Tommaso Venturini, Sebastien Heymann, and Mathieu Bastian. 2014. ForceAtlas2, a continuous graph layout algorithm for handy network visualization designed for the Gephi software. PloS one 9, 6 (2014), e98679
2014
-
[43]
Tomihisa Kamada, Satoru Kawai, et al . 1989. An algorithm for drawing general undirected graphs. Information processing letters 31, 1 (1989), 7–15
1989
-
[44]
Hellerstein, and Jeffrey Heer
Sean Kandel, Andreas Paepcke, Joseph M. Hellerstein, and Jeffrey Heer. 2011. Wrangler: interactive visual specification of data transformation scripts. In Proceedings of the International Conference on Human Factors in Computing Systems, CHI 2011, Vancouver, BC, Canada, May 7-...
2011
-
[45]
Keiko Katsuragawa, Qi Shu, and Edward Lank. 2019. PledgeWork: Online Volunteering through Crowdwork. In Proceedings of the 2019 CHI Conference on Human Factors in Computing Systems, CHI 2019, Glasgow, Scotland, UK, May 04-09, 2019 , Stephen A. Brewster, Geraldine Fitzpatrick, ...
2019
-
[46]
Alexander Kawrykow, Gary Roumanis, Alfred Kam, Daniel Kwak, Clarence Leung, Chu Wu, Eleyine Zarour, Luis Sarmenta, Mathieu Blanchette, Jérôme Waldispühl, et al. 2012. Phylo: a citizen science approach for improving multiple sequence alignment. PloS one 7, 3 (2012), e31362
2012
-
[47]
Chilton, Wendy E
Juho Kim, Haoqi Zhang, Paul André, Lydia B. Chilton, Wendy E. Mackay, Michel Beaudouin-Lafon, Robert C. Miller, and Steven P. Dow. 2013. Cobi: a community-informed conference scheduling tool. InThe 26th Annual ACM Symposium on User Interface Software and Technology, UIST’13, S...
2013
-
[48]
Jinseop S Kim, Matthew J Greene, Aleksandar Zlateski, Kisuk Lee, Mark Richardson, Srinivas C Turaga, Michael Purcaro, Matthew Balkam, Amy Robinson, Bardia F Behabadi, et al . 2014. Space–time wiring specificity supports direction selectivity in the retina. Nature 509, 7500 (2014), 331
2014
-
[49]
J. S. Kim, M. J. Greene, A. Zlateski, K. Lee, M. Richardson, S. C. Turaga, M. Purcaro, M. Balkam, A. Robinson, B. F. Behabadi, M. Campos, W. Denk, and H. S. Seung. 2014. Space-time wiring specificity supports direction selectivity in the retina. Nature 509, 7500 (May 2014), 331–336
2014
-
[50]
Yehuda Koren. 2003. On Spectral Graph Drawing. InComputing and Combinatorics, 9th Annual International Conference, COCOON 2003, Big Sky, MT, USA, July 25-28, 2003, Proceedings (Lecture Notes in Computer Science) , Tandy J. Warnow and Binhai Zhu (Eds.), Vol. 2697. Springer, 496...
2003 doi
-
[51]
Yehuda Koren. 2005. Drawing graphs by eigenvectors: theory and practice.Computers & Mathematics with Applications 49, 11-12 (2005), 1867–1888
2005
-
[52]
Oh-Hyun Kwon, Tarik Crnovrsanin, and Kwan-Liu Ma. 2018. What Would a Graph Look Like in This Layout? A Machine Learning Approach to Large Graph Visualization. IEEE transactions on visualization and computer graphics 24, 1 (2018), 478–488
2018
-
[53]
J. Lee, W. Kladwang, M. Lee, D. Cantu, M. Azizyan, H. Kim, A. Limpaecher, S. Yoon, A. Treuille, and R. Das. 2014. RNA design rules from a massive open laboratory. Proc. Natl. Acad. Sci. U.S.A. 111, 6 (Feb 2014), 2122–2127. , Vol. 1, No. 1, Article . Publication date: August 20...
2014
-
[54]
Tianyi Li, Asmita Shah, Kurt Luther, and Chris North. 2018. Crowdsourcing Intelligence Analysis with Context Slices. CHI 2018 Workshop on Sensemaking in a Senseless World (2018)
2018
-
[55]
Georgios A Pavlopoulos, Anna-Lynn Wegener, and Reinhard Schneider. 2008. A survey of visualization tools for biological network analysis. Biodata mining 1, 1 (2008), 12
2008
-
[56]
Helen C Purchase. 2002. Metrics for graph drawing aesthetics. Journal of Visual Languages & Computing 13, 5 (2002), 501–516
2002
-
[57]
Purchase, Matthew McGill, Linda Colpoys, and David A
Helen C. Purchase, Matthew McGill, Linda Colpoys, and David A. Carrington. 2001. Graph Drawing Aesthetics and the Comprehension of UML Class Diagrams: An Empirical Study. In Australasian Symposium on Information Visualisation, InVis.au, Sydney, Australia, 3-4 December 2001 (CR...
2001
-
[58]
Jakob Rogstadius, Vassilis Kostakos, Aniket Kittur, Boris Smus, Jim Laredo, and Maja Vukovic. 2011. An Assessment of Intrinsic and Extrinsic Motivation on Task Performance in Crowdsourcing Markets. In Proceedings of the Fifth International Conference on Weblogs and Social Medi...
2011
-
[59]
Parameswaran, and Jennifer Widom
Akash Das Sarma, Ayush Jain, Arnab Nandi, Aditya G. Parameswaran, and Jennifer Widom. 2015. Surpassing Humans and Computers with JELLYBEAN: Crowd-Vision-Hybrid Counting Algorithms. In Proceedings of the Third AAAI Conference on Human Computation and Crowdsourcing, HCOMP 2015, ...
2015
-
[60]
Karen Schrier. 2018. Designing Learning with Citizen Science and Games. The Emerging Learning Design Journal 4, 1 (2018), 3
2018
-
[61]
Paul Shannon, Andrew Markiel, Owen Ozier, Nitin S Baliga, Jonathan T Wang, Daniel Ramage, Nada Amin, Benno Schwikowski, and Trey Ideker. 2003. Cytoscape: a software environment for integrated models of biomolecular interaction networks. Genome research 13, 11 (2003), 2498–2504
2003
-
[62]
Dow, and Krzysztof Z
Pao Siangliulue, Joel Chan, Steven P. Dow, and Krzysztof Z. Gajos. 2016. IdeaHound: Improving Large-scale Collabora- tive Ideation with Crowd-Powered Real-time Semantic Modeling. In Proceedings of the 29th Annual Symposium on User Interface Software and Technology (UIST ’16) ....
2016
-
[63]
Singh, Lee Lisle, T
Divit P. Singh, Lee Lisle, T. M. Murali, and Kurt Luther. 2018. CrowdLayout: Crowdsourced Design and Evaluation of Biological Network Visualizations. In Proceedings of the 2018 CHI Conference on Human Factors in Computing Systems, CHI 2018, Montreal, QC, Canada, April 21-26, 2...
2018
-
[64]
Michael E Smoot, Keiichiro Ono, Johannes Ruscheinski, Peng-Liang Wang, and Trey Ideker. 2010. Cytoscape 2.8: new features for data integration and network visualization. Bioinformatics 27, 3 (2010), 431–432
2010
-
[65]
Kozo Sugiyama, Shojiro Tagawa, and Mitsuhiko Toda. 1981. Methods for visual understanding of hierarchical system structures. IEEE Transactions on Systems, Man, and Cybernetics 11, 2 (1981), 109–125
1981
-
[66]
Roberto Tamassia. 2013. Handbook of graph drawing and visualization . Chapman and Hall/CRC
2013
-
[67]
Roberto Tamassia, Giuseppe Di Battista, and Carlo Batini. 1988. Automatic graph drawing and readability of diagrams. IEEE Transactions on Systems, Man, and Cybernetics 18, 1 (1988), 61–79
1988
-
[68]
Martyn Taylor and Peter Rodgers. 2005. Applying Graphical Design Techniques to Graph Visualisation. In 9th International Conference on Information Visualisation, IV 2005, 6-8 July 2005, London, UK . IEEE Computer Society, 651–656. https://doi.org/10.1109/IV.2005.19
2005 doi
-
[69]
Shailesh Tripathi, Matthias Dehmer, and Frank Emmert-Streib. 2014. NetBioV: an R package for visualizing large network data in biology and medicine. Bioinformatics 30, 19 (2014), 2834–2836
2014
-
[70]
Show Context, Expand on Demand
Frank van Ham and Adam Perer. 2009. "Show Context, Expand on Demand": Supporting Large Graph Exploration with Degree-of-Interest. IEEE Transactions on Visualization and Computer Graphics 15, 6 (2009), 953–960. https: //doi.org/10.1109/TVCG.2009.108
2009 doi
-
[71]
Frank van Ham and Bernice Rogowitz. 2008. Perceptual organization in user-generated graph layouts.IEEE Transactions on Visualization and Computer Graphics 14, 6 (2008), 1333–1339
2008
-
[72]
Viégas, Martin Wattenberg, Frank van Ham, Jesse Kriss, and Matthew M
Fernanda B. Viégas, Martin Wattenberg, Frank van Ham, Jesse Kriss, and Matthew M. McKeon. 2007. ManyEyes: a Site for Visualization at Internet Scale. IEEE Trans. Vis. Comput. Graph. 13, 6 (2007), 1121–1128. https://doi.org/10.1109/ TVCG.2007.70577
2007
-
[73]
Luis Von Ahn and Laura Dabbish. 2008. Designing games with a purpose. Commun. ACM 51, 8 (2008), 58–67
2008
-
[74]
Luis von Ahn, Ruoran Liu, and Manuel Blum. 2006. Peekaboom: a game for locating objects in images. In Proceedings of the 2006 Conference on Human Factors in Computing Systems, CHI 2006, Montréal, Québec, Canada, April 22-27, 2006 . ACM SIGCHI, 55–64. https://doi.org/10.1145/11...
2006
-
[75]
Michael Williams, Hassen Gharbi, Aybike Ulusan, Özlem Ergun, Xiaofeng Zhu, Shiyu Zhang, and Casper Harteveld
-
[76]
Mackinlay, Bill Howe, and Jeffrey Heer
Kanit Wongsuphasawat, Dominik Moritz, Anushka Anand, Jock D. Mackinlay, Bill Howe, and Jeffrey Heer. 2016. Voyager: Exploratory Analysis via Faceted Browsing of Visualization Recommendations. IEEE Trans. Vis. Comput. Graph. 22, 1 (2016), 649–658. https://doi.org/10.1109/TVCG.2...
2016
-
[77]
Xiaoru Yuan, Limei Che, Yifan Hu, and Xin Zhang. 2012. Intelligent graph layout using many users’ input. IEEE transactions on visualization and computer graphics 18, 12 (2012), 2699–2708
2012
-
[78]
Haoqi Zhang, Edith Law, Rob Miller, Krzysztof Gajos, David Parkes, and Eric Horvitz. 2012. Human computation tasks with global constraints. In Proceedings of the 2012 ACM annual conference on Human Factors in Computing Systems (CHI ’12). ACM, 217–226. https://doi.org/10.1145/2...
2012
-
[2009]
IEEE Trans
A Comparison of User-Generated and Automatic Graph Layouts. IEEE Trans. Vis. Comput. Graph. 15, 6 (2009), 961–968. https://doi.org/10.1109/TVCG.2009.109
2009 doi
-
[2016]
In Proceedings of the 2016 Annual Symposium on Computer-Human Interaction in Play, Companion Extended Abstracts, CHI PLAY 2016, Austin, TX, USA, October 16 - 19, 2016 , Anna L
Toward Human in the Loop Optimization Through Game-Based Experiments. In Proceedings of the 2016 Annual Symposium on Computer-Human Interaction in Play, Companion Extended Abstracts, CHI PLAY 2016, Austin, TX, USA, October 16 - 19, 2016 , Anna L. Cox, Zachary O. Toups, Regan L...
2016 doi
Reviewed August 14, 2026 · model on record in the stance chip above.
Discussion (0). Continue with ORCID to comment.