REVIEW 3 major objections 5 minor 120 references
Mapping Galactic Dust Emission and Extinction with HI, HII, and H$_2$
T0 review · 3 major / 5 minor · reviewed 2026-08-12 · deepseek-v4-flash
Pith's one-line read Additional gas phases leave HI-based dust maps with 20 percent residuals and no single dominant cause.
desk verdict Honest negative-result study of gas-based dust templates; the new temperature-variation limit is intriguing but is the weakest link because it comes from in-sample residuals and a mask that pre-removes high-residual regions. read the letter →
The pith
A machine-rendered reading of the paper's core claim, the machinery that carries it, and where it could break.
The reading
What carries the argument
The load-bearing object is the linear template equation $I_\nu = \sum_i \epsilon_{\nu,i} N_{\mathrm{HI},i} + \epsilon_{\nu,\mathrm{HII}} N_{\mathrm{HII}} + 2\epsilon_{\nu,\mathrm{H}_2} N_{\mathrm{H}_2} + b_\nu$, fitted to the far-infrared maps by weighted least squares. Each HI cloud is assigned a constant emissivity per H atom, while the HII and H2 phases each receive a single emissivity. k-means clustering on normalized angular coordinates, velocity, and HI channel density supplies the HI templates, with attribute weights and cluster number chosen to minimize chi-squared at 857 GHz. The machinery isolates what the gas templates can and cannot explain, turning leftover structure into a map of emissivity variation that the paper then compares against external tracers of dust-to-gas ratio, temperature, polarization, and extragalactic background.
What would settle it
Fit the same multi-phase templates to the far-infrared maps while including the full pixel covariance matrix, including clustering of the cosmic infrared background, instead of diagonal noise; if the large-scale residuals collapse to the noise level, the inferred emissivity variations are an artefact of ignored correlations. Separately, measure dust temperatures along high-latitude sight lines with a method independent of single-temperature modified-blackbody fitting, such as resolved multi-band photometry of background stars, and check whether the spread exceeds 1.28 K; a larger spread would falsify the paper's upper limit under its stated assumptions.
Extended reading notes
Core claim
The paper's central claim is that a linear template model in which each gas phase (HI, HII, H2) has a constant dust emissivity per hydrogen atom, with HI decomposed into a handful of clouds by k-means clustering in position-position-velocity space, still leaves residuals of less than 20 percent of the observed intensity in the 353, 545, and 857 GHz bands. Adding the HII template reduces outlier sight lines but only modestly; the H2 template built from CO is noise-dominated at high latitude and does not help. The clustering finds that a simple velocity cut already captures most of the signal, since three clusters in the north and five in the south mostly share similar emissivities, so the improvement from clustering is also modest. The residuals are coherent across frequencies and align only partially with stellar reddening residuals, dust-to-gas ratio maps, polarization-fraction fluctuations, and CMB lensing. The paper concludes that spatially varying dust emissivity not captured by discrete clouds is real, and that under a constant line-of-sight temperature assumption the implied temperature scatter is at most $\sigma_T < 1.28\,\mathrm{K}$.
Load-bearing premise
The model assumes that each HI cloud has one constant dust emissivity per hydrogen atom across its entire angular extent.
Editorial extensions
If this is right
- Gas-based extinction and emission templates can be pushed only modestly by adding HII and clustering; users should expect roughly 10 to 20 percent large-scale residuals from any such template in the diffuse high-latitude regime.
- Current CO-based H2 templates are not sensitive enough to improve high-latitude dust fits; higher-sensitivity CO mapping is needed before molecular gas can be incorporated into gas-based extinction maps.
- If the constant-line-of-sight-temperature assumption holds, high-latitude dust temperature variations are below 1.28 K, implying that earlier temperature maps with roughly 1.5 to 2.5 K variation are dominated by systematics or parameter degeneracy.
- No single mechanism explains the residual pattern, so future improvements require joint multi-tracer analyses of gas, stellar extinction, polarization, and three-dimensional distance information rather than another single tracer.
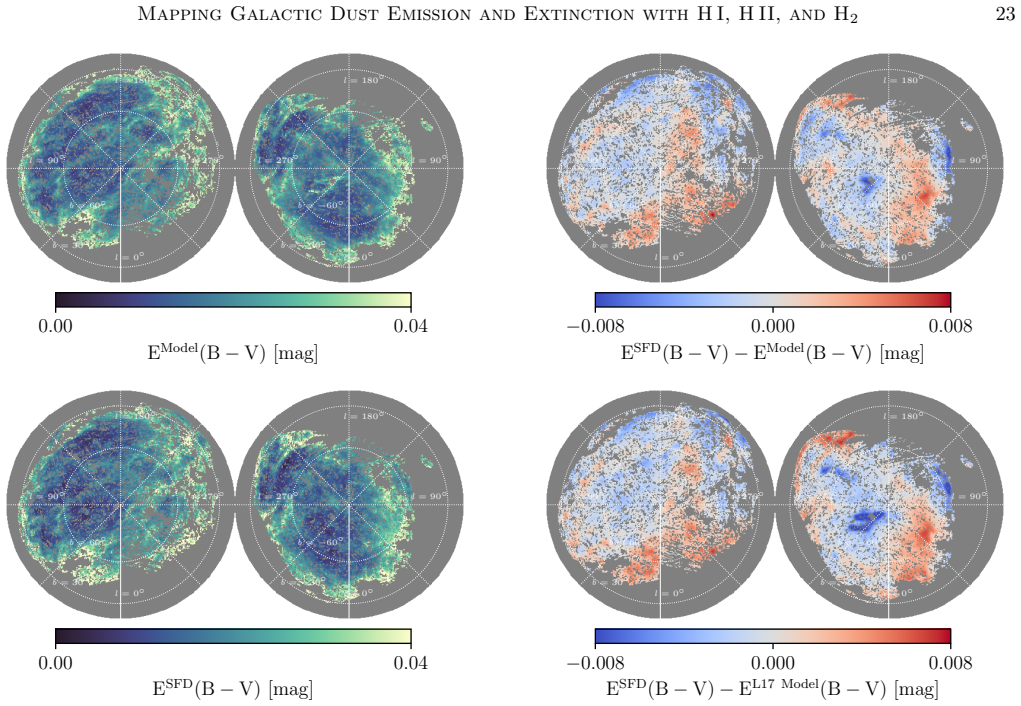
- The released reddening map, built from multi-phase templates fitted to the SFD map, provides an independent extinction template with residual scatter of order 3 to 3.5 millimag against stellar reddening.
Reading between the lines
- If the constant-emissivity-per-cloud assumption is the real bottleneck, then three-dimensional extinction maps that place dust along the line of sight could break the degeneracy and produce the larger improvement that additional gas phases did not.
- The tight 1.28 K bound should be read as much as a statement about model misspecification as about temperature; an independent temperature tracer, such as near-infrared colors of many background stars, could settle which interpretation is correct.
- The pattern of residuals points to dust-to-gas ratio variations that are real but spatially patchy, especially toward known low-metallicity gas like the Magellanic Stream, so targeted studies of those regions could quantify the effect.
- A natural next test is to fit the same template set to future high-latitude CO surveys or to CIB-subtracted versions of the SFD map; if residuals shrink, the missing piece is gas phase rather than dust physics.
Signed reviews
Editorial analysis
A structured set of objections, weighed in public.
Referee Report
Summary. This paper constructs high-latitude Galactic dust emission and reddening templates from HI4PI velocity-resolved HI, an all-sky dispersion-measure-based HII map, and a CO-based H2 map. The HI is decomposed with a k-means algorithm in position-position-velocity space, and the resulting gas templates are linearly fitted to Planck 353/545/857 GHz data and to the SFD reddening map. The authors find that adding HII improves the fit only modestly, that the H2 template has negligible impact, that the clustering-based HI decomposition yields only modest improvements over simple velocity cuts, and that large-scale residuals at the tens-of-degrees scale remain at roughly the 20% level. They investigate dust-to-gas ratio, temperature, opacity, magnetic-field orientation, and CIB contamination as explanations, concluding that no single mechanism dominates. They also derive a bound on dust temperature variation of sigma_T < 1.28 K under the assumption of a constant line-of-sight temperature, and release the resulting reddening map and templates.
Significance. If the conclusions hold, the paper is a useful contribution: it provides a public gas-based reddening map, systematically quantifies the limited gains from multi-phase tracers and data-driven HI decomposition, and documents a series of honest negative results that are relevant for the many cosmological analyses that rely on Galactic extinction corrections. The external checks against DESI stellar reddening and CMB lensing cross-correlations are valuable and partially mitigate concerns about in-sample fitting. However, the headline upper limit on dust temperature variation is not secured by the analysis as presented, because the clustering hyperparameters are selected on the same 857 GHz residuals that define sigma_T and because the adopted mask removes pixels with large residuals before the fit.
major comments (3)
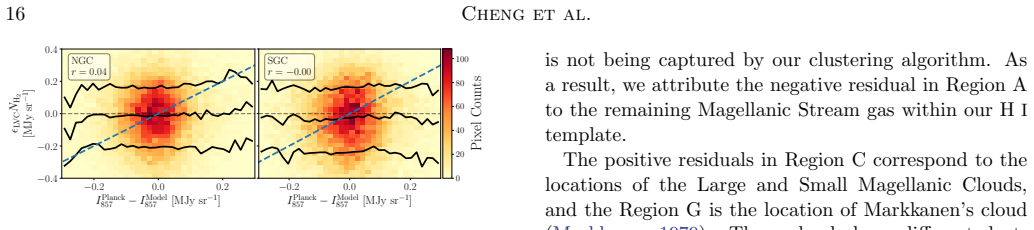
- [Sections 5.2, 7.4, and 2.5] The sigma_T < 1.28 K limit is computed from the residuals of a model whose hyperparameters were selected in-sample on the same Planck 857 GHz map. In Section 5.2 and Figure 4, the number of clusters k and the attribute weights (w_v, w_rho) are chosen by minimizing the chi^2 against Planck 857 GHz, and in Section 7.4 these same 857 GHz residuals are converted into a temperature map via Equation (14). Any overfitting or noise exploitation in the hyperparameter search will shrink the residual variance and hence bias sigma_T downward, which is the opposite of what an 'upper limit' should do. In addition, the mask described in Section 2.5 inherits from Lenz et al. (2019) a criterion that removes pixels with residual emission found in earlier HI fits, pre-cleaning the largest outliers before the model is even built. The manuscript acknowledges both choices, but neither is revisited when the temperature limit is presented in the abstract. To support the headline claim, the authors should repeat the analysis with cross-validation or an independent calibration region, and quantify how sigma_T changes when the residual-masking criterion is relaxed.
- [Section 7.4, Equations (13)-(14)] Equation (14) is presented as an upper limit on dust temperature variation, but it is only a rescaling of the model residual map under a strong null hypothesis that all residuals are caused by temperature fluctuations with no variations in dust-to-gas ratio, opacity, unaccounted gas, CIB, or magnetic-field orientation. The paper itself finds evidence for several of these other contributions (Sections 7.2, 7.3, 7.6, 7.7), so the derived sigma_T is not an upper bound on the physical temperature dispersion of the interstellar dust; it is an upper bound on the temperature variation that would be inferred if the model were exact in every other respect. The abstract's statement that this limit is 'lower than the temperature variation reported in previous studies' therefore overstates the robustness of the result. The text should either explicitly frame sigma_T as a residual-based statistic under a stated model, or propagate the contributions of the other mechanisms to obtain a genuinely conservative bound.
- [Section 7.4] The line-of-sight constant-temperature assumption is stated, but its consequences for the claimed upper limit deserve more emphasis. If a sight line contains multiple dust components at different temperatures, the same observed intensity can be produced with a larger temperature dispersion than Equation (14) would infer. The paper notes this in passing, but the abstract and conclusions present sigma_T < 1.28 K without this caveat. At minimum, the authors should state explicitly that the limit applies only to single-temperature lines of sight and does not constrain multi-component temperature structure.
minor comments (5)
- [Section 2.3] The units of X_CO are written as 'cm−2 K−1 km−1 s', which appears to be missing a division by (km/s); the standard unit is cm^-2 (K km s^-1)^-1.
- [Table 1] The SGC HII emissivity at 545 GHz is listed as 0.0137 MJy sr^-1 (10^20 cm^-2)^-1, which is inconsistent with the 353 and 857 GHz values in the same row (0.040 and 0.374); this is likely a typographical error and should be checked against the actual fit output.
- [Section 8.2] The coefficients reported for the SGC are labeled with 'IVC−' and 'LVC', but the fiducial SGC templates defined in Sections 5.3 and 6 are 'LVC−' and 'LVC+'; the labels in the release description should be corrected.
- [Section 7.2] There is a duplicated word in the sentence 'it is difficult to explain the entirety of our fitting residuals residuals by dust-to-gas ratio variations'; the repetition should be removed.
- [Figure 12] The top panel is labeled 'T Model [K]', but the map is not a measured temperature map; it is a temperature inferred under the assumption that all residuals are thermal. The caption should make this construction clear in the figure label as well as in the text.
Circularity Check
The σ_T<1.28 K bound is an in-sample rescaling of the minimized residual map; the main null result on residual origins remains independently grounded.
-
fitted input called prediction
[Section 5.2 (cluster selection) and Section 7.4, Eq. (14)]
"In each region, we iterate through different numbers of clusters (k). For each k, we search for the optimal weighting that minimizes the χ2 error between the Planck 857 GHz map, I d ν , and the model (Equation (8)). ... Assuming a mean temperature of T = 20 K, and using the Planck map and our model at 857 GHz, we derived the implied temperature map, shown in the top panel of Figure 12. Our derived temperature variation map has a standard deviation of σT = 1.02 K. If we consider a conservative upper limit of T < 25 K, we get σT < 1.28 K."
The 857 GHz residual map is defined as I^d − I^m, with I^m the weighted least-squares fit to I^d (Eqs. 8–9). Equation (14) then converts that same residual map, pixel by pixel, into a temperature map under the MBB assumption; σ_T is the standard deviation of this rescaled residual. The clustering hyperparameters (k, w_v, w_rho) were themselves optimized by minimizing the χ² against this same I^d (Section 5.2), so the residual variance entering Eq. (14) is minimized in-sample. Thus σ_T < 1.28 K is not an independent bound on dust temperature variation; it is the in-sample residual scatter of the tuned model, relabeled as a temperature fluctuation. Mask pre-cleaning that removes high-residual regions can only reinforce this downward bias.
-
self citation load bearing
[Section 2.5 (Masks)]
"We adopt the masks from Lenz et al. (2019) that incorporate a threshold NHI = 4 × 1020 cm−2, a 40% Galactic plane mask from Planck, and pixels that contain extragalactic point sources from Planck Collaboration XXVI (2016). However, this mask also removes sight lines with molecular intermediate-velocity clouds and CO-dark molecular gas from a census of these objects (Röhser et al. 2016), as well as regions with residual emission identified in their process of fitting Planck maps to H I."
The mask used for all fits, including the one feeding Eq. (14), is taken from Lenz et al. (2019), a paper sharing author Doré with the present work. That mask was constructed by removing pixels with residual emission from an earlier fit of Planck maps to H I, i.e., it deletes exactly the kind of outliers whose variance Eq. (14) would otherwise convert into inferred temperature variation. Because σ_T is computed from the masked residual map, the headline upper limit inherits a self-citation-based pre-cleaning step. The paper asserts these regions are small and compact but does not quantify their effect on σ_T, so the advertised conservative upper limit is not secured by the presented analysis.
full rationale
The central template-building analysis is not circular: it fits a linear model of HI/HII templates to Planck maps, tests against external DESI reddening and CMB lensing, and finds that no single physical mechanism explains the residuals. Those conclusions have independent content. However, the headline σ_T<1.28 K upper limit (Section 7.4) does reduce by construction to the in-sample residual scatter of the fiducial model: Eq. (14) is a pointwise rescaling of I^d−I^m, and both the linear coefficients and the clustering hyperparameters were chosen by minimizing χ² against the same 857 GHz map (Section 5.2). Any overfitting or mask pre-cleaning shrinks the residual variance and hence lowers σ_T, opposite to the conservatism implied by calling it an upper limit. Additionally, the adopted mask comes from Lenz et al. (2019), a prior work sharing author Doré, and explicitly removes regions with residual emission from an H I-to-Planck fit, the same quantity feeding Eq. (14). These two effects make the quoted bound partially circular, while the broader null result about residual origins remains externally grounded.
Assumptions & free parameters
free parameters (7)
- Dust emissivities per template per band epsilon_nu,i =
NGC: IVC- 0.026/0.089/0.254; LVC 0.038/0.134/0.392; HII 0.018/0.052/0.167; SGC: LVC- 0.025/0.097/0.306; LVC+…
- Offsets b_nu per band per region =
Not tabulated in the text (reported as fitted)
- Number of HI clusters k =
3 (NGC), 5 (SGC)
- Clustering attribute weights w_v, w_rho =
w_v = 3.56, w_rho = 0.022
- Assumed mean dust temperature for residual-to-temperature mapping =
20 K (and 25 K for upper limit)
- Dust spectral index beta =
1.5 (assumed)
- CO-to-H2 conversion factor X_CO =
2 x 10^20 cm^-2 (K km/s)^-1
assumptions (5)
- domain assumption HI emission is optically thin (NHI conversion 1.82e18 cm^-2 per K km/s)
- domain assumption Constant emissivity per identified cloud and per gas phase
- domain assumption Modified blackbody emission with fixed beta=1.5 and a single dust temperature per line of sight
- domain assumption Dispersion measure map of Hutschenreuter et al. (2024) traces HII column density
- ad hoc to paper Mask from Lenz et al. (2019) is appropriate and does not bias the residual analysis
Cite this review
Pith. "Pith review of Mapping Galactic Dust Emission and Extinction with HI, HII, and H$_2$." pith.science (2026). https://pith.science/paper/UKBST22S
@misc{pith2026241112801,
  author       = {Pith},
  title        = {Pith review of: Mapping Galactic Dust Emission and Extinction with HI, HII, and H$_2$},
  year         = {2026},
  howpublished = {\url{https://pith.science/paper/UKBST22S}},
  note         = {Machine review of arXiv:2411.12801}
}
abstract
Neutral hydrogen (HI) emission closely traces the dust column density at high Galactic latitudes and is thus a powerful tool for predicting dust extinction. However, the relation between HI column density $N_{\rm HI}$ and high-latitude dust emission observed by Planck has large-scale residuals at the level of $\lesssim 20\%$ on tens of degree scales. In this work, we improve HI-based dust templates in the north/south Galactic poles covering a sky fraction of $f_{\rm sky}=13.5\%/11.0\%$ (5577/4555\,deg$^2$) by incorporating data from ionized (HII) and molecular (H$_2$) gas phases. We make further improvements by employing a clustering analysis on the HI spectral data to identify discrete clouds with distinct dust properties. However, only a modest reduction in fitting residuals is achieved. We quantify the contributions to these residuals from variations in the dust-to-gas ratio, dust temperature and opacity, and magnetic field orientation using ancillary datasets. Although residuals in a few particular regions can be attributed to these factors, no single explanation accounts for the majority. Assuming a constant dust temperature along each line of sight, we derive an upper limit on the high-latitude dust temperature variation of $\sigma_T<1.28$K, lower than the temperature variation reported in previous studies. Joint analysis of multiple existing and upcoming datasets that trace Galactic gas and dust properties is needed to clarify the origins of the variation of gas and dust properties found here and to significantly improve gas-based extinction maps.
Figures


Figures from the paper (15 more)






Reference graph
Works this paper leans on
-
[1]
, " * write output.state after.block = add.period write newline
ENTRY address archivePrefix author booktitle chapter doi edition editor eprint howpublished institution journal key month number organization pages publisher school series title misctitle type volume year version url label extra.label sort.label short.list INTEGERS output.state before.all mid.sentence after.sentence after.block FUNCTION init.state.consts ...
-
[2]
write newline
" write newline "" before.all 'output.state := FUNCTION format.url url empty "" new.block "" url * "" * if FUNCTION format.eprint eprint empty "" archivePrefix empty "" archivePrefix "arXiv" = new.block " " eprint * " " * new.block " " eprint * " " * if if if FUNCTION format.doi doi empty "" " " doi * " " * if FUNCTION format.pid doi empty eprint empty ur...
-
[3]
thebibliography [1] 20pt to REFERENCES 6pt =0pt -12pt 10pt plus 3pt =0pt =0pt =1pt plus 1pt =0pt =0pt -12pt =13pt plus 1pt =20pt =13pt plus 1pt \@M =10000 =-1.0em =0pt =0pt 0pt =0pt =1.0em @enumiv\@empty 10000 10000 `\.\@m \@noitemerr \@latex@warning Empty `thebibliography' environment \@ifnextchar \@reference \@latexerr Missing key on reference command E...
arXiv 2021
-
[4]
2024, , 531, 4876, 10.1093/mnras/stae1365
Adak , D., Shaikh , S., Sinha , S., et al. 2024, , 531, 4876, 10.1093/mnras/stae1365
-
[5]
Ade , P. A. R., Ahmed , Z., Amiri , M., et al. 2023, , 945, 72, 10.3847/1538-4357/acb64c
-
[6]
2019, , 484, 4127, 10.1093/mnras/stz093
Alonso , D., Sanchez , J., Slosar , A., & LSST Dark Energy Science Collaboration . 2019, , 484, 4127, 10.1093/mnras/stz093
-
[7]
An , D., Beers , T. C., & Chiti , A. 2024, , 272, 20, 10.3847/1538-4365/ad3641
-
[8]
Astropy Collaboration , Robitaille , T. P., Tollerud , E. J., et al. 2013, , 558, A33, 10.1051/0004-6361/201322068
Show all 120 references
-
[9]
M., Sip o cz , B
Astropy Collaboration , Price-Whelan , A. M., Sip o cz , B. M., et al. 2018, , 156, 123, 10.3847/1538-3881/aabc4f
2018 doi
-
[10]
M., Lim , P
Astropy Collaboration , Price-Whelan , A. M., Lim , P. L., et al. 2022, , 935, 167, 10.3847/1538-4357/ac7c74
2022 doi
-
[11]
2024, , 681, A1, 10.1051/0004-6361/202346814
Auclair , C., Allys , E., Boulanger , F., et al. 2024, , 681, A1, 10.1051/0004-6361/202346814
2024 doi
-
[12]
S., Ghosh, J., & Sra, S
Banerjee, A., Dhillon, I. S., Ghosh, J., & Sra, S. 2005, Journal of Machine Learning Research, 6, 1345. http://jmlr.org/papers/v6/banerjee05a.html
2005
-
[13]
2013, , 557, A66, 10.1051/0004-6361/201321688
B \'e thermin , M., Wang , L., Dor \'e , O., et al. 2013, , 557, A66, 10.1051/0004-6361/201321688
2013 doi
-
[14]
W., Mather , J
Boggess , N. W., Mather , J. C., Weiss , R., et al. 1992, , 397, 420, 10.1086/171797
1992 doi
-
[15]
C., Savage , B
Bohlin , R. C., Savage , B. D., & Drake , J. F. 1978, , 224, 132, 10.1086/156357
1978 doi
-
[16]
D., Wolfire , M., & Leroy , A
Bolatto , A. D., Wolfire , M., & Leroy , A. K. 2013, , 51, 207, 10.1146/annurev-astro-082812-140944
2013 doi
-
[17]
P., et al
Boulanger , F., Abergel , A., Bernard , J. P., et al. 1996, , 312, 256
1996
-
[18]
Bregman , J. N. 1980, , 236, 577, 10.1086/157776
1980 doi
-
[19]
2022, , 940, 116, 10.3847/1538-4357/ac9731
Casandjian , J.-M., Ballet , J., Grenier , I., & Remy , Q. 2022, , 940, 116, 10.3847/1538-4357/ac9731
2022 doi
-
[20]
2022, , 2022, 041, 10.1088/1475-7516/2022/07/041
Chen , S.-F., White , M., DeRose , J., & Kokron , N. 2022, , 2022, 041, 10.1088/1475-7516/2022/07/041
2022 doi
-
[21]
2023, , 958, 118, 10.3847/1538-4357/acf4a1
Chiang , Y.-K. 2023, , 958, 118, 10.3847/1538-4357/acf4a1
2023 doi
-
[22]
2019, , 870, 120, 10.3847/1538-4357/aaf4f6
Chiang , Y.-K., & M \'e nard , B. 2019, , 870, 120, 10.3847/1538-4357/aaf4f6
2019 doi
-
[23]
Clark , S. E. 2018, , 857, L10, 10.3847/2041-8213/aabb54
2018 doi
-
[24]
E., & Hensley , B
Clark , S. E., & Hensley , B. S. 2019, , 887, 136, 10.3847/1538-4357/ab5803
2019 doi
-
[25]
E., Hill , J
Clark , S. E., Hill , J. C., Peek , J. E. G., Putman , M. E., & Babler , B. L. 2015, , 115, 241302, 10.1103/PhysRevLett.115.241302
2015 doi
-
[26]
E., Peek , J
Clark , S. E., Peek , J. E. G., & Putman , M. E. 2014, , 789, 82, 10.1088/0004-637X/789/1/82
2014 doi
-
[27]
J., Clark , S
Cukierman , A. J., Clark , S. E., & Halal , G. 2023, , 946, 106, 10.3847/1538-4357/acb0c4
2023 doi
-
[28]
E., Bailer-Jones , C
Dharmawardena , T. E., Bailer-Jones , C. A. L., Fouesneau , M., et al. 2024, , 532, 3480, 10.1093/mnras/stae1474
2024 doi
-
[29]
2014, ArXiv e-prints
Dor \'e , O., Bock , J., Ashby , M., et al. 2014, ArXiv e-prints. 1412.4872
2014 arXiv
-
[30]
T., & Hensley , B
Draine , B. T., & Hensley , B. S. 2021, , 909, 94, 10.3847/1538-4357/abd6c6
2021 doi
-
[31]
2024, , 685, A82, 10.1051/0004-6361/202347628
Edenhofer , G., Zucker , C., Frank , P., et al. 2024, , 685, A82, 10.1051/0004-6361/202347628
2024 doi
-
[32]
2024, , 688, A54, 10.1051/0004-6361/202348932
Ghosh , S., Remazeilles , M., & Delabrouille , J. 2024, , 688, A54, 10.1051/0004-6361/202348932
2024 doi
-
[33]
Gillmon , K., & Shull , J. M. 2006, , 636, 908, 10.1086/498055
2006 doi
-
[34]
M., Danforth , C., & Tumlinson , J
Gillmon , K., Shull , J. M., Danforth , C., & Tumlinson , J. 2006, in Astronomical Society of the Pacific Conference Series, Vol. 348, Astrophysics in the Far Ultraviolet: Five Years of Discovery with FUSE, ed. G. Sonneborn , H. W. Moos , & B. G. Andersson , 439
2006
-
[35]
M., Hivon , E., Banday , A
G \'o rski , K. M., Hivon , E., Banday , A. J., et al. 2005, , 622, 759, 10.1086/427976
2005 doi
-
[36]
Green , G. M. 2018, The Journal of Open Source Software, 3, 695, 10.21105/joss.00695
2018 doi
-
[37]
M., Schlafly , E., Zucker , C., Speagle , J
Green , G. M., Schlafly , E., Zucker , C., Speagle , J. S., & Finkbeiner , D. 2019, , 887, 93, 10.3847/1538-4357/ab5362
2019 doi
-
[38]
E., Cukierman , A., Beck , D., & Kuo , C.-L
Halal , G., Clark , S. E., Cukierman , A., Beck , D., & Kuo , C.-L. 2024, , 961, 29, 10.3847/1538-4357/ad06aa
2024 doi
-
[39]
T., & Koo , B.-C
Heiles , C., Reach , W. T., & Koo , B.-C. 1988, , 332, 313, 10.1086/166657
1988 doi
-
[40]
S., Murray , C
Hensley , B. S., Murray , C. E., & Dodici , M. 2022, , 929, 23, 10.3847/1538-4357/ac5cbd
2022 doi
-
[41]
S., Zhang , C., & Bock , J
Hensley , B. S., Zhang , C., & Bock , J. J. 2019, , 887, 159, 10.3847/1538-4357/ab5183
2019 doi
-
[42]
2016, , 594, A116, 10.1051/0004-6361/201629178
HI4PI Collaboration , Ben Bekhti , N., Fl \"o er , L., et al. 2016, , 594, A116, 10.1051/0004-6361/201629178
2016 doi
-
[43]
E., & Fang , W
Huterer , D., Cunha , C. E., & Fang , W. 2013, , 432, 2945, 10.1093/mnras/stt653
2013 doi
-
[44]
C., & En lin , T
Hutschenreuter , S., Haverkorn , M., Frank , P., Raycheva , N. C., & En lin , T. A. 2024, , 690, A314, 10.1051/0004-6361/202346740
2024 doi
-
[45]
Kalberla , P. M. W., Burton , W. B., Hartmann , D., et al. 2005, , 440, 775, 10.1051/0004-6361:20041864
2005 doi
-
[46]
Kalberla , P. M. W., & Haud , U. 2015, , 578, A78, 10.1051/0004-6361/201525859
2015 doi
-
[47]
Kalberla , P. M. W., Kerp , J., & Haud , U. 2020, , 639, A26, 10.1051/0004-6361/202037602
2020 doi
-
[48]
Kalberla , P. M. W., McClure-Griffiths , N. M., Pisano , D. J., et al. 2010, , 521, A17, 10.1051/0004-6361/200913979
2010 doi
- [49]
-
[50]
Kerp , J., Winkel , B., Ben Bekhti , N., Fl \"o er , L., & Kalberla , P. M. W. 2011, Astronomische Nachrichten, 332, 637, 10.1002/asna.201011548
2011 doi
-
[51]
A., Clark , S
Kim , D. A., Clark , S. E., Putman , M. E., & Li , L. 2023, , 10.1093/mnras/stad2792
2023 doi
-
[52]
2020, , 496, 2262, 10.1093/mnras/staa1621
Kitanidis , E., White , M., Feng , Y., et al. 2020, , 496, 2262, 10.1093/mnras/staa1621
2020 doi
-
[53]
1995, , 52, 4307, 10.1103/PhysRevD.52.4307
Knox , L. 1995, , 52, 4307, 10.1103/PhysRevD.52.4307
1995 doi
- [54]
- [55]
- [56]
-
[57]
Lei , M., & Clark , S. E. 2024, , 972, 66, 10.3847/1538-4357/ad5ade
2024 doi
-
[58]
2019, , 883, 75, 10.3847/1538-4357/ab3c2b
Lenz , D., Dor \'e , O., & Lagache , G. 2019, , 883, 75, 10.3847/1538-4357/ab3c2b
2019 doi
-
[59]
S., & Dor \'e , O
Lenz , D., Hensley , B. S., & Dor \'e , O. 2017, , 846, 38, 10.3847/1538-4357/aa84af
2017 doi
-
[60]
Li , A., & Draine , B. T. 2001, , 554, 778, 10.1086/323147
2001 doi
-
[61]
1982, IEEE Transactions on Information Theory, 28, 129, 10.1109/TIT.1982.1056489
Lloyd, S. 1982, IEEE Transactions on Information Theory, 28, 129, 10.1109/TIT.1982.1056489
1982
-
[62]
Magnani, L., & Shore, S. N. 2017, Surveys for High-Latitude Molecular Clouds (Berlin, Heidelberg: Springer Berlin Heidelberg), 227--248, 10.1007/978-3-662-54350-4_9
2017 doi
-
[63]
1979, , 74, 201
Markkanen , T. 1979, , 74, 201
1979
-
[64]
M., Dickey , J
McClure-Griffiths , N. M., Dickey , J. M., Gaensler , B. M., Green , A. J., & Haverkorn , M. 2006, , 652, 1339, 10.1086/508706
2006 doi
-
[65]
M., Pisano , D
McClure-Griffiths , N. M., Pisano , D. J., Calabretta , M. R., et al. 2009, , 181, 398, 10.1088/0067-0049/181/2/398
2009 doi
-
[66]
2005, , 157, 302, 10.1086/427938
Miville-Desch \^e nes , M.-A., & Lagache , G. 2005, , 157, 302, 10.1086/427938
2005 doi
-
[67]
Miville-Desch \^e nes , M.-A., Murray , N., & Lee , E. J. 2017, , 834, 57, 10.3847/1538-4357/834/1/57
2017 doi
-
[68]
F., & Finkbeiner , D
Mudur , N., Park , C. F., & Finkbeiner , D. P. 2023, , 949, 47, 10.3847/1538-4357/acc32c
2023 doi
-
[69]
E., Peek , J
Murray , C. E., Peek , J. E. G., & Kim , C.-G. 2020, , 899, 15, 10.3847/1538-4357/aba19b
2020 doi
-
[70]
J., van Duinen , R., et al
Neugebauer , G., Habing , H. J., van Duinen , R., et al. 1984, , 278, L1, 10.1086/184209
1984 doi
-
[71]
L., Majewski , S
Nidever , D. L., Majewski , S. R., Butler Burton , W., & Nigra , L. 2010, , 723, 1618, 10.1088/0004-637X/723/2/1618
2010 doi
-
[72]
J., Zucker , C., Goodman , A
O'Neill , T. J., Zucker , C., Goodman , A. A., & Edenhofer , G. 2024, , 973, 136, 10.3847/1538-4357/ad61de
2024 doi
- [73]
- [74]
-
[75]
Peek , J. E. G., & Graves , G. J. 2010, , 719, 415, 10.1088/0004-637X/719/1/415
2010 doi
-
[76]
E., Hensley , B
Pelgrims , V., Clark , S. E., Hensley , B. S., et al. 2021, , 647, A16, 10.1051/0004-6361/202040218
2021 doi
-
[78]
2011, , 536, A19, 10.1051/0004-6361/201116479
Planck Collaboration 2011S Planck Collaboration XIX . 2011, , 536, A19, 10.1051/0004-6361/201116479
2011 doi
-
[79]
2011, , 536, A24, 10.1051/0004-6361/201116485
Planck Collaboration 2011X Planck Collaboration XXIV . 2011, , 536, A24, 10.1051/0004-6361/201116485
2011 doi
-
[80]
2014, , 571, A8, 10.1051/0004-6361/201321538
Planck Collaboration 2014H Planck Collaboration VIII . 2014, , 571, A8, 10.1051/0004-6361/201321538
2014 doi
-
[81]
2014, , 571, A11, 10.1051/0004-6361/201323195
Planck Collaboration 2014K Planck Collaboration XI . 2014, , 571, A11, 10.1051/0004-6361/201323195
2014 doi
-
[82]
2014, , 571, A13, 10.1051/0004-6361/201321553
Planck Collaboration 2014M Planck Collaboration XIII . 2014, , 571, A13, 10.1051/0004-6361/201321553
2014 doi
-
[83]
2014, , 571, A18, 10.1051/0004-6361/201321540
Planck Collaboration 2014R Planck Collaboration XVIII . 2014, , 571, A18, 10.1051/0004-6361/201321540
2014 doi
-
[84]
2016, , 594, A10, 10.1051/0004-6361/201525967
Planck Collaboration 2015J Planck Collaboration X . 2016, , 594, A10, 10.1051/0004-6361/201525967
2016 doi
-
[85]
2016, , 594, A26, 10.1051/0004-6361/201526914
Planck Collaboration 2015ZA Planck Collaboration XXVI . 2016, , 594, A26, 10.1051/0004-6361/201526914
2016 doi
-
[86]
2020, , 641, A3, 10.1051/0004-6361/201832909
Planck Collaboration 2018C Planck Collaboration III . 2020, , 641, A3, 10.1051/0004-6361/201832909
2020 doi
-
[87]
2020, , 641, A8, 10.1051/0004-6361/201833886
Planck Collaboration 2018H Planck Collaboration VIII . 2020, , 641, A8, 10.1051/0004-6361/201833886
2020 doi
-
[88]
2020, , 641, A11, 10.1051/0004-6361/201832618
Planck Collaboration 2018K Planck Collaboration XI . 2020, , 641, A11, 10.1051/0004-6361/201832618
2020 doi
-
[89]
2020, , 641, A12, 10.1051/0004-6361/201833885
Planck Collaboration 2018L Planck Collaboration XII . 2020, , 641, A12, 10.1051/0004-6361/201833885
2020 doi
-
[90]
Planck Collaboration IntQ Planck Collaboration Int. XVII . 2014, , 566, A55, 10.1051/0004-6361/201323270
2014 doi
-
[91]
Planck Collaboration IntS Planck Collaboration Int. XIX . 2015, , 576, A104, 10.1051/0004-6361/201424082
2015 doi
-
[92]
Planck Collaboration IntZW Planck Collaboration Int. XLVIII . 2016, , 596, A109, 10.1051/0004-6361/201629022
2016 doi
-
[93]
Planck Collaboration IntZZG Planck Collaboration Int. LVII . 2020, , 643, 42, 10.1051/0004-6361/202038073
2020 doi
-
[94]
2016, , 596, A94, 10.1051/0004-6361/201629141
R \"o hser , T., Kerp , J., Lenz , D., & Winkel , B. 2016, , 596, A94, 10.1051/0004-6361/201629141
2016 doi
-
[95]
J., Percival , W
Ross , A. J., Percival , W. J., S \'a nchez , A. G., et al. 2012, , 424, 564, 10.1111/j.1365-2966.2012.21235.x
2012
-
[96]
K., Uzsoy , A
Saydjari , A. K., Uzsoy , A. S. M., Zucker , C., Peek , J. E. G., & Finkbeiner , D. P. 2023, , 954, 141, 10.3847/1538-4357/acd454
2023 doi
-
[97]
F., & Finkbeiner , D
Schlafly , E. F., & Finkbeiner , D. P. 2011, , 737, 103, 10.1088/0004-637X/737/2/103
2011 doi
-
[98]
F., Finkbeiner , D
Schlafly , E. F., Finkbeiner , D. P., Schlegel , D. J., et al. 2010, , 725, 1175, 10.1088/0004-637X/725/1/1175
2010 doi
-
[99]
F., Green , G., Finkbeiner , D
Schlafly , E. F., Green , G., Finkbeiner , D. P., et al. 2014, , 789, 15, 10.1088/0004-637X/789/1/15
2014 doi
-
[100]
J., Finkbeiner , D
Schlegel , D. J., Finkbeiner , D. P., & Davis , M. 1998, , 500, 525, 10.1086/305772
1998 doi
-
[101]
Shetty , R., Kauffmann , J., Schnee , S., & Goodman , A. A. 2009, , 696, 676, 10.1088/0004-637X/696/1/676
2009 doi
-
[102]
J., Filippini , J
Shiu , C., Benton , S. J., Filippini , J. P., et al. 2024, , 970, 43, 10.3847/1538-4357/ad46f6
2024 doi
-
[103]
M., & Panopoulou , G
Shull , J. M., & Panopoulou , G. V. 2024, , 961, 204, 10.3847/1538-4357/ad0f20
2024 doi
-
[104]
F., Hopkins , P
Skalidis , R., Goldsmith , P. F., Hopkins , P. F., & Ponnada , S. B. 2024, , 682, A161, 10.1051/0004-6361/202347968
2024 doi
-
[105]
2019, , 631, L11, 10.1051/0004-6361/201936547
Skalidis , R., & Pelgrims , V. 2019, , 631, L11, 10.1051/0004-6361/201936547
2019 doi
-
[106]
A., et al
S \"o ding , L., Edenhofer , G., En lin , T. A., et al. 2024, arXiv e-prints, arXiv:2407.02859, 10.48550/arXiv.2407.02859
2024 doi
-
[107]
D., Beuther , H., Syed , J., et al
Soler , J. D., Beuther , H., Syed , J., et al. 2020, , 642, A163, 10.1051/0004-6361/202038882
2020 doi
- [108]
-
[109]
2022, , 260, 17, 10.3847/1538-4365/ac642f
Sun , Y., Yuan , H., & Chen , B. 2022, , 260, 17, 10.3847/1538-4365/ac642f
2022 doi
-
[110]
L., Lallement , R., & Cox , N
Vergely , J. L., Lallement , R., & Cox , N. L. J. 2022, , 664, A174, 10.1051/0004-6361/202243319
2022 doi
-
[111]
P., & van Woerden , H
Wakker , B. P., & van Woerden , H. 1997, , 35, 217, 10.1146/annurev.astro.35.1.217
1997 doi
-
[112]
L., Gaensler , B
West , J. L., Gaensler , B. M., Miville-Desch \^e nes , M. A., et al. 2023, , 959, 115, 10.3847/1538-4357/ad0cc0
2023 doi
-
[113]
2018, , 474, 289, 10.1093/mnras/stx2757
Westmeier , T. 2018, , 474, 289, 10.1093/mnras/stx2757
2018 doi
-
[114]
Winkel , B., Kalberla , P. M. W., Kerp , J., & Fl \"o er , L. 2010, , 188, 488, 10.1088/0067-0049/188/2/488
2010 doi
-
[115]
2016, , 585, A41, 10.1051/0004-6361/201527007
Winkel , B., Kerp , J., Fl \"o er , L., et al. 2016, , 585, A41, 10.1051/0004-6361/201527007
2016 doi
-
[116]
2007, , 59, 205, 10.1093/pasj/59.1.205
Yahata , K., Yonehara , A., Suto , Y., et al. 2007, , 59, 205, 10.1093/pasj/59.1.205
2007 doi
- [117]
-
[118]
A., et al
Zhou , R., Dey , B., Newman , J. A., et al. 2023, , 165, 58, 10.3847/1538-3881/aca5fb
2023 doi
- [119]
-
[120]
2019, The Journal of Open Source Software, 4, 1298, 10.21105/joss.01298
Zonca , A., Singer , L., Lenz , D., et al. 2019, The Journal of Open Source Software, 4, 1298, 10.21105/joss.01298
2019 doi
-
[121]
A., Alves , J., et al
Zucker , C., Goodman , A. A., Alves , J., et al. 2022, , 601, 334, 10.1038/s41586-021-04286-5
2022 doi
Reviewed August 12, 2026 · model on record in the stance chip above.
Discussion (0). Continue with ORCID to comment.