REVIEW 5 major objections 5 minor 58 references
The Intrinsic Scatter of the Radial Acceleration Relation
T0 review · 5 major / 5 minor · reviewed 2026-08-14 · deepseek-v4-flash
Pith's one-line read The radial acceleration relation carries intrinsic scatter of 0.11 dex.
desk verdict A careful Monte Carlo error model on a 2,500-galaxy catalog yields a nonzero RAR intrinsic scatter around 0.11 dex that favors LCDM over L17's null, but the value leans heavily on the adopted M/L uncertainty and is less secure than the abstract's ±0.02 suggests. read the letter →
The pith
A machine-rendered reading of the paper's core claim, the machinery that carries it, and where it could break.
The reading
What carries the argument
The load-bearing machinery is a Monte Carlo error model that simulates a universe with zero intrinsic scatter and then asks how much scatter observational errors alone would produce. Each observed point is first projected onto the fitted RAR by maximizing a likelihood over all measured parameters—distance, inclination, intrinsic disk flattening, velocity, luminosity, and stellar mass-to-light ratio—while requiring the point to lie exactly on the relation. Those zero-scatter values are then resampled from their uncertainty distributions, and the mock data are run through the same quality cuts and fitting pipeline as the real data. Comparing the mock scatter to the observed scatter in quadrature isolates the intrinsic component, a step that a simple first-order error propagation cannot do because many uncertainties are shared across points within a galaxy.
What would settle it
Measure the stellar mass-to-light ratio independently per galaxy with spatially resolved stellar-population modeling on a PROBES subsample and include noncircular motions modeled from high-resolution simulations; if the simulated scatter from these errors alone rises to the observed $0.17$ dex, the intrinsic scatter is zero, and the $0.11$ dex claim collapses.
Extended reading notes
Core claim
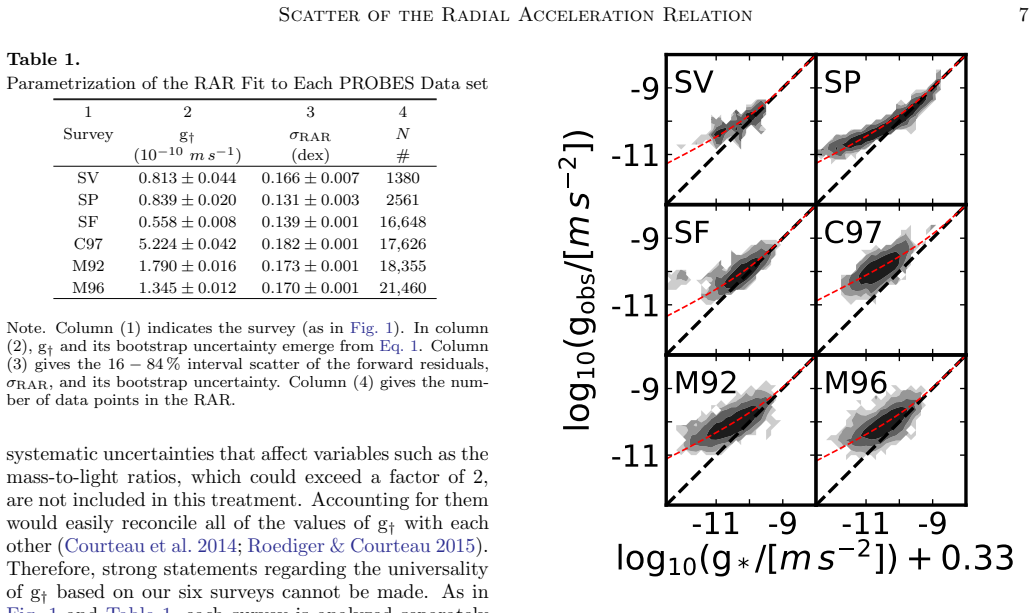
The central discovery is that the apparent tightness of the RAR hides a non-zero cosmic scatter whose size matches the expectations of cosmological galaxy formation. Using the forward residuals of the stellar RAR, the median observed scatter across six surveys is $0.17$ dex, while a Monte Carlo model that resamples all known observational errors produces a scatter of $0.12$ dex. The difference in quadrature gives an intrinsic scatter of $0.11\pm0.02$ dex, close to, though slightly larger than, the $0.06$–$0.08$ dex predicted by ΛCDM simulations and incompatible with the null value previously inferred. The intrinsic scatter also decreases with galaxy mass, from about $0.14$ dex at low mass to about $0.10$ dex at high mass, mirroring simulation trends.
Load-bearing premise
The Monte Carlo error model has to capture every significant observational uncertainty—especially the $0.13$ dex stellar mass-to-light ratio scatter, inclination recovery from axis ratios, magnitude errors, and the neglect of noncircular motions—because any underestimate inflates the claimed intrinsic scatter.
Editorial extensions
If this is right
- A non-zero intrinsic scatter of about $0.11$ dex replaces the null value reported for the baryonic RAR, so the relation no longer discriminates against ΛCDM galaxy formation.
- To reduce the intrinsic scatter to zero, the measurement uncertainties would have to be inflated by factors of about 2 for the stellar mass-to-light ratio up to factors greater than 10 for other parameters.
- The intrinsic scatter decreases with galaxy mass (median $0.144$, $0.103$, and $0.095$ dex from low to high mass), matching the mass dependence seen in ΛCDM simulations and the diversity of dwarf rotation curves.
- In the outer regions beyond one effective radius, where noncircular motions are weaker, the intrinsic scatter is $0.10\pm0.01$ dex, confirming the result.
- The forward versus inverse choice of residuals changes the measured scatter substantially (median forward $0.17$ dex versus inverse $0.24$ dex), a consideration that affects all galaxy scaling relations.
Reading between the lines
- If the intrinsic scatter is genuinely near $0.1$ dex, any modified-gravity theory that demands a perfectly tight relation must be either revised or supplemented by an astrophysical source of scatter.
- The same Monte Carlo projection-and-resample recipe could be applied to the baryonic RAR once gas maps are available for all PROBES galaxies; a similar estimate would directly test the assumption that stellar and baryonic RARs share their scatter.
- The method's logic implies a falsifiable hierarchy: future higher-resolution, lower-error surveys should show the observed scatter shrinking toward the simulated error scatter, keeping the quadrature residual near $0.1$ dex rather than falling to zero.
- The mass-dependent trend of the intrinsic scatter suggests that a single universal acceleration scale may be an oversimplification; the low-mass tail is where the relation's scatter is largest and where tests of universality should focus.
Signed reviews
Editorial analysis
A structured set of objections, weighed in public.
Referee Report
Summary. This paper develops a Monte Carlo model of observational errors to infer the intrinsic scatter of the stellar radial acceleration relation (RAR). Using a new PROBES compilation of roughly 2500 spiral galaxies from six surveys, the authors fit the MOND-inspired RAR (Eq. 1), project each galaxy onto the zero-scatter relation with a likelihood that accounts for shared parameters (Eq. 10), resample mock observations from the uncertainty model of Sec. 4, and process the mocks through the same fits and quality cuts as the data. Comparing the observed scatter (Table 1, median 0.17 dex) with the simulated scatter (Table 3, median 0.12 dex) in quadrature yields a median intrinsic scatter of 0.11 +/- 0.02 dex (Sec. 6.2), which the authors claim agrees with LCDM predictions of 0.06-0.08 dex and contradicts the null scatter reported by L17. Sensitivity tests in Table 5 and a beyond-one-Re check are presented in support of the result.
Significance. If the inference is robust, the paper would resolve an important controversy: it would show that the apparent tightness of the RAR is not exactly zero intrinsic scatter, alleviating the tension with LCDM galaxy formation simulations and weakening a simple MOND-based requirement. The study's strengths are its large, heterogeneous sample; the explicit modeling of shared per-galaxy errors; and the use of identical processing code for real and mock data, which avoids several common circularity pitfalls. The sensitivity table (Table 5) and the beyond-one-Re analysis are commendable. However, the central number is only as good as the error model in Sec. 4, and several components of that model are either unvalidated for the heterogeneous samples or defined inconsistently. These issues currently prevent me from endorsing the quantitative claim as established.
major comments (5)
- [§4.1, Eq. (4)] The distance uncertainty model is dimensionally inconsistent. The text states sigma_D = max(0.15D, 300), with 300 km/s being a peculiar velocity dispersion, while Eq. (4) uses sigma_D/D. As written, the first term treats sigma_D as a distance and the second as a velocity; the intended expression must involve sigma_pec/H_0 or an explicit unit conversion. Since Table 5 lists a distance-error scaling factor of 2.1, this ambiguity directly affects the inferred sigma_sim and sigma_int and must be corrected before the error model is usable.
- [§5.2 and §2.2] The mock galaxies are treated as spherically symmetric, while the observed g* values are computed from a flattened disk density (Eq. 7). The paper justifies this by noting that g* depends linearly on luminosity and mass-to-light ratio, but the disk geometry changes the radial profile of g* and hence the covariance structure of the forward residuals entering sigma_sim. The internal consistency argument only holds if the spherical simplification is demonstrated not to bias the scatter; I recommend running the Monte Carlo for at least one survey with a disky potential, or otherwise quantifying the effect.
- [§4.5 and Table 5] The derived intrinsic scatter is highly sensitive to the adopted random stellar mass-to-light ratio uncertainty. Table 5 shows that scaling that uncertainty by a factor of 1.7 (from 0.13 to roughly 0.22 dex) is sufficient to make the median sigma_int zero. The adopted 0.13 dex is a representative upper value from Roediger & Courteau (2015) for optical bands, not a validated value for each heterogeneous PROBES sample, and random M/L scatter estimates in the literature can reach about 0.2 dex. The single-parameter stress test also leaves open the possibility that modest combined underestimates of velocity, distance, and M/L errors remove the signal; a multi-parameter stress test or a prior-weighted marginalization over M/L uncertainty is needed to support the claim that the nonzero scatter is robust.
- [§6.2 and §4.3] Noncircular motions are not included in the error model. The beyond-one-Re check gives 0.10 +/- 0.01 dex, but this only removes the inner disk, where noncircular motions are strongest; the outer disk can still host warps, bars, or spiral perturbations that contribute to the observed scatter. A concrete test using the SPARC Q=1 versus Q=2 flags, or a comparison of H-alpha and H I rotation curves, would bound the magnitude of this neglected term. Without such a test, part of sigma_RAR may be misattributed to intrinsic scatter.
- [§6.2, Tables 4 and 7] The reported sample-median value conceals strong survey-to-survey variation. SPARC alone gives sigma_int = 0.040 +/- 0.013 dex, and several mass-binned entries in Table 7 are negative (sigma_int approximately -0.02 to -0.05 dex). The surveys with adopted rather than measured uncertainties (M92, M96, and to some extent C97) drive the median upward. The authors should either restrict the headline claim to samples with per-point errors, or justify why the heterogeneous and adopted-error samples can be combined in a single quadrature subtraction.
minor comments (5)
- [§3.1.5] The exclusion of the 12 Q=3 SPARC galaxies is mentioned in Sec. 3.1.5, but the general quality-cut description in Sec. 3.2 does not state whether Q=3 objects are removed from the RAR analysis; please make this explicit.
- [§4.2] The text says axis ratio uncertainties are computed from isophotal ellipticity variations beyond Re, but the exact estimator (e.g., standard deviation of the mean, median absolute deviation) is not specified; Fig. 2 shows the resulting distributions but not the recipe.
- [§5.1] The maximum-likelihood projection in Eq. (10) is a methodological novelty, but the manuscript does not describe how the optimization is initialized or how convergence is verified for galaxies with many points; a brief technical note would improve reproducibility.
- [Table 5] The entries reported as '>10' for total luminosity and intrinsic disk flattening have no upper bound; please specify the search procedure or the maximum scaling factor that was tested.
- [§1] The claim that the stellar and baryonic RAR scatters are comparable is supported in part by a private communication (A. Dutton 2019); please replace this with a published or otherwise publicly documented analysis.
Circularity Check
No significant circularity: the Monte Carlo error model is independent of the observed scatter, and the derived intrinsic scatter is not an artifact of the adopted inputs.
full rationale
The paper's central number is obtained by subtracting the Monte Carlo error-scatter (median sigma_sim ≈ 0.12 dex, Table 3) from the observed scatter (median sigma_RAR ≈ 0.17 dex, Table 1) in quadrature (Sec. 6.2, Table 4). This is not circular: sigma_sim is produced by projecting the data onto the fitted RAR under an explicit zero-intrinsic-scatter null and resampling the pre-specified uncertainty distributions of Sec. 4; no element of that error model is tuned to match the observed 0.17 dex. The paper's own stress test (Table 5) shows that individual uncertainties would have to be inflated by factors of 1.7 (stellar mass-to-light ratio), 2.1 (distance), 3.0 (velocity), 5 (zero-point), 7 (intrinsic flattening), and >10 (luminosity, axis ratio) to erase the inferred scatter, which is evidence that the simulated scatter was not constructed to reproduce the observation. The adopted optical M/L uncertainty of 0.13 dex is a literature input from Roediger & Courteau (2015) (Sec. 4.5); although an author overlaps, it is an external stellar-population result, not an output of this paper's fit, so it does not make the subtraction definitionally circular. The RAR functional form (Eq. 1, McGaugh et al. 2016) is used for fitting and projection, but the scatter metric is a running median (Sec. 3.3), so the scatter is not forced by the fitted function. Sec. 6.2 explicitly acknowledges unmodeled noncircular motions and the possibility of underestimated uncertainties; the stellar/baryonic scatter equivalence is supported partly by L17 and partly by a private communication (A. Dutton 2019). These are limitations and supportability concerns, not reductions of the conclusion to its inputs. The derived 0.11±0.02 dex is therefore not equivalent by construction to the adopted error model.
Assumptions & free parameters
free parameters (8)
- Per-survey g-dagger normalisation (Eq. 1 fit) =
0.813, 0.839, 0.558, 5.224, 1.790, 1.345 in 10^-10 m s^-2 for SV, SP, SF, C97, M92, M96
- Optical stellar mass-to-light ratio random uncertainty =
0.13 dex
- 3.6 micron stellar mass-to-light ratio uncertainty =
0.11 dex
- M92/M96 surface brightness uncertainty function parameters =
(a,b,c) = (0.00075, 0.52, 31.97)
- Intrinsic disk flattening q0 by T-type =
0.20 +/- 0.03 (T 1-3), 0.17 +/- 0.03 (T 4), 0.12 +/- 0.02 (T 5-10)
- Hubble flow distance uncertainty =
sigma_D = max(0.15 D, 300 km s^-1 converted with H0)
- Uniform velocity uncertainty for M92/M96 =
6 km s^-1
- Luminosity uncertainty =
0.04 dex
assumptions (4)
- domain assumption The stellar and baryonic RAR have comparable scatter.
- domain assumption The adopted uncertainty distributions in Section 4 describe the true measurement errors, including Gaussian and truncated models for q, q0, V, L, D and M/L.
- domain assumption Noncircular motions can be ignored in the scatter model.
- domain assumption Mock galaxies can be treated as spherically symmetric for error propagation.
Cite this review
Pith. "Pith review of The Intrinsic Scatter of the Radial Acceleration Relation." pith.science (2026). https://pith.science/paper/UKHZ6GUN
@misc{pith2026190806105,
  author       = {Pith},
  title        = {Pith review of: The Intrinsic Scatter of the Radial Acceleration Relation},
  year         = {2026},
  howpublished = {\url{https://pith.science/paper/UKHZ6GUN}},
  note         = {Machine review of arXiv:1908.06105}
}
abstract
We present a detailed Monte Carlo model of observational errors in observed galaxy scaling relations to recover the intrinsic (cosmic) scatter driven by galaxy formation and evolution processes. We apply our method to the stellar radial acceleration relation (RAR) which compares the local observed radial acceleration to the local Newtonian radial acceleration computed from the stellar mass distribution. The stellar and baryonic RAR are known to exhibit similar scatter. Lelli+2017 (L17) studied the baryonic RAR using a sample of 153 spiral galaxies and inferred a negligible intrinsic scatter. If true, a small scatter might challenge the LCDM galaxy formation paradigm, possibly favoring a modified Newtonian dynamics interpretation. The intrinsic scatter of the baryonic RAR is predicted by modern LCDM simulations to be ~0.06-0.08 dex, contrasting with the null value reported by L17. We have assembled a catalog of structural properties with over 2500 spiral galaxies from six deep imaging and spectroscopic surveys (called PROBES for the "Photometry and Rotation curve OBservations from Extragalactic Surveys") to quantify the intrinsic scatter of the stellar RAR and other scaling relations. The stellar RAR for our full sample has a median observed scatter of 0.17 dex. We use our Monte Carlo method, which accounts for all major sources of measurement uncertainty, to infer a contribution of 0.12 dex from the observational errors. The intrinsic scatter of the stellar RAR is thus estimated to be 0.11$\pm$0.02 dex, in agreement with, though slightly greater than, current LCDM predictions.
Figures


Figures from the paper (3 more)


Reference graph
Works this paper leans on
- [1]
- [2]
-
[3]
P., Jord´ an, A., Mei, S., et al
Blakeslee, J. P., Jord´ an, A., Mei, S., et al. 2009, ApJ, 694, 556
work page 2009
-
[4]
D., Aaronson, M., Schommer, B., et al
Bothun, G. D., Aaronson, M., Schommer, B., et al. 1985, ApJS, 57, 423
work page 1985
-
[5]
B., Santos-Santos, I., & Stinson, G
Brook, C. B., Santos-Santos, I., & Stinson, G. 2016, MNRAS, 459, 459
work page 2016
- [6]
- [7]
-
[8]
2013, ARA&A, 51, 393
Conroy, C. 2013, ARA&A, 51, 393
2013
Show all 58 references
-
[9]
1996, ApJS, 103, 363
Courteau, S. 1996, ApJS, 103, 363
1996
-
[10]
1997, AJ, 114, 2402
Courteau, S. 1997, AJ, 114, 2402
1997
-
[11]
S., et al
Courteau, S., Cappellari, M., de Jong, R. S., et al. 2014, Rev. Mod. Phys., 86, 86
2014
-
[12]
A., van den Bosch, F
Courteau, S., Dutton, A. A., van den Bosch, F. C., et al. 2007, ApJ, 671, 203
2007
-
[13]
M., Dressler, A., & Willick, J
Courteau, S., Faber, S. M., Dressler, A., & Willick, J. A. 1993, ApJ, 412, L51
1993
-
[14]
2000, ApJ, 544, 636 de Blok, W
Postman, M. 2000, ApJ, 544, 636 de Blok, W. J. G., Walter, F., Brinks, E., et al. 2008, AJ, 136, 2648 de Grijs, R. 1998, MNRAS, 299, 595
2000
-
[15]
A., Conroy, C., van den Bosch, F
Dutton, A. A., Conroy, C., van den Bosch, F. C., et al. 2011, MNRAS, 416, 322
2011
-
[16]
A., Courteau, S., de Jong, R., & Carignan, C
Dutton, A. A., Courteau, S., de Jong, R., & Carignan, C. 2005, ApJ, 619, 218
2005
-
[17]
A., Macci` o, A
Dutton, A. A., Macci` o, A. V., Obreja, A., & Buck, T. 2019, MNRAS, 485, 1886
2019
-
[18]
2007, ApJ, 654, 27
Courteau, S. 2007, ApJ, 654, 27
2007
-
[19]
2012, MNRAS, 425, 2741
Zhu, Y. 2012, MNRAS, 425, 2741
2012
-
[20]
Haynes, M. P. & Giovanelli, R. 1984, AJ, 89, 758
1984
-
[21]
& Ostriker, J
Hernquist, L. & Ostriker, J. P. 1992, ApJ, 386, 375
1992
-
[22]
Jerjen, H., Binggeli, B., & Barazza, F. D. 2004, AJ, 127, 771
2004
-
[23]
2001, SciPy: Open source scientific tools for Python, [Online; accessed July 2018]
Jones, E., Oliphant, T., Peterson, P., et al. 2001, SciPy: Open source scientific tools for Python, [Online; accessed July 2018]
2001
-
[24]
Keller, B. W. & Wadsley, J. W. 2017, ApJL, 835, L17
2017
-
[25]
C., & de Grijs, R
Kregel, M., Van Der Kruit, P. C., & de Grijs, R. 2002, MNRAS, 334, 334
2002
-
[26]
C., & Freeman, K
Kregel, M., van der Kruit, P. C., & Freeman, K. C. 2005, MNRAS, 358, 503
2005
-
[27]
1982, ESO/Uppsala survey of the ESO(B) atlas
Lauberts, A. 1982, ESO/Uppsala survey of the ESO(B) atlas
1982
-
[28]
1998, VizieR Online Data Catalog, VII/34C
Lauberts, A. 1998, VizieR Online Data Catalog, VII/34C
1998
-
[29]
S., & Schombert, J
Lelli, F., McGaugh, S. S., & Schombert, J. M. 2016, AJ, 152, 157
2016
-
[30]
S., Schombert, J
Lelli, F., McGaugh, S. S., Schombert, J. M., Desmond, H., & Katz, H. 2019, MNRAS, 484, 3267
2019
-
[31]
S., Schombert, J
Lelli, F., McGaugh, S. S., Schombert, J. M., & Pawlowski, M. S. 2017, ApJ, 836, 152
2017
-
[32]
D., Ben´ ıtez-Llambay, A., Schaller, M., et al
Ludlow, A. D., Ben´ ıtez-Llambay, A., Schaller, M., et al. 2017, PhRvL, 118, 118
2017
-
[33]
Mathewson, D. S. & Ford, V. L. 1996, ApJS, 107, 97
1996
-
[34]
S., Ford, V
Mathewson, D. S., Ford, V. L., & Buchhorn, M. 1992, ApJS, 81, 413
1992
-
[35]
B., & Roediger, J
McDonald, M., Courteau, S., Tully, R. B., & Roediger, J. 2011, MNRAS, 414, 414
2011
-
[36]
McGaugh, S. S. 2004, ApJ, 609, 652
2004
-
[37]
McGaugh, S. S. 2012, AJ, 143, 40
2012
-
[38]
S., Lelli, F., & Schombert, J
McGaugh, S. S., Lelli, F., & Schombert, J. M. 2016, PhRvL, 117, 201101 Scatter of the Radial Acceleration Relation 15
2016
-
[39]
Blok, W. J. G. 2000, ApJ, 533, L99
2000
-
[40]
P., Cˆ ot´ e, P., et al
Mei, S., Blakeslee, J. P., Cˆ ot´ e, P., et al. 2007, ApJ, 655, 144
2007
-
[41]
E., Schinnerer, E., van de Ven, G., et al
Meidt, S. E., Schinnerer, E., van de Ven, G., et al. 2014, ApJ, 788, 788
2014
-
[42]
1983, ApJ, 270, 365
Milgrom, M. 1983, ApJ, 270, 365
1983
-
[43]
F., Ben´ ıtez-Llambay, A., Fattahi, A., et al
Navarro, J. F., Ben´ ıtez-Llambay, A., Fattahi, A., et al. 2017, MNRAS, 471, 1841
2017
-
[44]
1995, VizieR Online Data Catalog, VII/26D
Nilson, P. 1995, VizieR Online Data Catalog, VII/26D
1995
-
[45]
A., Brinks, E., et al
Oh, S.-H., Hunter, D. A., Brinks, E., et al. 2015, AJ, 149, 180
2015
-
[46]
A., Marasco, A., Navarro, J
Oman, K. A., Marasco, A., Navarro, J. F., et al. 2019, MNRAS, 482, 821
2019
-
[47]
A., Navarro, J
Oman, K. A., Navarro, J. F., Fattahi, A., et al. 2015, MNRAS, 452, 3650
2015
-
[48]
N.-Q., Courteau, S., Holtzman, J
Ouellette, N. N.-Q., Courteau, S., Holtzman, J. A., et al. 2017, ApJ, 843, 74
2017
-
[49]
Bosma, A., & Peletier, R. F. 2018, MNRAS, 474, 4366
2018
-
[50]
G., Macri, L
Riess, A. G., Macri, L. M., Hoffmann, S. L., et al. 2016, ApJ, 826, 56
2016
-
[51]
C., Marra, V., del Popolo, A., & Davari, Z
Rodrigues, D. C., Marra, V., del Popolo, A., & Davari, Z. 2018, Nature Astronomy, 2, 668
2018
-
[52]
Roediger, J. C. & Courteau, S. 2015, MNRAS, 452, 3209
2015
-
[53]
X., Strauss, M
Santiago, B. X., Strauss, M. A., Lahav, O., et al. 1995, ApJ, 446, 457
1995
-
[54]
Somerville, R. S. & Dav´ e, R. 2015, ARA&A, 53, 51
2015
-
[55]
Romanowsky, A. J. 2011, ApJ, 742, 16 van der Kruit, P. C. & Searle, L. 1981, A&A, 95, 105
2011
-
[56]
Walker, M. A. 1999, MNRAS, 308, 308
1999
-
[57]
F., & Dor´ e, O
Wheeler, C., Hopkins, P. F., & Dor´ e, O. 2018, ArXiv e-prints, arXiv:1803.01849
2018 arXiv
-
[58]
H., & Weisz, D
Zhang, H.-X., Puzia, T. H., & Weisz, D. R. 2017, ApJS, 233, 13
2017
Reviewed August 14, 2026 · model on record in the stance chip above.
Discussion (0). Continue with ORCID to comment.