REVIEW 3 major objections 4 minor 63 references
Time-evolving Diagnostic of the Ionized Absorbers in NGC 4051. II. High-throughput Time-resolved Spectroscopy
T0 review · 3 major / 4 minor · reviewed 2026-08-01 · deepseek-v4-flash
Pith's one-line read By tracking how ion absorption lines lag a hard X-ray flare across 37 time-resolved spectra, this paper fixes the main warm absorber in NGC 4051 at about 10^4 gravitational radii and breaks the density-distance degeneracy.
desk verdict Careful, high-throughput application of time-evolving photoionization that plausibly locates NGC 4051's warm absorbers, but the result hinges on a rigid SED driver that ignores the measured spectral-index variability. read the letter →
The pith
A machine-rendered reading of the paper's core claim, the machinery that carries it, and where it could break.
The reading
What carries the argument
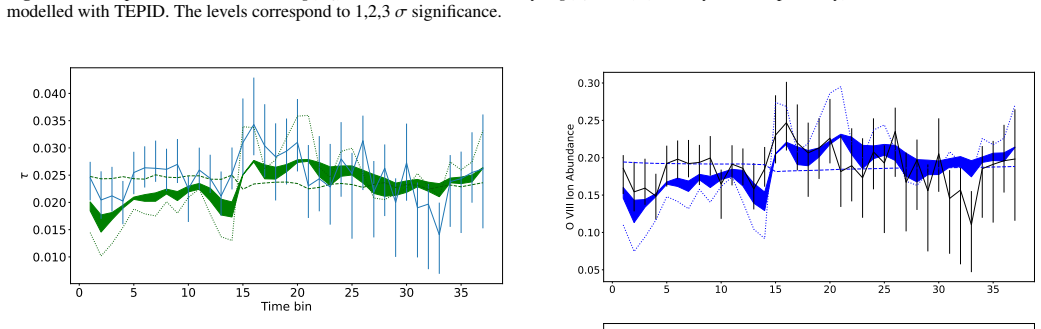
The central object is TEPID, a time-evolving photoionisation code that tracks how ionic abundances and temperature respond to a time-variable ionising continuum. The key identity is the equilibration timescale, t_eq proportional to 1/n_e, which converts the observed lag between continuum changes and absorption-line changes into a density measurement; combining that density with the ionization parameter through r = sqrt(Q_ion / (4 pi U n_H c)) then gives the distance. The analysis fits 37 simultaneously analysed soft and hard X-ray spectra with ionic columns predicted by TEPID, so the shape of the lag directly selects n_e over a grid spanning 10^5 to 10^10 cm^-3.
What would settle it
Take another long, bright X-ray observation of NGC 4051 during a different variability pattern and repeat the same TEPID fit: the gas density is a physical property, so the HIP should again come out near log n_e about 7.0 cm^-3. A significantly different best-fit density would indicate the inferred radius depends on the assumed SED scaling rather than on the gas itself.
Extended reading notes
Core claim
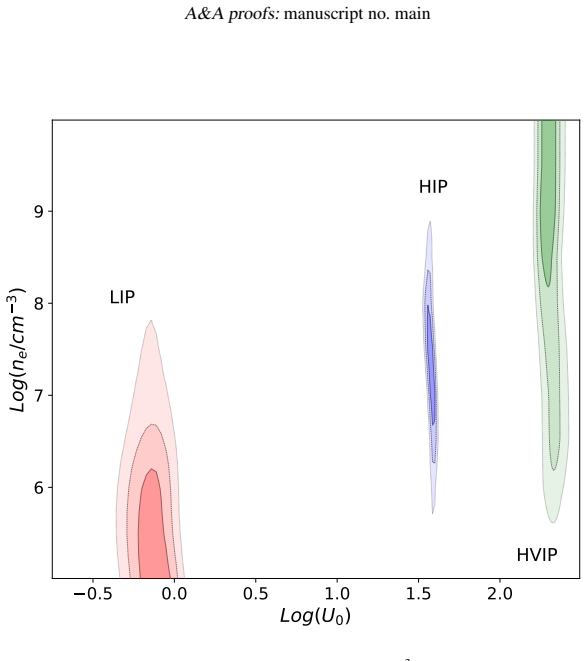
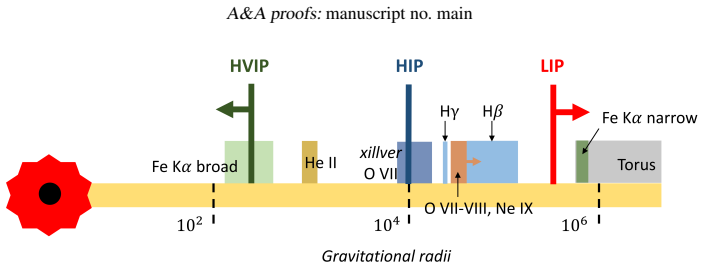
The central claim is that the highest-opacity, intermediate-ionisation absorber (HIP) in NGC 4051 has a fully constrained electron density and radius: log(n_e/cm^-3) = 7.0(+0.5/-0.2) and r = (10.1+0.8/-0.3) x 10^3 r_G. That radius puts the gas inside the broad-line region, aligned with the He II-emitting zone and the soft X-ray emission lines. The fastest, most ionised component lies within 600 r_G, matching the broad Fe K-alpha line, and the slowest, least ionised component lies at >=3.8 x 10^5 r_G, near the torus and narrow Fe K-alpha. The same fit gives a total outflow energy rate below 10^-4 of the bolometric luminosity, so these winds cannot provide significant mechanical feedback to th
Load-bearing premise
The load-bearing premise is that the ionising continuum's variability is fully tracked by the hard X-ray 3-6 keV lightcurve on which the entire SED is rigidly scaled, and that each absorber is a single uniform-density cloud; if the EUV or soft X-ray ionising flux varies with a different pattern or the clouds are structured, the inferred densities and radii will be biased.
Editorial extensions
If this is right
- The HIP density and distance are fixed: log n_e = 7.0(+0.5/-0.2) cm^-3 and r about 10^4 r_G, placing it inside the BLR and cospatial with the soft X-ray emission lines.
- The HVIP must lie within 600 r_G, matching the broad Fe K-alpha component, while the LIP must lie beyond 3.8 x 10^5 r_G, matching the torus and narrow Fe K-alpha.
- The total energy outflow rate is below 10^-4 of the bolometric luminosity, so these warm absorbers do not provide significant mechanical feedback to the host galaxy.
- Because the observed absorber velocities are below the escape velocity at their measured radii, the outflows are likely bound 'failed winds' unless the line of sight strongly underestimates the true, more vertical velocities.
- The method demonstrates that time-evolving photoionisation applied to high-throughput time-resolved spectroscopy can break the n_e-r degeneracy, opening a route to locating and weighing nuclear outflows in other bright variable AGNs.
Reading between the lines
- If the hard-band lightcurve scaling assumption is violated, and the EUV or soft X-ray ionising continuum varies with a different pattern or lag, the derived densities and radii across all three absorbers could shift systematically; a simultaneous high-cadence EUV or soft X-ray lightcurve would test this directly.
- The same ionization-lag technique could be applied to ultraviolet absorption lines in NGC 4051, monitoring C IV and N V variability with comparable cadence, to check whether the low-ionisation absorber responds at the same distance claimed here.
- The inferred co-location of the three absorbers with the broad Fe K-alpha, the BLR, and the torus suggests a single stratified wind rather than three independent clouds; a testable consequence is that absorber columns and velocities should vary coherently on timescales set by their respective radii if the continuum changes.
- If this energy budget generalises, slow warm absorbers in similar Seyferts are unlikely to be the main AGN feedback channel, so searches for mechanical feedback should focus on ultra-fast outflows, radio jets, or other more energetic components.
Editorial analysis
A structured set of objections, weighed in public.
Referee Report
Summary. The paper applies the time-evolving photoionisation code TEPID to 37 time-resolved XMM-Newton EPIC-pn and NuSTAR spectra of NGC 4051, jointly fitting three ionised absorbers (LIP, HIP, HVIP) with column densities and velocities fixed to the time-averaged RGS values from Paper I. The key result is a fully constrained density and radius for the HIP: log(n_e/cm^-3) = 7.0(+0.5,-0.2) and r = (10.1^+0.8_-0.3) × 10^3 r_G, derived from the fitted U_0 and n_e through Eq. (1). Upper/lower limits are placed on the other absorbers, and the total outflow energy rate is reported below 10^-4 L_bol, with locations compared to BLR, torus, and Fe Kα components.
Significance. If the density-radius result is robust, this is a valuable demonstration of time-resolved spectroscopy as a tool to break the density-distance degeneracy in AGN outflows, with the HIP position tied to the BLR and the HVIP to the broad Fe Kα region. The analysis is unusually detailed: TEPID is cross-checked against Cloudy (Figs. 2–3), the continuum is constrained with simultaneous XMM and NuSTAR, and the derived locations are externally consistent with independent BLR/torus estimates. However, the central HIP constraint rests on assumptions about the driving SED and on fixed column densities; these need to be tested before the result can be taken at face value.
major comments (3)
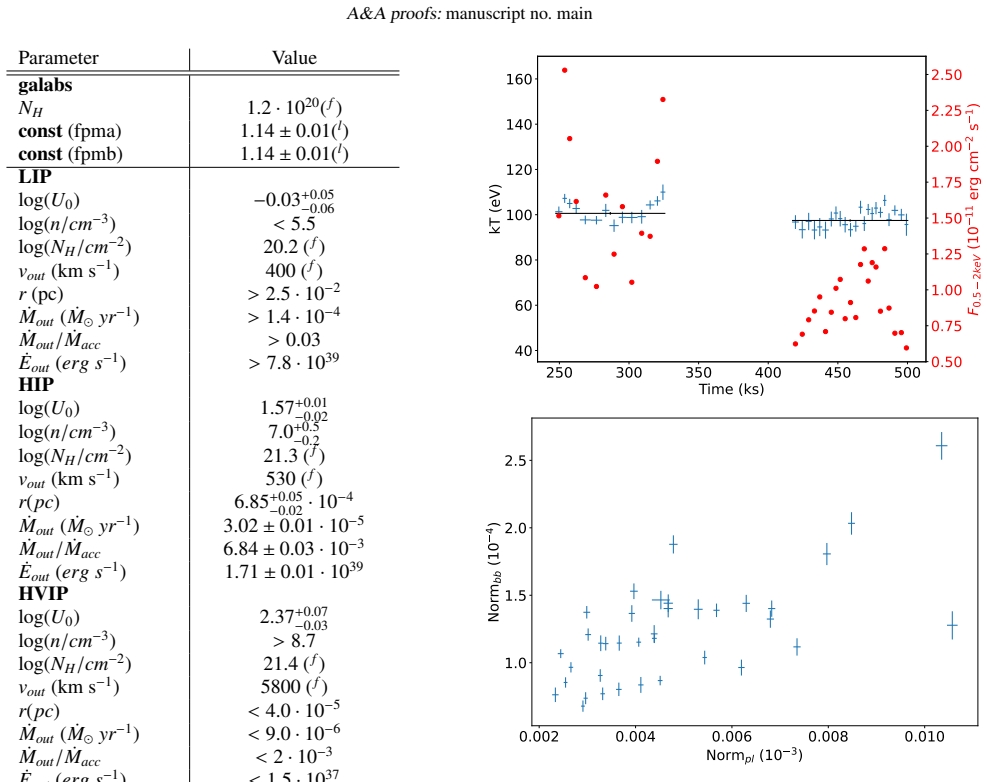
- [§3.2, §4.1, Eq. (1)] The TEPID input SED is scaled rigidly according to the NuSTAR 3–6 keV lightcurve, while the spectral fits allow Γ to vary freely and find a strong Γ–F correlation (Fig. 6). For a power-law continuum, a change ΔΓ=0.2 at fixed 3–6 keV flux changes the ionizing photon rate at ~0.5 keV by a factor ~1.5, so the assumed driving lightcurve can differ substantially from the true one. Since n_e is inferred from the response lag of the ionic columns, this systematic is not included in the quoted errors. Please repeat the TEPID fit using the measured Γ(t) as an additional driver, or provide a sensitivity analysis bounding the systematic on log n_e.
- [§4.1] N_H and v_out are fixed to the time-averaged RGS values for all three absorbers. If the columns or covering fractions vary over the 160 ks, the time-dependent optical depth changes would be absorbed into n_e, biasing the density estimate. The paper does not test this assumption. At minimum, a check with N_H free in a subset of bins, or a discussion of why column variability is negligible, is needed.
- [Table 1] The global χ²/dof = 10140.5/15633 = 0.65 is far below unity and is not commented on. This may indicate overestimated errors or model flexibility, which would affect the reliability of the reported 1σ contours for log n_e. The authors should discuss the statistic and, if appropriate, rescale errors or use a statistic better matched to the data.
minor comments (4)
- [Fig. 10 caption] Typo: 'soposnds' should be 'corresponds'.
- [§5.1] The escape velocity formula is written as sqrt(2GM⊙/r); the mass should be the black hole mass M_BH, not the solar mass, since the context is the gravitational potential of the black hole.
- [§2.1] The text refers to the NuSTAR 3–79 keV lightcurve, but the TEPID driver uses the 3–6 keV lightcurve. The identity is reasonable, but the wording is slightly confusing; please clarify which lightcurve is used and why the hard band is a good proxy.
- [§3.2] The sentence 'It must be noted that similar results ... would be obtained by scaling rigidly the whole SED' addresses only a normalization choice, not the spectral-shape variability discussed in Major Comment 1. Please rephrase to avoid implying that this comparison rules out Γ-driven systematics.
Circularity Check
No significant circularity: the HIP density is a genuinely fitted temporal-response parameter, and the radius follows algebraically from the definition of U; self-citations are for code validation and prior measurements, not load-bearing.
full rationale
The derivation chain is: (i) the 37 time-resolved EPIC-pn/NuSTAR spectra are fitted with PHASE+TEPID models; (ii) n_e enters as a free parameter controlling the ionic response lag through t_eq / 1/n_e; (iii) the HIP density log n_e = 7.0(+0.5,-0.2) is determined by chi^2 minimization; (iv) r is then computed from Eq. 1, r = sqrt(Q_ion/(4 pi U n_H c)), which is the definition of the ionization parameter, not an independent prediction. This is standard inference: the density is constrained by a different observable (the timescale of ionic-column variability), so the density-distance degeneracy is genuinely broken rather than reproduced. The BLR/torus/Fe K-alpha coincidences quoted in Table 2 come from independent literature or from Paper I (RGS absorption measurements); they are external consistency checks, not inputs that force n_e or r. The f_U initial over/under-ionization parameter is allowed to vary but converges to 1.0 +/- 0.2, so the result does not depend on the initial condition. Self-citations (TEPID, Paper I, Nicastro et al. 1999, K07) are used for code description, previous measurements, and the standard t_eq relation; the code is also validated against Cloudy in Figs. 2-3. The main caveat - a rigidly scaled NuSTAR 3-6 keV SED driver while Gamma(t) varies in the continuum fits - is a systematic modeling assumption that could bias n_e, but it is not a circular reduction of the result to its inputs. No step in the paper makes the derived n_e or r equal, by construction, to a fitted parameter or to a self-cited claim.
Assumptions & free parameters
free parameters (8)
- log(U0)_HIP =
1.57 (+0.01/−0.02)
- log(n_e)_HIP =
7.0 (+0.5/−0.2)
- log(U0)_LIP =
−0.03 (+0.05/−0.06)
- log(n_e)_LIP =
<5.5
- log(U0)_HVIP =
2.37 (+0.07/−0.03)
- log(n_e)_HVIP =
>8.7
- f_U =
1.0 ± 0.2
- Continuum parameters (Γ, kT, bb norm, xillver norm) =
e.g., Γ: 1.83±0.02; kT: 98.9±0.4 eV; xillver norm Obs1 1.25±0.03, Obs2 0.67±0.03 (Table 1)
assumptions (5)
- domain assumption The recombination/ionization equilibrium timescale is inversely proportional to electron density (t_eq ∝ 1/n_e).
- domain assumption The ionizing continuum variability is tracked by the NuSTAR 3-6 keV lightcurve; the SED is scaled rigidly above 0.3 keV.
- domain assumption Each absorber is a single-zone, homogeneous slab with uniform density and no density gradient or covering-factor evolution.
- domain assumption Photoionization equilibrium at t=0, with possible f_U scaling.
- domain assumption TEPID atomic data and radiative transfer are sufficiently accurate.
Cite this review
Pith. "Pith review of Time-evolving Diagnostic of the Ionized Absorbers in NGC 4051. II. High-throughput Time-resolved Spectroscopy." pith.science (2026). https://pith.science/paper/UKXLXQLK
@misc{pith2026260720621,
  author       = {Pith},
  title        = {Pith review of: Time-evolving Diagnostic of the Ionized Absorbers in NGC 4051. II. High-throughput Time-resolved Spectroscopy},
  year         = {2026},
  howpublished = {\url{https://pith.science/paper/UKXLXQLK}},
  note         = {Machine review of arXiv:2607.20621}
}
abstract
Active Galactic Nuclei (AGNs) are one of the most powerful sources in the Universe. The accretion-liberated energy can strongly impact the surrounding environment, up to the host galaxy and beyond. Notwithstanding their ubiquitous presence, nuclear outflows are poorly characterised, mainly due to the degeneracy between their number density $n_e$ and radial location $r$, intrinsic in the photoionisation equilibrium models which are usually employed to fit the observations. This degeneracy prevents a self-consistent determination of the gas energetics and, therefore, of the efficiency in transporting the AGN energy outwards. We analyse a joint XMM-Newton and NuSTAR observation of the bright, highly-variable AGN NGC 4051. The high flux allows to perform time-resolved spectroscopy and, thus, to study the evolution of its three main ionised absorbers. Since the timescale of the gas ionisation variability depends on its number density, constraining it allows to break the density-distance degeneracy. We employ the Time-Evolving PhotoIonisation Device (TEPID) to model the temporal evolution of the outflows. We split the observation in 37 time-resolved spectra, each few kiloseconds long (total duration 160 ksec), and we fit them jointly with the time-resolved ionised spectra. We fully constrain $n_e=10^7 cm^{-3}$ and $r=10^4$ gravitational radii for the absorber with the highest opacity and intermediate ionisation. This distance is the same of the optical and UV Broad Line Region and of the soft X-ray emission lines. The fastest and most ionised absorber is at $r<600 r_G$, cospatial with the broad component of the Fe K$\alpha$ line. The slowest and least ionised absorber is at $r \geq 3.8 \cdot 10^5 r_G$, the same distance of the cold torus and the narrow Fe K$\alpha$. The total energy outflow rate is below $10^{-4} L_{bol}$, ruling out a meaningful mechanical impact on the host galaxy.
Figures


Figures from the paper (8 more)




Reference graph
Works this paper leans on
-
[1]
Bautista, M. A., & Kallman, T. R. 2001, ApJS, 134, 139, doi:10.1086/320363
doi:10.1086/320363 2001
-
[2]
2026, A&A, 710, A274, doi:10.1051/0004-6361/202659493
Bianchi, S., Vander Meulen, B., Bertola, E., et al. 2026, A&A, 710, A274, doi:10.1051/0004-6361/202659493
-
[3]
A., Altun, Z., & Badnell, N
Bleda, E. A., Altun, Z., & Badnell, N. R. 2022, A&A, 668, A72, doi:10.1051/ 0004-6361/202244043
2022
-
[4]
Brenneman, L. W., Wilkins, D. R., Ogorzałek, A., et al. 2025, ApJ, 995, 200, doi:10.3847/1538-4357/ae1225
-
[5]
R., Davis, J
Canizares, C. R., Davis, J. E., Dewey, D., et al. 2005, PASP, 117, 1144, doi:10. 1086/432898
2005
-
[6]
L., Rodríguez-Ardila, A., et al
Coffey, D., Longinotti, A. L., Rodríguez-Ardila, A., et al. 2014, MNRAS, 443, 1788, doi:10.1093/mnras/stu1294
-
[7]
J., Brandt, W
Collinge, M. J., Brandt, W. N., Kaspi, S., et al. 2001, ApJ, 557, 2, doi:10.1086/ 321635 de Vaucouleurs, G., de Vaucouleurs, A., Corwin, Jr., H. G., et al. 1991, S&T, 82, 621
2001
-
[8]
A., Kallman, T
Ding, Y ., Garcıa, J. A., Kallman, T. R., et al. 2024, ApJ, 974, 280, doi:10.3847/ 1538-4357/ad76a1
2024
Show all 63 references
-
[9]
2000, ApJ, 545, 63 Faucher-Giguère, C.-A., & Quataert, E
Elvis, M. 2000, ApJ, 545, 63 Faucher-Giguère, C.-A., & Quataert, E. 2012, MNRAS, 425, 605, doi:10.1111/ j.1365-2966.2012.21512.x
2000
-
[10]
M., Grier, C
Fausnaugh, M. M., Grier, C. J., Bentz, M. C., Denney, K. D., & De Rosa, G. e. a. 2017, ApJ, 840, 97, doi:10.3847/1538-4357/aa6d52
2017 doi
-
[11]
2024, A&A, 686, A36, doi:10.1051/0004-6361/202345849
Fiore, F., Gaspari, M., Luminari, A., Tozzi, P., & de Arcangelis, L. 2024, A&A, 686, A36, doi:10.1051/0004-6361/202345849
2024 doi
-
[12]
2017, A&A, 601, A143, doi:10.1051/ 0004-6361/201629478
Fiore, F., Feruglio, C., Shankar, F., et al. 2017, A&A, 601, A143, doi:10.1051/ 0004-6361/201629478
2017
-
[13]
2001, in Society of Photo-Optical In- strumentation Engineers (SPIE) Conference Series, V ol
Freeman, P., Doe, S., & Siemiginowska, A. 2001, in Society of Photo-Optical In- strumentation Engineers (SPIE) Conference Series, V ol. 4477, Astronomical Data Analysis, ed. J.-L. Starck & F. D. Murtagh, 76–87, doi:10.1117/12. 447161 García, J., Elhoussieny, E. E., Bautista, M...
2001 doi
-
[14]
2019, A&A, 630, A94, doi:10.1051/0004-6361/ 201833810
Giustini, M., & Proga, D. 2019, A&A, 630, A94, doi:10.1051/0004-6361/ 201833810
2019 doi
-
[15]
1991, ApJ, 380, L51
Haardt, F., & Maraschi, L. 1991, ApJ, 380, L51
1991
-
[16]
A., Craig, W
Harrison, F. A., Craig, W. W., Christensen, F. E., et al. 2013, ApJ, 770, 103, doi:10.1088/0004-637X/770/2/103 Article number, page 11 of 14 A&A proofs:manuscript no. main HI4PI Collaboration, Ben Bekhti, N., Flöer, L., et al. 2016, A&A, 594, A116, doi:10.1051/0004-6361/201629178
2013 doi
-
[18]
2001, A&A, 365, L1, doi:10.1051/ 0004-6361:20000036
Jansen, F., Lumb, D., Altieri, B., et al. 2001, A&A, 365, L1, doi:10.1051/ 0004-6361:20000036
2001
-
[19]
2025, ApJ, 994, L13, doi:10
Kammoun, E., Kawamuro, T., Murakami, K., et al. 2025, ApJ, 994, L13, doi:10. 3847/2041-8213/ae18c2
2025
-
[20]
N., George, I
Kaspi, S., Brandt, W. N., George, I. M., et al. 2002, ApJ, 574, 643, doi:10. 1086/341113
2002
-
[21]
2015, ARA&A, 53, 115, doi:10.1146/ annurev-astro-082214-122316
King, A., & Pounds, K. 2015, ARA&A, 53, 115, doi:10.1146/ annurev-astro-082214-122316
2015
-
[22]
2024, ApJ, 972, 32, doi:10.3847/ 1538-4357/ad5b5a
Kosec, P., Rogantini, D., Kara, E., et al. 2024, ApJ, 972, 32, doi:10.3847/ 1538-4357/ad5b5a
2024
-
[23]
2026, ApJ, 1004, 104, doi:10.3847/ 1538-4357/ae680a
Kosec, P., Brenneman, L., Kara, E., et al. 2026, ApJ, 1004, 104, doi:10.3847/ 1538-4357/ae680a
2026
-
[24]
B., Crenshaw, D
Kraemer, S. B., Crenshaw, D. M., Dunn, J. P., et al. 2012, ApJ, 751, 84, doi:10. 1088/0004-637X/751/2/84
2012
- [25]
-
[26]
S., et al
Krongold, Y ., Nicastro, F., Brickhouse, N. S., et al. 2003, ApJ, 597, 832, doi:10. 1086/378639
2003
-
[27]
2007, ApJ, 659, 1022, doi:10.1086/ 512476
Krongold, Y ., Nicastro, F., Elvis, M., et al. 2007, ApJ, 659, 1022, doi:10.1086/ 512476
2007
-
[28]
L., Santos-Lleó, M., et al
Krongold, Y ., Longinotti, A. L., Santos-Lleó, M., et al. 2021, ApJ, 917, 39, doi:10.3847/1538-4357/ac0977
2021 doi
-
[29]
2021, A&A, 645, A118, doi:10
Laurenti, M., Luminari, A., Tombesi, F., et al. 2021, A&A, 645, A118, doi:10. 1051/0004-6361/202039409
2021
-
[30]
P., Reeves, J
Lobban, A. P., Reeves, J. N., Miller, L., et al. 2011, MNRAS, 414, 1965, doi:10. 1111/j.1365-2966.2011.18513.x
2011
-
[31]
L., Krongold, Y ., Guainazzi, M., et al
Longinotti, A. L., Krongold, Y ., Guainazzi, M., et al. 2015, ApJ, 813, L39, doi:10.1088/2041-8205/813/2/L39
2015 doi
-
[32]
2021, A&A, 646, A111, doi:10
Luminari, A., Nicastro, F., Elvis, M., et al. 2021, A&A, 646, A111, doi:10. 1051/0004-6361/202039396
2021
-
[33]
Luminari, A., Nicastro, F., Krongold, Y ., Piro, L., & Thakur, A. L. 2023, A&A, 679, A141, doi:10.1051/0004-6361/202245600
2023 doi
-
[34]
A., Brusa, M., Lanzuisi, G., et al
Matzeu, G. A., Brusa, M., Lanzuisi, G., et al. 2023, A&A, 670, A182, doi:10. 1051/0004-6361/202245036
2023
-
[35]
1998, A&AS, 133, 403, doi:10.1051/aas:1998330
Mazzotta, P., Mazzitelli, G., Colafrancesco, S., & Vittorio, N. 1998, A&AS, 133, 403, doi:10.1051/aas:1998330
1998 doi
-
[36]
S., Eckart, M
Mehdipour, M., Kaastra, J. S., Eckart, M. E., et al. 2025, A&A, 699, A228, doi:10.1051/0004-6361/202555623
2025 doi
-
[37]
2026, A&A, 710, A118, doi:10
Middei, R., Piconcelli, E., Nardini, E., et al. 2026, A&A, 710, A118, doi:10. 1051/0004-6361/202659321
2026
- [38]
-
[39]
C., & Elvis, M
Nicastro, F., Fiore, F., Perola, G. C., & Elvis, M. 1999, ApJ, 512, 184, doi:10. 1086/306736
1999
-
[40]
2025, ApJ, 993, L53, doi:10.3847/ 2041-8213/ae14e8
Noda, H., Yamada, S., Ogawa, S., et al. 2025, ApJ, 993, L53, doi:10.3847/ 2041-8213/ae14e8
2025
-
[41]
M., Mason, K
Ogle, P. M., Mason, K. O., Page, M. J., et al. 2004, ApJ, 606, 151, doi:10.1086/ 382744
2004
-
[42]
Osterbrock, D., & Ferland, G. J. 2006, Astrophysics of gaseous nebulae and active galactic nuclei, ed. D. E. Osterbrock & G. J. Ferland
2006
-
[43]
M., & Behar, E
Peretz, U., Miller, J. M., & Behar, E. 2019, ApJ, 879, 102, doi:10.3847/ 1538-4357/ab23ef
2019
-
[44]
2002, ApJ, 580, 261, doi:10.1086/343081
Perna, R., & Lazzati, D. 2002, ApJ, 580, 261, doi:10.1086/343081
2002 doi
-
[45]
M., McHardy, I
Peterson, B. M., McHardy, I. M., Wilkes, B. J., et al. 2000, ApJ, 542, 161, doi:10.1086/309518
2000 doi
-
[47]
N., Ogawa, S., Turner, T
Reeves, J. N., Ogawa, S., Turner, T. J., et al. 2026, ApJ, 1001, 137, doi:10. 3847/1538-4357/ae5527
2026
-
[48]
2022, ApJ, 940, 122, doi:10
Rogantini, D., Mehdipour, M., Kaastra, J., et al. 2022, ApJ, 940, 122, doi:10. 3847/1538-4357/ac9c01
2022
-
[49]
B., & Lightman, A
Rybicki, G. B., & Lightman, A. P. 1979, Radiative processes in astrophysics
1979
-
[50]
R., Bautista, M
Sadaula, D. R., Bautista, M. A., García, J. A., & Kallman, T. R. 2023, ApJ, 946, 93, doi:10.3847/1538-4357/acbd40
2023 doi
-
[51]
R., Kallman, T
Sadaula, D. R., Kallman, T. R., & Laha, S. 2025, ApJ, 992, 182, doi:10.3847/ 1538-4357/ae032f
2025
-
[52]
2017, A&A, 600, A101, doi:10.1051/ 0004-6361/201629885
Serafinelli, R., Vagnetti, F., & Middei, R. 2017, A&A, 600, A101, doi:10.1051/ 0004-6361/201629885
2017
-
[53]
2024, A&A, 690, A145, doi:10
Serafinelli, R., De Rosa, A., Tortosa, A., et al. 2024, A&A, 690, A145, doi:10. 1051/0004-6361/202450777
2024
-
[54]
2025, ApJ, 995, 6, doi:10.3847/ 1538-4357/ae1614
Serafinelli, R., Nicastro, F., Luminari, A., et al. 2025, ApJ, 995, 6, doi:10.3847/ 1538-4357/ae1614
2025
-
[55]
I., & Sunyaev, R
Shakura, N. I., & Sunyaev, R. A. 1973, A&A, 24, 337
1973
-
[56]
W., Yaqoob, T., & Wang, J
Shu, X. W., Yaqoob, T., & Wang, J. X. 2010, ApJS, 187, 581, doi:10.1088/ 0067-0049/187/2/581
2010
-
[57]
A., & Papadakis, I
Sobolewska, M. A., & Papadakis, I. E. 2009, MNRAS, 399, 1597, doi:10. 1111/j.1365-2966.2009.15382.x
2009
-
[58]
C., Fenov ˇcík, M., Kaastra, J
Steenbrugge, K. C., Fenov ˇcík, M., Kaastra, J. S., Costantini, E., & Verbunt, F. 2009, A&A, 496, 107, doi:10.1051/0004-6361/200810416 Strüder, L., Briel, U., Dennerl, K., et al. 2001, A&A, 365, L18
2009 doi
-
[59]
2020, in Society of Photo-Optical In- strumentation Engineers (SPIE) Conference Series, V ol
Tashiro, M., Maejima, H., Toda, K., et al. 2020, in Society of Photo-Optical In- strumentation Engineers (SPIE) Conference Series, V ol. 11444, Space Tele- scopes and Instrumentation 2020: Ultraviolet to Gamma Ray, ed. J.-W. A. den
2020
- [60]
-
[61]
L., Piro, L., Luminari, A., et al
Thakur, A. L., Piro, L., Luminari, A., et al. 2026, Nature Astronomy, doi:10. 1038/s41550-026-02786-w
2026
-
[62]
Tortosa, A., Bianchi, S., Marinucci, A., Matt, G., & Petrucci, P. O. 2018, A&A, 614, A37, doi:10.1051/0004-6361/201732382
2018 doi
-
[63]
D., McHardy, I
Uttley, P., Taylor, R. D., McHardy, I. M., et al. 2004, MNRAS, 347, 1345, doi:10.1111/j.1365-2966.2004.07321.x
2004
-
[64]
M., Veilleux, S., McKernan, B., & Kallman, T
Winter, L. M., Veilleux, S., McKernan, B., & Kallman, T. R. 2012, ApJ, 745, 107, doi:10.1088/0004-637X/745/2/107 Xrism Collaboration, Audard, M., Awaki, H., et al. 2024, ApJ, 973, L25, doi:10. 3847/2041-8213/ad7397 —. 2025, Nature, 641, 1132, doi:10.1038/s41586-025-08968-2
2012 doi
-
[65]
2024, ApJS, 274, 8, doi:10
Yamada, S., Kawamuro, T., Mizumoto, M., et al. 2024, ApJS, 274, 8, doi:10. 3847/1538-4365/ad5961 Article number, page 12 of 14 A. Luminari et al.: Time-evolving Diagnostic of the Ionized Absorbers in NGC 4051. II. Appendix A: Fit of the time-averaged spectra We fit the time-av...
2024
Reviewed August 1, 2026 · model on record in the stance chip above.
Discussion (0). Continue with ORCID to comment.