REVIEW 6 major objections 5 minor 12 references
Progress in the Development of Multi-Element Monolithic Germanium Detectors in LEAPS-INNOV Project: Insights from Detector Performance Simulation
T0 review · 6 major / 5 minor · reviewed 2026-08-16 · deepseek-v4-flash
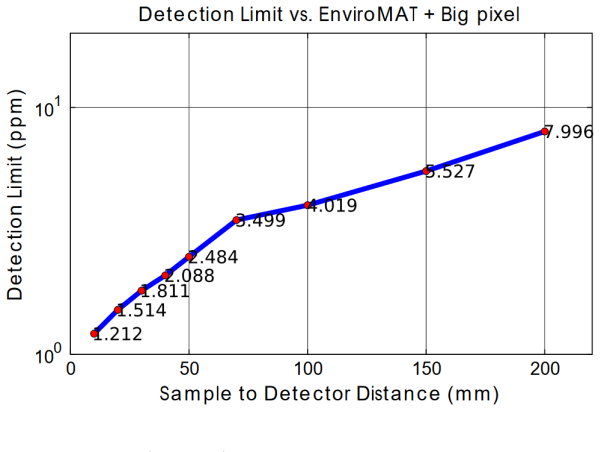
Pith's one-line read This simulation study predicts that a multi-element monolithic germanium detector can detect cadmium in soil at concentrations as low as 1.21 ppm when placed 10 mm from the sample, with the detection limit rising to about 7.99 ppm at 200…
desk verdict A plausible but unvalidated simulation parameter scan whose qualitative distance/flux trends are physically expected; the quantitative detection limits are provisional until the simulation chain is benchmarked against experiment. read the letter →
The pith
A machine-rendered reading of the paper's core claim, the machinery that carries it, and where it could break.
The reading
What carries the argument
The argument runs on a coupled detector-response simulation chain. A particle-transport Monte Carlo step generates the coordinates and deposited energies of X-ray interactions in the germanium sensor; a solid-state detector simulation then computes the electric field, charge drift and diffusion, weighting potentials, and electrode pulses through the Shockley–Ramo theorem, and adds realistic electronic noise. The load-bearing identity is the detection-limit formula $\mathrm{DL} = 3\,C\,\sqrt{N_{\mathrm{bkgd}}}/(\mathrm{OCR}_{\mathrm{sig}}\,T_{\mathrm{exp}})$, which converts the simulated background count and output count rate into a minimum detectable concentration in ppm. The simulation inputs include a bias voltage near 200 V, an impurity density near $10^{10}\,\mathrm{cm^{-3}}$, a 3 mm tungsten collimator, and experimental baseline noise.
What would settle it
Run the real big-pixel prototype on the same EnviroMAT cadmium soil at 30 keV and a flux of $3.47\times10^{10}$ ph/s, measuring the detection limit at 10, 50, 100, and 200 mm; if the measured limits do not follow the predicted trend from roughly 1.2 to 8 ppm within statistical uncertainty, the simulation chain's predictive claim is not supported.
Extended reading notes
Core claim
The central claim is that the big-pixel configuration of the monolithic germanium detector can reach a cadmium detection limit in EnviroMAT soil of approximately 1.21 ppm at a sample-to-detector distance of 10 mm, rising to 2.48 ppm at 50 mm, 4.02 ppm at 100 mm, and 7.99 ppm at 200 mm, at 30 keV and a photon flux of $3.47\times10^{10}$ ph/s. The paper attributes the distance effect to X-ray attenuation in air and to increased noise susceptibility at larger distances, and it shows that the detection limit improves monotonically as the incident flux is increased from $10^7$ to $10^{12}$ ph/s. These values come from the detection-limit formula $\mathrm{DL} = 3\,C\,\sqrt{N_{\mathrm{bkgd}}}/(\mathrm{OCR}_{\mathrm{sig}}\,T_{\mathrm{exp}})$ applied to the simulated Cd K-$\alpha$ region of interest (22.5–24 keV) of a soil spectrum. The paper presents these numbers as simulation predictions and states that validation with the first prototype is planned.
Load-bearing premise
The entire set of predicted detection limits rests on the assumption that the simulated detector response, with its assumed bias voltage, impurity density, collimator, and electronic baselines, faithfully matches what the real prototype will measure.
Editorial extensions
If this is right
- Placing the detector at 10 mm instead of 200 mm improves the predicted cadmium detection limit from 7.99 ppm to 1.21 ppm, so close geometry is the main practical lever for trace sensitivity.
- Detection limit improves as photon flux rises from $10^7$ to $10^{12}$ ph/s, meaning brighter beams and longer exposure times lower the minimum detectable concentration.
- The simulation chain assigns the distance penalty largely to air attenuation and noise, implying that a shorter air path or a vacuum/helium gap would preserve sensitivity at larger working distances.
- The 50 mm distance was selected as an operating point for the flux study, balancing the need for sensitivity against the geometric constraints of real beamlines.
Reading between the lines
- If the chain is validated, the same simulation recipe could be reused for other pollutant elements and other soil or water matrices by changing the target composition and energy region of interest, without new hardware.
- The paper's distance trend suggests a testable prediction: removing air from the simulated path should flatten or eliminate the rise in detection limit with distance, isolating the noise contribution.
- Because the conclusions are drawn for the 20 mm² big-pixel geometry, the smaller 5 mm² XAFS pixels may show a different distance-flux tradeoff; that comparison is not made here.
- The quantitative ppm values should be read as design predictions pending the prototype experiment, since no measured detector response is yet presented.
Signed reviews
Editorial analysis
A structured set of objections, weighed in public.
Referee Report
Summary. This manuscript reports a simulation study of a multi-element monolithic germanium detector for detecting cadmium traces in EnviroMAT soil, using a Geant4 model of the detector, a tungsten collimator, and the sample, followed by charge-transport and pulse reconstruction with SolidStateDetectors.jl. For the big-pixel geometry, the authors compute the Cd detection limit as a function of sample-to-detector distance (10–200 mm) at a fixed 30 keV beam flux of 3.47e10 ph/s, and as a function of incident flux at a reference distance. They report that the detection limit degrades from about 1.21 ppm at 10 mm to about 7.99 ppm at 200 mm, and improves with increasing flux. Experimental validation is explicitly deferred to future work (Section 6).
Significance. If the simulation chain is reliable, the results provide useful, design-relevant guidance for the LEAPS-INNOV monolithic Ge detector program and for synchrotron XRF experimental geometry optimization. Strengths of the paper include the use of a realistic beam flux measured at the SAMBA beamline, a reasonably detailed Geant4 geometry with a tungsten collimator, and a full charge-transport treatment via SSD.jl rather than a simple efficiency tabulation. The main limitations are that the central quantitative claims rest on a simulation chain that is not yet benchmarked against experiment, that Eq. (1) is malformed and Eq. (2) leaves key quantities underspecified, and that one of the paper's explanatory claims (air attenuation) is not supported by the simulation setup as described. The numerical detection-limit values should therefore be regarded as predictions until the code is validated and the equations are corrected.
major comments (6)
- [§4, Eq. (1)] Equation (1) is malformed as printed: the square-root symbol is followed by a product of N_Pixels, ICR_Pixel, (1−DT/100), S/B, S/T, and T_exp without parentheses indicating which terms are under the radical, and the expression is dimensionally inconsistent with Eq. (2). Since the text states that Eq. (1) is the basis for evaluating the detection limit, the numerical values in Figs. 4 and 5 cannot be reproduced from the paper as written; please rewrite the equation and define every symbol in the expression.
- [§4, Eq. (2)] The symbol N_Bckgd is listed as a 'background count rate,' but in Eq. (2) it appears to be used as a count (or count rate) entering a detection-limit formula, and the paper does not specify whether it is the raw count in the Cd Kα region of interest (22.5–24 keV), a net count after continuum subtraction, or a background rate. The continuum-subtraction method is not described, so the reported DL values (1.21–7.99 ppm) cannot be independently checked or reproduced from the paper alone.
- [§5] The distance dependence of the detection limit is attributed to 'attenuation of X-rays in air and increased susceptibility to noise at larger distances,' but the Geant4 setup described in §3 includes only the detector, the tungsten collimator, and the sample; no air gap is listed. If air is not included in the simulation, the claimed dominant physical cause is absent and the trend must instead arise mainly from solid-angle changes and the noise model; if air is included, that must be stated explicitly in §3.
- [§6] The conclusion states that 'we used the optimal 50 mm sample-to-detector distance,' but Fig. 4 shows the detection limit monotonically decreasing with distance, with 10 mm (1.21 ppm) giving a better detection limit than 50 mm (2.48 ppm). This is a direct contradiction; the optimal-distance claim should be revised, or an unstated constraint (e.g., a practical minimum working distance) should be introduced and justified.
- [§1 and §6] The introduction refers to the 'validated full simulation chain,' but Section 6 states that validation with experimental data is scheduled for the future, and no experimental spectrum, measured noise baseline, or comparison with measured detector response is presented. Because the headline detection-limit values depend entirely on the simulated signal and background, the paper should consistently label the results as unvalidated simulation predictions and should clearly report which inputs (e.g., baseline noise, flux) are measured rather than assumed.
- [Figs. 4 and 5] No statistical uncertainties are shown for any detection-limit point, despite the use of finite Monte Carlo statistics and a noise baseline. The paper quotes values to three significant figures (e.g., 1.21 ppm vs. 2.48 ppm at 10 mm and 50 mm), but without error bars the reader cannot judge whether the reported differences are significant or whether the trend in Fig. 4 is robust to statistical fluctuations.
minor comments (5)
- [§4, bullet list] The bullet list defines S/B as 'signal-to-noise or signal-to-background ratio,' which is ambiguous; choose one definition and use it consistently throughout, and define S/T precisely as the fraction of signal counts inside the full-energy peak relative to the total spectrum.
- [§4, text before Eq. (1)] The detection limit is described as being at 90% confidence level, but the factor 3 in Eq. (2) corresponds to three standard deviations (approximately 99.7% for a Gaussian distribution). Please clarify how the factor 3 relates to the stated confidence level.
- [§4 and elsewhere] Capitalization of the sample name is inconsistent: 'ENviroMAT' appears in Section 4 while 'EnviroMAT' is used elsewhere; standardize the spelling.
- [Fig. 5] The left panel's vertical axis label ('signal-to-noise ratio') appears only in the caption, and the right panel's axes (photon flux and detection limit) are not labeled inside the figure; add axis labels directly to the figure panels.
- [References] Reference [10] is incomplete as given (missing the full journal or conference publication details); please supply the complete citation.
Circularity Check
No significant circularity: detection limits are direct simulation outputs through a standard formula, not fitted to the target results.
full rationale
The central claim (DL ≈ 1.21–7.99 ppm for Cd in EnviroMAT with distance) is computed from simulated signal and background counts inserted into Eq. (2), DL = 3*C*NBckgd/sqrt(OCR_sig*Texp). No parameter of that formula is fit to the reported DL values; rather, the signal and background counts are produced by a Geant4 + SSD.jl simulation chain with stated inputs (30 keV, 3.47e10 ph/s, 200 V bias, ~1e10 cm^-3 impurity, 3 mm W collimator, 1 s exposure). The distance and flux trends are consequences of the simulated count rates, not of an input quantity that already contains those trends. The paper cites prior collaboration work for the simulation chain (Refs. [3] and [9]), but it does not invoke those citations to define the DL values or to forbid alternative explanations. The main weakness is validation: Section 6 explicitly says validation against experimental data is anticipated to be scheduled shortly, so the quantitative DL values are unverified predictions. That is a correctness and reproducibility risk, not circularity. Also, Eq. (1) as printed is malformed and the extraction of NBckgd is incompletely specified, which impedes reproduction, but these are presentation gaps rather than circular reductions.
Assumptions & free parameters
free parameters (5)
- Bias voltage =
~200 V
- Impurity density =
~1e10 cm^-3
- Dead time (DT) =
not specified
- Cd test concentration =
100 ppm
- Exposure time =
1 s
assumptions (4)
- domain assumption Geant4 and SSD.jl accurately model the physical response of the monolithic Ge detector.
- domain assumption The background measured from a sample without Cd is an appropriate proxy for the matrix background in the Cd RoI.
- standard math Counting statistics follow a Gaussian approximation such that DL = 3*C*sqrt(N_Bckgd)/(OCR_sig*Texp) gives a 90% C.L. limit.
- domain assumption The simulation includes (or does not need) air attenuation between sample and detector.
Cite this review
Pith. "Pith review of Progress in the Development of Multi-Element Monolithic Germanium Detectors in LEAPS-INNOV Project: Insights from Detector Performance Simulation." pith.science (2026). https://pith.science/paper/UL46WUP7
@misc{pith2026250414652,
  author       = {Pith},
  title        = {Pith review of: Progress in the Development of Multi-Element Monolithic Germanium Detectors in LEAPS-INNOV Project: Insights from Detector Performance Simulation},
  year         = {2026},
  howpublished = {\url{https://pith.science/paper/UL46WUP7}},
  note         = {Machine review of arXiv:2504.14652}
}
read the original abstract
This study presents a detailed simulation-based analysis of the detection limits of multi-element monolithic Germanium (Ge) detectors to cadmium traces in environmental soil samples. Using the capabilities of the Geant4 Monte Carlo toolkit in combination with the Solid State Detector Package, we evaluated the detection limit variation with the sample-to-detector distances and photon flux. These simulations were conducted to mimic realistic conditions, with a photon flux measured by the SAMBA beamline at the SOLEIL synchrotron facility. Our findings for the detection limit for trace amounts of pollutants in low concentrations like cadmium in the soil provide valuable insights for optimizing experimental setups in environmental monitoring and synchrotron-based applications, where precise detection of trace elements is critical.
Figures


Figures from the paper (2 more)

Reference graph
Works this paper leans on
-
[3]
F. Orsini et al., Xafs-det: A new high throughout x-ray spectroscopy detector system developed for synchrotron applications, https://doi.org/10.1016/j.nima.2022.167600 Nuclear Instruments and Methods in Physics Research, Section A: Accelerators, Spectrometers, Detectors and Associated Equipment 1045 (2023)
arXiv 2023
-
[9]
L. Bombelli, C. Fiorini, T. Frizzi, R. Alberti and A. Longoni, "CUBE", A low-noise CMOS preamplifier as alternative to JFET front-end for high-count rate spectroscopy , 2011 IEEE Nuclear Science Symposium Conference Record (2011) 1972 https://doi.org/10.1109/NSSMIC.2011.6154396
arXiv 2011
-
[1]
write newline
" write newline "" before.all 'output.state := FUNCTION blank.sep after.quote 'output.state := FUNCTION fin.entry output.state after.quoted.block = 'skip 'add.period if write newline FUNCTION new.block output.state before.all = 'skip output.state after.quote = after.quoted.block 'output.state := after.block 'output.state := if if FUNCTION new.sentence out...
-
[2]
N. Tartoni, S. Chatterji, R. Crook, T. Krings, L. Bombelli and A. Alborini, Hexagonal pad multichannel ge x-ray spectroscopy detector demonstrator: Comprehensive characterization, https://doi.org/10.1109/TNS.2020.3004923 IEEE Transactions on Nuclear Science 67 (2020) 1952
arXiv 2020
-
[4]
F. Iguaz, T. Saleem, E. Fonda, G. Landrot, L. Manzanillas and F. Orsini, Detection limit of next-generation of multi-element germanium detectors in the context of environmental science, https://doi.org/10.1088/1742-6596/2380/1/012096 Journal of Physics: Conference Series 2380 (2022) 012096
-
[5]
S. Agostinelli, J. Allison, K. Amako, J. Apostolakis, H. Araujo, P. Arce et al., Geant4—a simulation toolkit, https://doi.org/https://doi.org/10.1016/S0168-9002(03)01368-8 Nuclear Instruments and Methods in Physics Research Section A: Accelerators, Spectrometers, Detectors and Associated Equipment 506 (2003) 250
-
[6]
I. Abt et al., Simulation of semiconductor detectors in 3d with solidstatedetectors.jl, https://doi.org/10.1088/1748-0221/16/08/P08007 Journal of Instrumentation 16 (2021) P08007
- [7]
Show all 12 references
-
[8]
XGLab Milan , ``Xglab - innovative solutions for x and gamma rays.'' https://www.xglab.it
-
[10]
L. Manzanillas et al., Development of multi-element monolithic germanium detectors for x-ray detection at synchrotron facilities, https://doi.org/10.1016/j.nima.2022.167904 Nuclear Instruments and Methods in Physics Research, Section A: Accelerators, Spectrometers, Detectors a...
2023
-
[11]
Bezanson, S
J. Bezanson, S. Karpinski, V.B. Shah and A. Edelman, Julia: A fast dynamic language for technical computing, 2012
2012
-
[12]
EnviroMAT sample , ``Enviromat ss-1 soil sample.'' https://www.scpscience.com/en/products/details&id=140-025-001&name=enviromat-ss-1-soil-standard100g
Reviewed August 16, 2026 · model on record in the stance chip above.
Discussion (0). Continue with ORCID to comment.