REVIEW 4 major objections 6 minor 73 references
A Wide Field Map of Ultra-Compact Dwarfs in the Coma Cluster
T0 review · 4 major / 6 minor · reviewed 2026-08-07 · deepseek-v4-flash
Pith's one-line read Coma's ultra-compact dwarf population exceeds the globular cluster luminosity function prediction, with at least 32 objects that cannot be explained as massive globular clusters.
desk verdict Useful new UCD catalog for Coma, but the bright-end excess and N_UCD>=32 are not yet supported because candidate purity is unquantified. read the letter →
The pith
A machine-rendered reading of the paper's core claim, the machinery that carries it, and where it could break.
The reading
What carries the argument
The engine of the argument is the comparison between the observed luminosity function and a Gaussian GCLF with fixed turnover $M_V=-7.4$ and fitted $\sigma=1.562\pm0.013$; the difference between the observed counts and the integrated Gaussian in the UCD magnitude range is the quantity from which the non-GC population is estimated. Supporting machinery includes the color-magnitude Gaussian mixture model fits that trace the blue tilt into the UCD regime, the Sersic radial-profile fits and the $8R_e$ threshold used to define intracluster objects, and the kernel-density and two-point correlation clustering estimates around the main galaxies. The catalog itself, built from 26 ACS pointings with visual inspection and photometric and morphological cuts, is the empirical foundation that makes the bright-end excess measurable.
What would settle it
A spectroscopic survey that obtains redshifts for all 523 UCD candidates would settle the matter: if the number of confirmed Coma members with $F814W<21$ does not significantly exceed the Gaussian prediction of $3.1\pm0.3$, the claimed excess evaporates. Alternatively, an independent measurement of the GCLF turnover and width from deep, complete imaging of a different Coma field, or from spectroscopically confirmed globular clusters alone, that reproduces the observed bright tail would falsify the bimodal interpretation.
Extended reading notes
Core claim
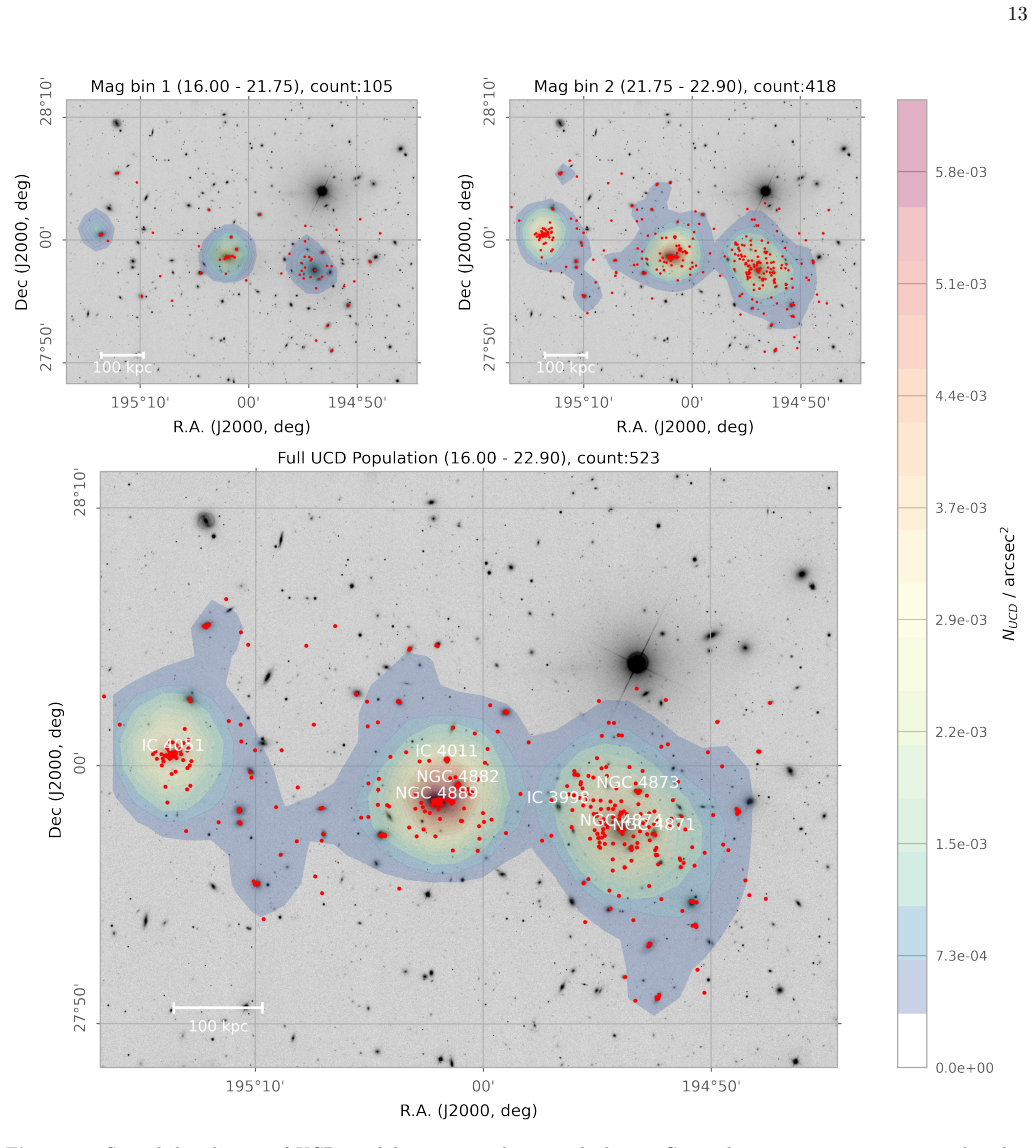
The paper's central claim is that the luminosity function of compact stellar systems in Coma departs from a single-Gaussian globular cluster luminosity function (GCLF) at the bright end. With the GCLF turnover fixed at $M_V=-7.4$, corresponding to $F814W\approx26.6$ at the adopted 100 Mpc distance, and the width fitted to the bright side of the same data ($\sigma=1.562\pm0.013$), the Gaussian predicts $187.4\pm7.3$ UCD candidates at $F814W<22.9$ where 523 are observed; the residual grows toward brighter magnitudes, reaching a prediction of $3.1\pm0.3$ at $F814W<21$ against 35 observed, at the threshold tied to the $5\times10^7\,M_\odot$ star-cluster formation limit. Treating the residual as a second population, the paper estimates $N_{\rm UCD}\gtrsim32\pm1$ UCDs formed through a non-GC channel, and about $252\pm6$ (66%) of UCDs above $10^7\,M_\odot$. The paper also maps where these objects live: UCDs are more centrally concentrated than GCs around NGC 4874, NGC 4889, and IC 4051, only about 14% (versus 24% for GCs) lie beyond $8R_e$ of the nearest host galaxy, and red UCDs cluster near galaxy centers while blue UCDs are more dispersed.
Load-bearing premise
The excess population of non-globular-cluster UCDs depends on assuming that Coma's globular cluster luminosity function is a single Gaussian with turnover $M_V=-7.4$ and width $\sigma=1.562$ fitted over $22.0<F814W<25.0$, and that this Gaussian remains valid when extrapolated to brighter UCD magnitudes; if the true GCLF is asymmetric, has a different turnover, or the bright-end completeness is below the assumed 90%, the predicted counts shift and the excess could shrink or disappear.
Editorial extensions
If this is right
- The bright UCD population in Coma is a composite: roughly 66% of UCDs above $10^7\,M_\odot$, and at least 32 objects above the $5\times10^7\,M_\odot$ formation limit, are not the high-mass tail of the globular cluster mass function.
- Coma's core contains about $69{,}400\pm1{,}400$ compact stellar systems, providing a census against which models of globular cluster destruction and tidal stripping can be tested.
- UCDs trace the gravitational influence of the three giant ellipticals more sharply than globular clusters do, and IC 4051 hosts a UCD population comparable to the two brightest cluster galaxies despite having fewer globular clusters.
- The lower intracluster fraction of UCDs (about 14% versus 24% for globular clusters) implies UCDs either form close to their hosts or resist tidal scattering better than globular clusters.
- The blue tilt continues into the UCD regime, connecting the mass-metallicity behavior of UCDs to the self-enrichment process seen in massive globular clusters.
Reading between the lines
- If the non-GC UCDs are indeed stripped dwarf nuclei, many may retain central black holes, and the Coma sample then implies an abundant population of intermediate-mass black holes that future velocity-dispersion measurements could directly test.
- The 14% intracluster fraction depends on the arbitrary $8R_e$ threshold; a membership definition based on escape speed or tidal radius could give a different value and should be checked before drawing strong conclusions about UCDs versus globular clusters as dark-matter tracers.
- The same Gaussian-extrapolation test could be applied to other HST/ACS cluster surveys; the outcome will hinge on measuring the GCLF turnover independently rather than adopting $M_V=-7.4$, so a turnover measured from spectroscopy would sharpen or refute the excess.
- Planned JWST NIRISS parallel observations of Coma in mid-2025 could spectroscopically confirm a subset of these candidates; if the confirmed members reproduce the bright excess, the bimodal formation scenario would move from photometric suggestion to an established population.
Editorial analysis
A structured set of objections, weighed in public.
Referee Report
Summary. The paper uses 26 HST/ACS pointings to build a catalog of 23,351 compact stellar systems in the core of the Coma cluster, from which 523 UCD candidates are selected by magnitude (F814W < 22.9) and color (1.3 < F475W-F814W < 2.1). The authors analyze the color-magnitude diagram, the luminosity function, and the radial and color distribution of the candidates. Their central claims are that the UCD luminosity function shows a significant bright-end excess over a Gaussian globular cluster luminosity function, implying that at least N_UCD = 32 +/- 1 UCDs formed through a channel distinct from GC growth, and that the total CSS population in the surveyed region is N_CSS ~ 69,400 +/- 1,400. The paper also reports that UCDs are more centrally concentrated than GCs around the three dominant ellipticals, that IC 4051 hosts a substantial UCD population, and that only ~14% of UCDs are intracluster compared to ~24% of GCs.
Significance. If the bright-end excess and the derived N_UCD >= 32 are correct, the paper would provide strong evidence for multiple UCD formation pathways in a rich cluster, complementing similar results in Fornax and Virgo. The catalog itself is a valuable resource for studies of star cluster systems in Coma, and the wide-field map of UCD candidates, the radial profiles around NGC 4874, NGC 4889, and IC 4051, and the blue/red spatial segregation analysis are useful contributions regardless of the luminosity-function interpretation. The authors also demonstrate a blue tilt consistent with previous work and make a quantitative prediction for the total CSS population. However, the central claim is currently not robust because it rests on photometric candidates with no contamination budget, on a Gaussian fit whose 'predicted' counts are extrapolations from the same dataset, and on a bright magnitude bin that includes objects far brighter than the stated UCD definition.
major comments (4)
- [Section 4, Table 2] The 'predicted' UCD counts are not independent predictions. The Gaussian is fitted over 22.0 < F814W < 25.0, which includes sources brighter than the F814W = 22.9 UCD threshold adopted in Section 2, so the fitted dispersion sigma = 1.562 +/- 0.013 is partly constrained by the very UCD population whose excess is later quantified. The excess values in Table 2 are therefore residuals of a self-fit. Please refit the Gaussian using only magnitudes fainter than the UCD cutoff (e.g., 22.9-25.0), or with a non-Gaussian or asymmetric GCLF model, and demonstrate that a statistically significant excess remains. In addition, propagate the uncertainties in both sigma and the fixed turnover (mu = 26.6 +/- 0.1) into the excess numbers, as the quoted errors in Table 2 do not appear to include these sources of uncertainty.
- [Section 2, Table 2] The 523 UCD candidates are photometric selections, and only five have spectroscopic confirmation (Section 2). No contamination budget is presented for foreground stars or background compact galaxies. This is load-bearing for the central claim because Table 2 derives the N_UCD >= 32 +/- 1 result from 35 objects with F814W < 21.0 (M_F814W < -14); even a small interloper fraction among those 35 objects would erase the claimed excess. Please provide a quantitative contamination estimate, for example from Galactic stellar population models, deep galaxy number counts, a control field, or the existing Keck spectroscopic sample, and show how the excess changes after removing the estimated contaminants.
- [Section 5.4, Table 7, Figure 9] The 'bright' UCD bin is defined as 16.0 < F814W < 21.75 mag. With the adopted distance modulus (m-M) = 35.0, the bright end of this bin corresponds to M_F814W ~ -19, more than 8 magnitudes brighter than the UCD definition M_V <= -11 used throughout the paper. Objects this bright cannot be genuine UCDs under the paper's own selection criteria. Either the magnitude range is mislabeled, or the sample contains a substantial number of foreground stars or background galaxies, which would also call into question the purity of the broader candidate list. This issue directly affects the claim that the brightest UCDs cluster around NGC 4889 (38% within 8Re) and the counts in Table 7, and it must be resolved before those results can be interpreted.
- [Section 4] The Gaussian fit range 22.0 < F814W < 25.0 is justified by the statement that completeness is 'estimated to be acceptable (i.e., ≳90%)', but no method or reference is given for this estimate. The amplitude of the fitted Gaussian and the integrated total N_CSS ~ 69,400 +/- 1,400 both depend on the completeness-corrected counts. Please either present a completeness function (e.g., from artificial star tests) or cite the specific section of Madrid et al. (2018) that establishes this value, and discuss how a lower completeness at the faint end of the fit range would change the fitted dispersion and the extrapolated bright-end predictions.
minor comments (6)
- [Section 4, Figure 4] The inset shows 'sigma +/- 0.1' solutions, but the reported uncertainty of sigma is 0.013; please clarify whether the dashed lines show a plausible variation or the formal uncertainty, and whether the conclusion is insensitive to this range.
- [Section 4, Table 2] The mass estimates in column 2 are given without uncertainties, and the mapping to the Norris et al. (2019) star cluster formation limit depends on an assumed mass-to-light ratio of 3.25; please state the sensitivity of the inferred fractions (66%, N_UCD >= 32) to this assumption.
- [Section 5.3] The 8Re threshold for 'intracluster' objects is reasonable but arbitrary; Table 5 shows the fractions at other multiples, and the conclusions should explicitly note that the 14% versus 24% comparison depends on this chosen threshold.
- [Section 5.5, Figure 10] The blue-red split uses threshold colors 1.71 and 1.63 from the GMM intersections, but the figure caption for Figure 10 uses a single value (F475W-F814W) ≈ 1.71; please ensure the description is consistent and states that the threshold is magnitude-dependent as in the text.
- [Abstract and Section 4] The inequality for the number of distinct-origin UCDs appears as 'N_UCD >= 32' in the abstract and as 'N_UCD ≳ 32' in the text; please standardize the notation.
- [Section 2] The paper would benefit from a brief statement about the public availability of the CSS catalog, since a dataset of this size is a valuable community resource if released.
Circularity Check
Table 2's 'predicted' counts for the brighter rows are residuals of a Gaussian fitted to the same data, but the headline N_UCD>=32 rests on the extrapolated F814W<21.0 bin and retains independent content.
-
fitted input called prediction
[Section 4, text after Fig. 4 and Table 2]
"To determine the excess over the Gaussian model fitted to the bright side of our data, we integrate the area under the curve to find the predicted numbers, and subtract this from the observed data in the same range."
The Gaussian model used for the 'Pred' counts in Table 2 has its sigma (1.562 +/- 0.013) fitted with emcee to the same dataset over 22.0 < F814W < 25.0. For the first three rows of Table 2 (F814W < 22.9, < 22.7, < 22.0), the integration range overlaps the fitting range, so the observed counts being compared were themselves used to determine the model. The resulting 'excess' is therefore the residual of a self-fit rather than a prediction from independently calibrated parameters. The row that supports the central N_UCD >= 32 estimate (F814W < 21.0) lies outside the fitted range and is an extrapolation, so that claim is not forced by the self-fit, though it does inherit the Gaussian-shape assumption.
full rationale
The paper's central quantitative claim, N_UCD >= 32 +/- 1, is derived from the F814W < 21.0 row of Table 2, where the observed count (35) is compared with a Gaussian extrapolation (3.1 +/- 0.3) from a model fitted at 22.0 < F814W < 25.0. That specific comparison is not circular: the target bin is outside the fitted range. However, the paper also presents the bright-end excess as a general result and uses the F814W < 22.7 row (inside the fitted range) to estimate that 66% of UCDs above 10^7 Msun formed through a distinct process; those 'Pred' counts are integrals of a curve fitted to the same data being compared, so they are self-fit residuals rather than independent predictions. The turnover magnitude is taken from external literature (M_V = -7.4), which provides an external anchor, and the catalog itself is observational data, not a derived claim. No load-bearing self-citation or uniqueness-importation pattern is present. The circularity is limited to the presentation of fitted-model residuals as 'predictions' in part of Table 2; the headline number survives, but its model dependence and candidate-purity assumptions remain separate concerns.
Assumptions & free parameters
free parameters (6)
- GCLF sigma =
1.562 +/- 0.013 mag
- UCD magnitude threshold =
F814W < 22.9 mag
- UCD color selection window =
1.3 < (F475W-F814W) < 2.1
- Blue-red color split thresholds =
1.71 mag (bright UCDs) and 1.63 mag (dimmer UCDs)
- Intracluster threshold 8Re =
8 x R_e
- KDE bandwidth =
0.3
assumptions (7)
- domain assumption Globular cluster luminosity function is a single Gaussian with turnover MV = -7.4
- domain assumption Coma distance is 100 Mpc, (m-M) = 35.0 mag
- domain assumption V-I color offset of about 1.0 to 1.1 mag
- domain assumption Mass-to-light ratio of 3.25 for old, metal-poor Salpeter population
- domain assumption CSS color distribution is a mixture of two Gaussian components
- domain assumption Cluster membership defined by 0.015 < z < 0.032 and a visual catalog
- ad hoc to paper Objects outside 8Re are treated as intracluster
Cite this review
Pith. "Pith review of A Wide Field Map of Ultra-Compact Dwarfs in the Coma Cluster." pith.science (2026). https://pith.science/paper/UX2OZ5UO
@misc{pith2026250602296,
  author       = {Pith},
  title        = {Pith review of: A Wide Field Map of Ultra-Compact Dwarfs in the Coma Cluster},
  year         = {2026},
  howpublished = {\url{https://pith.science/paper/UX2OZ5UO}},
  note         = {Machine review of arXiv:2506.02296}
}
abstract
A dataset of 23,351 globular clusters (GCs) and ultra-compact dwarfs (UCDs) in the Coma cluster of galaxies was built using Hubble Space Telescope Advanced Camera for Surveys data. Based on the standard magnitude cut of $M_V \leq -11$, a total of 523 UCD candidates are found within this dataset of Compact Stellar Systems (CSS). From a color-magnitude diagram (CMD) analysis built using this catalog, we find a clear mass-magnitude relation extending marginally into the UCD parameter space. The luminosity function defined by this dataset, shows an excess of sources at bright magnitudes, suggesting a bimodal formation scenario for UCDs. We estimate the number of UCDs with a different origin than GC to be $N_{UCD} \geq 32 \pm 1$. We derive the total number of CSS within the core (1 Mpc) of Coma to be $N_{CSS} \approx 69,400 \pm 1400$. The radial distribution of UCDs in Coma shows that, like GCs, UCDs agglomerate around three giant ellipticals: NGC 4874, NGC 4889, and IC 4051. We find UCDs are more centrally concentrated around these three ellipticals than GCs. IC 4051 has a satellite population of UCDs similar to NGC 4874 and NGC 4889. We estimate only ~14% of UCDs, inhabit the intracluster space (ICUCD) between galaxies in the region, in comparison to ~24% for GCs (ICGC). We find red (metal-rich) UCDs are more likely located closer to a host galaxy, with blue (metal-poor) UCDs showing a greater dispersion and lower average density in the region.
Figures


Figures from the paper (8 more)




Reference graph
Works this paper leans on
-
[1]
2009, A&A, 507, 1225, doi: 10.1051/0004-6361/200912228
Adami, C., Le Brun, V., Biviano, A., et al. 2009, A&A, 507, 1225, doi: 10.1051/0004-6361/200912228
-
[2]
Adelman-McCarthy, J. K., Ag¨ ueros, M. A., Allam, S. S., et al. 2008, ApJS, 175, 297, doi: 10.1086/524984
doi:10.1086/524984 2008
-
[3]
Afanasiev, A. V., Chilingarian, I. V., Mieske, S., et al. 2018, MNRAS, 477, 4856, doi: 10.1093/mnras/sty913
-
[4]
Ahn, C. P., Seth, A. C., den Brok, M., et al. 2017, ApJ, 839, 72, doi: 10.3847/1538-4357/aa6972
-
[5]
Ahn, C. P., Seth, A. C., Cappellari, M., et al. 2018, ApJ, 858, 102, doi: 10.3847/1538-4357/aabc57 Alamo-Mart ´ ınez, K. A., & Blakeslee, J. P. 2017, ApJ, 849, 6, doi: 10.3847/1538-4357/aa8f44
-
[6]
Bailin, J., & Harris, W. E. 2009, ApJ, 695, 1082, doi: 10.1088/0004-637X/695/2/1082
-
[7]
Bekki, K., Couch, W. J., & Drinkwater, M. J. 2001, ApJL, 552, L105, doi: 10.1086/320339
doi:10.1086/320339 2001
-
[8]
Bekki, K., Forbes, D. A., Beasley, M. A., & Couch, W. J. 2002, MNRAS, 335, 1176, doi: 10.1046/j.1365-8711.2002.05708.x
arXiv 2002
Show all 73 references
-
[9]
2006, A&A, 450, 105, doi: 10.1051/0004-6361:20054351
Bica, E., Bonatto, C., Barbuy, B., & Ortolani, S. 2006, A&A, 450, 105, doi: 10.1051/0004-6361:20054351
2006 doi
-
[10]
P., & Barber DeGraaff, R
Blakeslee, J. P., & Barber DeGraaff, R. 2008, AJ, 136, 2295, doi: 10.1088/0004-6256/136/6/2295 Br¨ uns, R. C., & Kroupa, P. 2012, A&A, 547, A65, doi: 10.1051/0004-6361/201219693
2008 doi
-
[11]
2008, ApJS, 176, 424, doi: 10.1086/533439
Carter, D., Goudfrooij, P., Mobasher, B., et al. 2008, ApJS, 176, 424, doi: 10.1086/533439
2008 doi
-
[12]
P., Bassino, L
Caso, J. P., Bassino, L. P., Richtler, T., Calder´ on, J. P., & Smith Castelli, A. V. 2014, MNRAS, 442, 891, doi: 10.1093/mnras/stu876
2014 doi
-
[13]
B., Marzke, R
Chiboucas, K., Tully, R. B., Marzke, R. O., et al. 2011, ApJ, 737, 86, doi: 10.1088/0004-637X/737/2/86
2011 doi
-
[14]
V., & Mamon, G
Chilingarian, I. V., & Mamon, G. A. 2008, MNRAS, 385, L83, doi: 10.1111/j.1745-3933.2008.00438.x Da Rocha, C., Mieske, S., Georgiev, I. Y., et al. 2011, A&A, 525, A86, doi: 10.1051/0004-6361/201015353
2008
-
[15]
E., Sales, L
Doppel, J. E., Sales, L. V., Navarro, J. F., et al. 2021, MNRAS, 502, 1661, doi: 10.1093/mnras/staa3915
2021 doi
-
[16]
J., Jones, J
Drinkwater, M. J., Jones, J. B., Gregg, M. D., & Phillipps, S. 2000, PASA, 17, 227, doi: 10.1071/AS00034
2000 doi
-
[17]
2023, ApJ, 955, 46, doi: 10.3847/1538-4357/acefbc
Gomez, S., & Gezari, S. 2023, ApJ, 955, 46, doi: 10.3847/1538-4357/acefbc
2023 doi
-
[18]
2018, MNRAS, 478, 3564, doi: 10.1093/mnras/sty1187 Ha¸ segan, M., Jord´ an, A., Cˆ ot´ e, P., et al
Goodman, M., & Bekki, K. 2018, MNRAS, 478, 3564, doi: 10.1093/mnras/sty1187 Ha¸ segan, M., Jord´ an, A., Cˆ ot´ e, P., et al. 2005, ApJ, 627, 203, doi: 10.1086/430342
2018 doi
-
[19]
Harris, W. E. 1991, ARA&A, 29, 543, doi: 10.1146/annurev.aa.29.090191.002551 —. 2009, ApJ, 703, 939, doi: 10.1088/0004-637X/703/1/939
1991
-
[20]
E., Harris, G
Harris, W. E., Harris, G. L. H., & Alessi, M. 2013, ApJ, 772, 82, doi: 10.1088/0004-637X/772/2/82
2013 doi
-
[21]
E., Whitmore, B
Harris, W. E., Whitmore, B. C., Karakla, D., et al. 2006, ApJ, 636, 90, doi: 10.1086/498058
2006 doi
-
[22]
E., Brown, R
Harris, W. E., Brown, R. A., Durrell, P. R., et al. 2020, ApJ, 890, 105, doi: 10.3847/1538-4357/ab6992
2020 doi
-
[23]
Hau, G. K. T., Spitler, L. R., Forbes, D. A., et al. 2009, MNRAS, 394, L97, doi: 10.1111/j.1745-3933.2009.00618.x
2009
- [24]
-
[25]
1999, A&AS, 134, 75, doi: 10.1051/aas:1999434
Richtler, T. 1999, A&AS, 134, 75, doi: 10.1051/aas:1999434
1999 doi
-
[26]
2011, MNRAS, 411, 2439, doi: 10.1111/j.1365-2966.2010.17855.x
Hoyos, C., den Brok, M., Verdoes Kleijn, G., et al. 2011, MNRAS, 411, 2439, doi: 10.1111/j.1365-2966.2010.17855.x
2011
-
[27]
S., Blakeslee, J
Jensen, J., Anand, G. S., Blakeslee, J. P., et al. 2024, The JWST SBF Coma Cluster Survey: Building an Alternative Precision Distance Ladder for Cosmology, JWST Proposal. Cycle 3, ID. #5989 Jord´ an, A., McLaughlin, D. E., Cˆ ot´ e, P., et al. 2006, ApJL, 651, L25, doi: 10.1086/509119
2024 doi
-
[28]
K., & Ammon, K
Jordi, K., Grebel, E. K., & Ammon, K. 2006, A&A, 460, 339, doi: 10.1051/0004-6361:20066082
2006 doi
-
[29]
V., Khrapov, S
Khoperskov, A. V., Khrapov, S. S., & Sirotin, D. S. 2023, Galaxies, 12, 1, doi: 10.3390/galaxies12010001
2023 doi
-
[30]
2006, A&A, 448, 1031, doi: 10.1051/0004-6361:20054384
Kissler-Patig, M., Jord´ an, A., & Bastian, N. 2006, A&A, 448, 1031, doi: 10.1051/0004-6361:20054384
2006 doi
-
[31]
Grillmair, C. J. 2001, AJ, 121, 2974, doi: 10.1086/321081
2001 doi
-
[32]
G., Bae, J
Lee, M. G., Bae, J. H., & Jang, I. S. 2022, ApJL, 940, L19, doi: 10.3847/2041-8213/ac990b
2022 doi
- [33]
-
[34]
W., Cˆ ot´ e, P., et al
Liu, C., Peng, E. W., Cˆ ot´ e, P., et al. 2015, ApJ, 812, 34, doi: 10.1088/0004-637X/812/1/34
2015 doi
-
[35]
W., et al
Liu, C., Cˆ ot´ e, P., Peng, E. W., et al. 2020, ApJS, 250, 17, doi: 10.3847/1538-4365/abad91
2020 doi
-
[36]
Madrid, J. P. 2011, ApJL, 737, L13, doi: 10.1088/2041-8205/737/1/L13
2011 doi
-
[37]
P., & Donzelli, C
Madrid, J. P., & Donzelli, C. J. 2013, ApJ, 770, 158, doi: 10.1088/0004-637X/770/2/158
2013 doi
-
[38]
P., Hurley, J
Madrid, J. P., Hurley, J. R., & Sippel, A. C. 2012, ApJ, 756, 167, doi: 10.1088/0004-637X/756/2/167
2012 doi
-
[39]
P., Leigh, N
Madrid, J. P., Leigh, N. W. C., Hurley, J. R., & Giersz, M. 2017, MNRAS, 470, 1729, doi: 10.1093/mnras/stx1350
2017 doi
-
[40]
P., O’Neill, C
Madrid, J. P., O’Neill, C. R., Gagliano, A. T., & Marvil, J. R. 2018, ApJ, 867, 144, doi: 10.3847/1538-4357/aae206 19
2018 doi
-
[41]
P., Graham, A
Madrid, J. P., Graham, A. W., Harris, W. E., et al. 2010, ApJ, 722, 1707, doi: 10.1088/0004-637X/722/2/1707
2010 doi
-
[42]
H., Haghi, H., et al
Mahani, H., Zonoozi, A. H., Haghi, H., et al. 2021, MNRAS, 502, 5185, doi: 10.1093/mnras/stab330
2021 doi
-
[43]
1998, MNRAS, 300, 872, doi: 10.1046/j.1365-8711.1998.01947.x —
Maraston, C. 1998, MNRAS, 300, 872, doi: 10.1046/j.1365-8711.1998.01947.x —. 2005, MNRAS, 362, 799, doi: 10.1111/j.1365-2966.2005.09270.x
1998
-
[44]
2012, ApJ, 746, 136, doi: 10.1088/0004-637X/746/2/136
Marinova, I., Jogee, S., Weinzirl, T., et al. 2012, ApJ, 746, 136, doi: 10.1088/0004-637X/746/2/136
2012 doi
-
[45]
2002, A&A, 383, 823, doi: 10.1051/0004-6361:20011833
Mieske, S., Hilker, M., & Infante, L. 2002, A&A, 383, 823, doi: 10.1051/0004-6361:20011833
2002 doi
-
[46]
2006, AJ, 131, 2442, doi: 10.1086/500583
Mieske, S., Hilker, M., Infante, L., & Jord´ an, A. 2006, AJ, 131, 2442, doi: 10.1086/500583
2006 doi
-
[47]
2007, A&A, 472, 111, doi: 10.1051/0004-6361:20077631
Kissler-Patig, M. 2007, A&A, 472, 111, doi: 10.1051/0004-6361:20077631
2007 doi
-
[48]
2012, A&A, 537, A3, doi: 10.1051/0004-6361/201117634
Mieske, S., Hilker, M., & Misgeld, I. 2012, A&A, 537, A3, doi: 10.1051/0004-6361/201117634
2012 doi
-
[49]
2004, AJ, 128, 1529, doi: 10.1086/423701
Mieske, S., Infante, L., Ben ´ ıtez, N., et al. 2004, AJ, 128, 1529, doi: 10.1086/423701
2004 doi
-
[51]
A., Escudero, C
Norris, M. A., Escudero, C. G., Faifer, F. R., et al. 2015, MNRAS, 451, 3615, doi: 10.1093/mnras/stv1221
2015 doi
-
[52]
A., & Kannappan, S
Norris, M. A., & Kannappan, S. J. 2011, MNRAS, 414, 739, doi: 10.1111/j.1365-2966.2011.18440.x
2011
-
[53]
2019, MNRAS, 488, 5400, doi: 10.1093/mnras/stz2096
Schinnerer, E., & Leaman, R. 2019, MNRAS, 488, 5400, doi: 10.1093/mnras/stz2096
2019 doi
-
[54]
A., Kannappan, S
Norris, M. A., Kannappan, S. J., Forbes, D. A., et al. 2014, MNRAS, 443, 1151, doi: 10.1093/mnras/stu1186
2014 doi
-
[55]
2022, ApJ, 924, 48, doi: 10.3847/1538-4357/ac339f
Pechetti, R., Seth, A., Kamann, S., et al. 2022, ApJ, 924, 48, doi: 10.3847/1538-4357/ac339f
2022 doi
-
[56]
W., Jord´ an, A., Cˆ ot´ e, P., et al
Peng, E. W., Jord´ an, A., Cˆ ot´ e, P., et al. 2008, ApJ, 681, 197, doi: 10.1086/587951
2008 doi
-
[57]
W., Ferguson, H
Peng, E. W., Ferguson, H. C., Goudfrooij, P., et al. 2011, ApJ, 730, 23, doi: 10.1088/0004-637X/730/1/23
2011 doi
-
[58]
2013, MNRAS, 433, 1997, doi: 10.1093/mnras/stt867
Pfeffer, J., & Baumgardt, H. 2013, MNRAS, 433, 1997, doi: 10.1093/mnras/stt867
2013 doi
-
[59]
Pfeffer, J., Hilker, M., Baumgardt, H., & Griffen, B. F. 2016, MNRAS, 458, 2492, doi: 10.1093/mnras/stw498
2016 doi
-
[60]
T., & Norris, M
Pomeroy, R. T., & Norris, M. A. 2024, MNRAS, 530, 3043, doi: 10.1093/mnras/stae960
2024 doi
-
[61]
2009, MNRAS, 397, 1816, doi: 10.1111/j.1365-2966.2009.15122.x
Price, J., Phillipps, S., Huxor, A., et al. 2009, MNRAS, 397, 1816, doi: 10.1111/j.1365-2966.2009.15122.x
2009
-
[62]
L., et al
Reina-Campos, M., Trujillo-Gomez, S., Pfeffer, J. L., et al. 2023, MNRAS, 521, 6368, doi: 10.1093/mnras/stad920
2023 doi
-
[63]
F., et al
Saifollahi, T., Janz, J., Peletier, R. F., et al. 2021, MNRAS, 504, 3580, doi: 10.1093/mnras/stab1118 S´ ersic, J. L. 1968, Atlas de Galaxias Australes (Observatorio Astronomico, Universidad Nacional de Cordoba)
2021 doi
-
[64]
C., van den Bosch, R., Mieske, S., et al
Seth, A. C., van den Bosch, R., Mieske, S., et al. 2014, Nature, 513, 398, doi: 10.1038/nature13762
2014 doi
-
[65]
R., Larsen, S
Spitler, L. R., Larsen, S. S., Strader, J., et al. 2006, AJ, 132, 1593, doi: 10.1086/507328
2006 doi
-
[66]
P., Spitler, L., & Beasley, M
Strader, J., Brodie, J. P., Spitler, L., & Beasley, M. A. 2006, AJ, 132, 2333, doi: 10.1086/509124
2006 doi
-
[67]
C., Forbes, D
Strader, J., Seth, A. C., Forbes, D. A., et al. 2013, ApJL, 775, L6, doi: 10.1088/2041-8205/775/1/L6
2013 doi
-
[68]
L., Madau, P., Bortolas, E., et al
Tang, V. L., Madau, P., Bortolas, E., et al. 2024, ApJ, 963, 146, doi: 10.3847/1538-4357/ad1dd9
2024 doi
-
[69]
A., Drinkwater, M
Thomas, P. A., Drinkwater, M. J., & Evstigneeva, E. 2008, MNRAS, 389, 102, doi: 10.1111/j.1365-2966.2008.13543.x
2008
-
[70]
T., Seth, A
Voggel, K. T., Seth, A. C., Neumayer, N., et al. 2018, ApJ, 858, 20, doi: 10.3847/1538-4357/aabae5
2018 doi
-
[71]
W., Liu, C., et al
Wang, K., Peng, E. W., Liu, C., et al. 2023, Nature, 623, 296, doi: 10.1038/s41586-023-06650-z
2023 doi
-
[72]
2014, MNRAS, 441, 3083, doi: 10.1093/mnras/stu731
Weinzirl, T., Jogee, S., Neistein, E., et al. 2014, MNRAS, 441, 3083, doi: 10.1093/mnras/stu731
2014 doi
-
[73]
Grebel, E. K. 2016, MNRAS, 459, 4450, doi: 10.1093/mnras/stw827
2016 doi
- [74]
Reviewed August 7, 2026 · model on record in the stance chip above.
Discussion (0). Sign in to comment.