REVIEW 4 major objections 5 minor 31 references
SecCityVR: Visualization and Collaborative Exploration of Software Vulnerabilities in Virtual Reality
T0 review · 4 major / 5 minor · reviewed 2026-08-16 · deepseek-v4-flash
Pith's one-line read In a user study, a VR code city rendered software vulnerabilities with significantly less frustration and higher usability than a dashboard, though task times were longer.
desk verdict Novel VR code city for vulnerability exploration, but the evaluation overreaches: the baseline is a raw table and the headline usability claim is not significant. read the letter →
The pith
A machine-rendered reading of the paper's core claim, the machinery that carries it, and where it could break.
The reading
What carries the argument
The central object is the code city metaphor transplanted into VR: a squarified treemap lays out packages as districts on a baseplate sized by total lines of code, classes are extruded as buildings, methods appear as floors only when they contain a vulnerability (or are connected to one), and method floors are colored by issue priority and widened for emphasis. Call-graph edges are drawn as color-gradient arcs between methods, making possible propagation paths visible. This mapping carries the argument because it preserves the package-to-class hierarchy while adding spatial locality, and the on-demand rendering of arcs plus the multi-user networking (via Photon Fusion) is what supports collaborative exploration of vulnerability impact.
What would settle it
A follow-up study with a larger sample that compares SecCityVR against a current 2D graphical aggregation, such as the real find-sec-bugs or SonarQube dashboard with search enabled, and finds no significant difference in frustration or temporal demand would overturn the central claim; showing that the time gap cannot be reduced by adding search and teleport-to-target would further weaken the practical case.
Extended reading notes
Core claim
SecCityVR is claimed to be the first VR-based approach for visualizing and interactively exploring software security vulnerabilities. It maps each class to a building, each method to a color-coded floor (red, orange, green, or blue matching the priority scale of the find-sec-bugs analysis), packages to districts via a squarified treemap, and call-graph edges to arcs that users can render on demand; dependency packages are distinguished in magenta. Multi-user networking lets two auditors walk or fly through the city, teleport to each other, and start a guided review where one user's position is synchronized to the other's. In an evaluation against a tabular baseline built from the same find-sec-bugs XML and call-graph JSON, VR users solved the same tasks with comparable correctness and the results support accepting H1, the claim that the same tasks can be solved. VR scored higher on the System Usability Scale and markedly lower on temporal demand and frustration, although the SUS difference was not statistically significant, so H2 was not formally accepted.
Load-bearing premise
The comparison dashboard was a raw tabular listing of the same XML and JSON results, not the actual find-sec-bugs dashboard interface; if that baseline is unfairly weak, the reported VR advantages in frustration and temporal demand may shrink or disappear.
Editorial extensions
If this is right
- VR code cities are a viable medium for security audits: users completed the same four tasks as the dashboard group with comparable correctness, supporting the paper's H1.
- Security reviews in VR are experienced as less rushed and less frustrating, which could improve developer engagement and willingness to participate in audits.
- Multi-user VR collaboration supports distinct work strategies, such as splitting up to explore and then using guided review, or teleporting to a partner's findings for immediate discussion.
- Call-graph arcs give an at-a-glance view of how vulnerabilities propagate across components, directly addressing the paper's problem statement P2.
- Adding search, teleportation to distant targets, and source-code integration could close the significant time gap between VR and dashboard usage.
Reading between the lines
- If the lower-frustration effect survives a stronger baseline, VR may be most valuable for junior developers: the embodied layout plus built-in explanations and mitigations could support learning how vulnerabilities spread, not just finding them.
- The city could be extended into a complete triage tool by visualizing concurrent vulnerabilities within one method and letting users mark issues as reviewed or deferred, features the paper names only as future work.
- A testable extension is to measure whether the arc-based view specifically speeds up root-cause reasoning about call chains compared with 2D graph views, since the arcs are the main differentiator of this design.
- The practical case would be stronger if the comparison were repeated against a proper 2D graphical aggregation such as the real find-sec-bugs or SonarQube dashboard with search enabled; the authors themselves call for this follow-up.
Signed reviews
Editorial analysis
A structured set of objections, weighed in public.
Referee Report
Summary. The paper presents SecCityVR, a virtual reality environment that visualizes static analysis security testing (SAST) results using the code city metaphor, augments the visualization with call-graph arcs, and supports multi-user collaboration. The authors describe the system architecture, the mapping from Java artifacts to city elements, the interaction and collaboration features, and an evaluation consisting of a between-subjects main study (17 participants) and a smaller collaboration study (8 participants). The VR condition is compared with a tabular baseline derived from the same SAST XML and call-graph JSON files. Reported results include longer task completion times in VR, higher median SUS score (70 vs. 58.75, p=0.14), lower TLX temporal demand (10 vs. 42.5 in the main study, p=0.061; 25 vs. 77.5 in the collaboration study, p=0.029), and lower TLX frustration (17.5 vs. 52.5, p=0.03 in the main study). The abstract and conclusion claim that the VR approach provides higher usability, lower temporal demand, and significantly lower frustration, and the authors accept hypotheses H1 and, with caveats, discuss H2.
Significance. If the empirical claims were fully supported, the paper would make a useful contribution to software visualization and security auditing: it applies VR code cities to a security context, integrates call-graph context, and provides an open-source Unity implementation plus a multi-user mode. The use of established instruments (SUS, TLX, VRSQ, IPQ) and the availability of raw data are strengths. However, the central comparative claims are weakened by two load-bearing problems: the baseline is not the find-sec-bugs dashboard named in the abstract but a raw tabular listing with browser search disabled, and several headline benefits (usability, temporal demand in the main study) are not statistically significant at the chosen alpha level. The paper's scientific value currently lies more in the system design and exploratory findings than in the evidence for a decisive advantage of VR over a traditional dashboard.
major comments (4)
- [Section 4 (Evaluation) and Section 4.2, Threats to validity] The comparison baseline is not a fair proxy for the 'traditional dashboard find-sec-bugs' named in the abstract. Section 4 states that the baseline is a tabular display of the same SAST XML and that participants are not allowed to use the browser's search function; the call graph is provided as a raw JSON text file. This is a generic table with a core feature disabled, not the find-sec-bugs GUI that practitioners would use. The authors themselves acknowledge in the threats to validity that 'the kind of information displayed on the baseline dashboard could be criticized' and that the raw tabular form may be an unsuitable comparison for visualization properties. Because the central claim of lower frustration and lower temporal demand is a comparison against this weakened baseline, the observed differences may reflect the baseline's handicap rather than a benefit of VR. To make the central claim load-bearing, the study would need to use the actual find-sec-bugs dashboard (or an equivalent 2D graphical aggregation) as the baseline, or the claims must be explicitly limited to a comparison against raw tabular results.
- [Abstract and Section 4.2 (Usability, Task Load)] The abstract's claim of 'higher usability' is not supported by the reported statistics: the SUS difference (70 vs. 58.75) has p=0.14, which is not significant at alpha=0.05. Likewise, 'lower temporal demand' in the main study has p=0.061, which is also not significant. Section 4.2 correctly states that H2 cannot be accepted because the SUS result is not significant, yet the conclusion and abstract present improved usability and reduced cognitive load as established benefits. This internal inconsistency must be resolved by either reporting only the significant findings or providing additional evidence (e.g., effect sizes and a preregistered analysis) that justifies the stronger wording.
- [Section 4.2 (Results) and Section 4.1 (Procedure)] The statistical analysis suffers from multiple comparisons and a small sample. The TLX questionnaire includes six dimensions, and the authors perform separate Mann-Whitney-U tests for each dimension in both the main and collaboration studies without any correction for multiple comparisons (e.g., Bonferroni). With approximately 9 VR and 8 dashboard participants in the main study and 4 per group in the collaboration study, the single significant frustration result (p=0.03) would not survive a conservative correction across six dimensions. The paper should report effect sizes, confidence intervals, or adjusted p-values, and should label the TLX dimension comparisons as exploratory rather than definitive.
- [Section 4.2 (Motion Sickness)] The VRSQ analysis reports p-values (p_ocu=0.046, p_dis=0.012, p_vrsq=0.033) described as 'significant result,' but VRSQ is collected only in the VR group and there is no described comparison condition or null hypothesis. It is unclear what test produced these p-values (e.g., comparison against a zero-symptom baseline? pre-post comparison?) and what the explicit hypotheses were. Without this information, the p-values are uninterpretable. The authors should specify the test, the comparison value, and the direction of the effect.
minor comments (5)
- [Throughout] There are several typos and grammatical errors, e.g., 'Additionnally' in Section 4, 'groundlay' in Section 3, and 'differ notable' in Section 4.2. A careful proofreading pass is needed.
- [Section 4.2 (Task Load)] In the collaboration study results, the performance dimension is reported as '72.5 Dashboard, 52.5 VR, p=0.2*' with an asterisk despite p=0.2 being non-significant. The asterisk convention should be consistent and only applied to p<0.05.
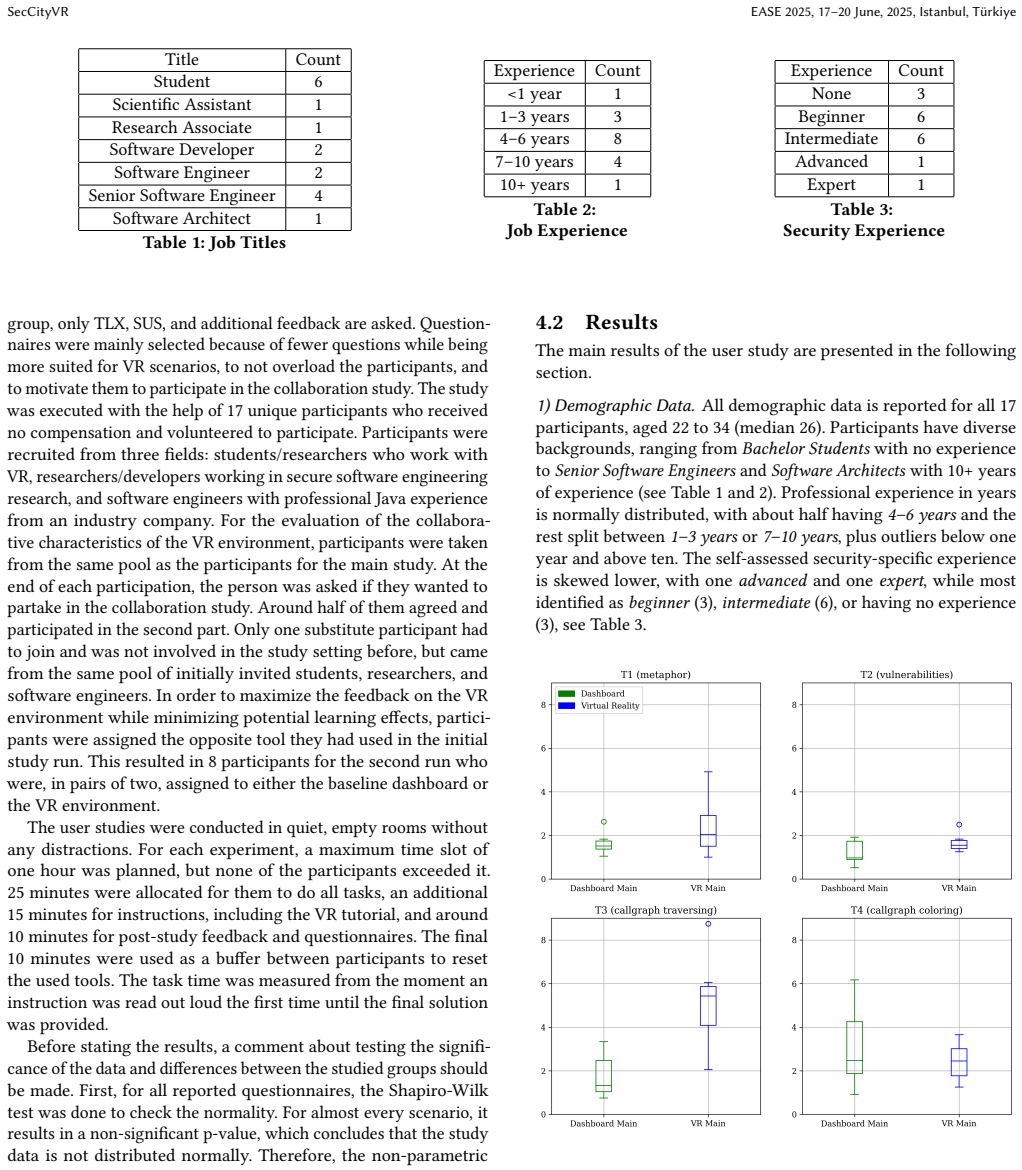
- [Section 4.2 (Demographic Data)] The tables of job titles, experience, and security experience are not numbered and have incomplete captions (e.g., Table 3 is captioned 'Security Experience' but the column header is 'Experience Count'). Numbering and clearer captions would improve readability.
- [Section 4 (Procedure and Results)] The paper reports on the collaboration study with 8 participants but does not clearly state how many were in each group (VR vs. dashboard) or whether these participants are a subset of the 17 from the main study. Clarify the participant flow and group sizes.
- [Section 4.2 (Efficiency)] Figure 4 shows task times but does not include error bars or descriptive statistics such as standard deviations. Adding these would help readers assess the variance behind the reported medians.
Circularity Check
No circularity: SecCityVR is an empirical user study whose claims rest on standardized questionnaires and task measurements, not on a derivation chain or self-citation.
full rationale
The paper does not present a derivation, a fitted model, or a statistical prediction built from its own outputs. Its central claims about usability, temporal demand, and frustration are obtained from a between-subjects user study using standard instruments (SUS, NASA-TLX, VRSQ, IPQ) and fixed tasks that are independent of the system's internal construction. The comparison condition is a tabular baseline assembled from the same SAST and call-graph artifacts; the paper explicitly acknowledges the limitation that the baseline displays raw results in tabular form rather than a graphical aggregation, and flags this as a threat to validity rather than disguising it as a derivation. That acknowledged design limitation is a concern about external or construct validity, not circularity. There are no self-citations used as load-bearing evidence, no uniqueness theorems imported from the authors' prior work, and no ansatz smuggled in by citation. The abstract's phrase 'higher usability' is not statistically supported by the paper's own SUS result (p = 0.14), but this is an overstatement of evidence, not a circular derivation. Therefore the appropriate finding is no significant circularity.
Assumptions & free parameters
assumptions (5)
- domain assumption The code city metaphor improves codebase comprehension.
- domain assumption VR is a viable medium for software visualization.
- domain assumption Standard questionnaires (SUS, TLX, VRSQ, IPQ) validly measure usability, workload, motion sickness, and presence.
- domain assumption The tasks T1-T4 and the collaborative selection task are representative of security audit exploration activities.
- domain assumption Rapid Type Analysis produces a call graph accurate enough to contextualize vulnerabilities.
Cite this review
Pith. "Pith review of SecCityVR: Visualization and Collaborative Exploration of Software Vulnerabilities in Virtual Reality." pith.science (2026). https://pith.science/paper/UY2FAHFD
@misc{pith2026250418238,
  author       = {Pith},
  title        = {Pith review of: SecCityVR: Visualization and Collaborative Exploration of Software Vulnerabilities in Virtual Reality},
  year         = {2026},
  howpublished = {\url{https://pith.science/paper/UY2FAHFD}},
  note         = {Machine review of arXiv:2504.18238}
}
read the original abstract
Security vulnerabilities in software systems represent significant risks as potential entry points for malicious attacks. Traditional dashboards that display the results of static analysis security testing often use 2D or 3D visualizations, which tend to lack the spatial details required to effectively reveal issues such as the propagation of vulnerabilities across the codebase or the appearance of concurrent vulnerabilities. Additionally, most reporting solutions only treat the analysis results as an artifact that can be reviewed or edited asynchronously by developers, limiting real-time, collaborative exploration. To the best of our knowledge, no VR-based approach exists for the visualization and interactive exploration of software security vulnerabilities. Addressing these challenges, the virtual reality (VR) environment SecCityVR was developed as a proof-of-concept implementation that employs the code city metaphor within VR to visualize software security vulnerabilities as colored building floors inside the surrounding virtual city. By integrating the application's call graph, vulnerabilities are contextualized within related software components. SecCityVR supports multi-user collaboration and interactive exploration. It provides explanations and mitigations for detected issues. A user study comparing SecCityVR with the traditional dashboard find-sec-bugs showed the VR approach provided a favorable experience, with higher usability, lower temporal demand, and significantly lower frustration despite having longer task completion times. This paper and its results contribute to the fields of collaborative and secure software engineering, as well as software visualization. It provides a new application of VR code cities to visualize security vulnerabilities, as well as a novel environment for security audits using collaborative and immersive technologies.
Figures


Figures from the paper (2 more)

Reference graph
Works this paper leans on
-
[1]
Sazzadul Alam and Philippe Dugerdil. 2007. EvoSpaces Visualization Tool: Ex- ploring Software Architecture in 3D. In 14th Working Conference on Reverse Engineering (WCRE 2007). 269–270. https://doi.org/10.1109/WCRE.2007.26
-
[2]
Steven Arzt. 2017. Static Data Flow Analysis for Android Applications . Ph. D. Dissertation. Technische Universität Darmstadt, Darmstadt. http://tuprints.ulb. tu-darmstadt.de/5937/
work page 2017
- [3]
-
[4]
Gergő Balogh, Attila Szabolics, and Arpád Beszédes. 2015. CodeMetropolis: Eclipse over the city of source code. In 2015 IEEE 15th International Working Conference on Source Code Analysis and Manipulation (SCAM) . 271–276. https: //doi.org/10.1109/SCAM.2015.7335425
arXiv 2015
-
[5]
John Brooke. 1995. SUS: A quick and dirty usability scale. Usability Eval. Ind. 189 (11 1995)
1995
-
[6]
Mark Bruls, Kees Huizing, and Jarke J Van Wijk. 2000. Squarified treemaps. In Data Visualization 2000: Proceedings of the Joint EUROGRAPHICS and IEEE TCVG Symposium on Visualization in Amsterdam, The Netherlands, May 29–30, 2000 . Springer, 33–42
work page 2000
-
[7]
Veronika Dashuber and Michael Philippsen. 2022. Static and Dynamic Depen- dency Visualization in a Layered Software City. SN Computer Science 3 (10 2022). https://doi.org/10.1007/s42979-022-01404-6
-
[8]
OWASP Foundation. 12.06.2023. OWASP Top Ten. https://owasp.org/www- project-top-ten/
work page 2023
Show all 31 references
-
[9]
Falko Galperin, Rainer Koschke, and Marcel Steinbeck. 2022. Visualizing Code Smells: Tables or Code Cities? A Controlled Experiment. In 2022 Working Confer- ence on Software Visualization , Fabio Petrillo (Ed.). IEEE, Piscataway, NJ, 51–62. https://doi.org/10.1109/VISSOFT55257...
2022
-
[10]
Hamish Graham, Hong Yul Yang, and Rebecca Berrigan. 2004. A solar system metaphor for 3D visualisation of object oriented software metrics. In Proceedings of the 2004 Australasian Symposium on Information Visualisation-Volume 35 . 53– 59
2004
-
[11]
Scott W. Harden. 04.09.2024. Treemapping with C#. https://swharden.com/blog/ 2023-03-07-treemapping/
2024
-
[12]
Hart and Lowell E
Sandra G. Hart and Lowell E. Staveland. 1988. Development of NASA-TLX (Task Load Index): Results of Empirical and Theoretical Research. In Human Mental Workload, Peter A. Hancock and Najmedin Meshkati (Eds.). Advances in Psychology, Vol. 52. North-Holland, 139–183. https://doi...
1988 doi
-
[13]
26.08.2024
igroup.org – project consortium. 26.08.2024. igroup presence questionnaire (IPQ) overview. https://www.igroup.org/pq/ipq/index.php
2024
-
[14]
Brittany Johnson, Yoonki Song, Emerson Murphy-Hill, and Robert Bowdidge
-
[15]
Kadiray Karakaya, Stefan Schott, Jonas Klauke, Eric Bodden, Markus Schmidt, Linghui Luo, and Dongjie He. 2024. SootUp: A Redesign of the Soot Static Analysis Framework. In Tools and Algorithms for the Construction and Analysis of Systems, Bernd Finkbeiner and Laura Kovács (Eds...
2024
-
[16]
Kim, Jaehyun Park, Yeongcheol Choi, and Mungyeong Choe
Hyun K. Kim, Jaehyun Park, Yeongcheol Choi, and Mungyeong Choe. 2018. Virtual reality sickness questionnaire (VRSQ): Motion sickness measurement index in a virtual reality environment. Applied Ergonomics 69 (2018), 66–73. https://doi.org/10.1016/j.apergo.2017.12.016
2018 doi
-
[17]
Rainer Koschke and Marcel Steinbeck. 2021. Modeling, Visualizing, and Check- ing Software Architectures Collaboratively in Shared Virtual Worlds.. In ECSA (Companion)
2021
-
[18]
Stefan Krüger, Sarah Nadi, Michael Reif, Karim Ali, Mira Mezini, Eric Bodden, Florian Göpfert, Felix Günther, Christian Weinert, Daniel Demmler, and Ram Kamath. 2017. CogniCrypt: Supporting developers in using cryptography. In 2017 32nd IEEE/ACM International Conference on Aut...
2017
-
[19]
Lewis and Jeff Sauro
James R. Lewis and Jeff Sauro. 2018. Item benchmarks for the system usability scale. J. Usability Studies 13, 3 (may 2018), 158–167
2018
-
[20]
Leonel Merino, Mohammad Ghafari, Craig Anslow, and Oscar Nierstrasz. 2017. CityVR: Gameful Software Visualization. In 2017 IEEE International Conference on Software Maintenance and Evolution (ICSME) . 633–637. https://doi.org/10.1109/ ICSME.2017.70
2017
-
[21]
4/4/2024
Microsoft. 4/4/2024. Microsoft Security Development Lifecycle. https://www. microsoft.com/en-us/securityengineering/sdl
2024
-
[22]
González- Barahona, and Michele Lanza
David Moreno-Lumbreras, Roberto Minelli, Andrea Villaverde, Jesús M. González- Barahona, and Michele Lanza. 2021. CodeCity: On-Screen or in Virtual Reality?. In 2021 Working Conference on Software Visualization (VISSOFT) . 12–22. https: //doi.org/10.1109/VISSOFT52517.2021.00011
2021
-
[23]
02.09.2015
Steve Morgan. 02.09.2015. Is poor software development the biggest cyber threat? CSO Online (02.09.2015). https://www.csoonline.com/article/552647/is-poor- software-development-the-biggest-cyber-threat.html
2015
-
[24]
Steven Lamarr Reynolds, Tobias Mertz, Steven Arzt, and Jörn Kohlhammer. 2021. User-Centered Design of Visualizations for Software Vulnerability Reports. In 2021 IEEE Symposium on Visualization for Cyber Security (VizSec) . 68–78. https: //doi.org/10.1109/VizSec53666.2021.00013
2021
-
[25]
Simone Romano, Nicola Capece, Ugo Erra, Giuseppe Scanniello, and Michele Lanza. 2019. On the use of virtual reality in software visualization: The case of the city metaphor. Information and Software Technology 114 (2019), 92–106. https://doi.org/10.1016/j.infsof.2019.06.007
2019 doi
-
[26]
Andreas Schreiber and Martin Misiak. 2018. Visualizing Software Architec- tures in Virtual Reality with an Island Metaphor. In Virtual, Augmented and Mixed Reality: Interaction, Navigation, Visualization, Embodiment, and Simulation , Jessie Y.C. Chen and Gino Fragomeni (Eds.)....
2018
-
[27]
Philipp Dominik Schubert, Ben Hermann, and Eric Bodden. 2019. PhASAR: An Inter-procedural Static Analysis Framework for C/C++. In Tools and Algorithms for the Construction and Analysis of Systems, Tomáš Vojnar and Lijun Zhang (Eds.). Springer International Publishing, Cham, 393–410
2019
-
[28]
Juraj Vincur, Pavol Navrat, and Ivan Polasek. 2017. VR City: Software Analysis in Virtual Reality Environment. In 2017 IEEE International Conference on Software Quality, Reliability and Security Companion (QRS-C) . 509–516. https://doi.org/10. 1109/QRS-C.2017.88
2017
-
[29]
Richard Wettel and Michele Lanza. 2007. Visualizing Software Systems as Cities. In Visualizing Software Systems as Cities . 92–99. https://doi.org/10.1109/VISSOF. 2007.4290706
2007
-
[30]
Robert K Yin. 2009. Case study research: Design and methods . Vol. 5. sage. Preprint — do not distribute
2009
-
[2013]
In 2013 35th International Conference on Software Engineering (ICSE)
Why don’t software developers use static analysis tools to find bugs?. In 2013 35th International Conference on Software Engineering (ICSE) . 672–681. https://doi.org/10.1109/ICSE.2013.6606613
2013
Reviewed August 16, 2026 · model on record in the stance chip above.
Discussion (0). Continue with ORCID to comment.