REVIEW 3 major objections 8 minor 57 references
The disk luminosity deficit as a tracer of receding disk during Soft-to-Hard transitions in Black Hole X-ray Binaries
T0 review · 3 major / 8 minor · reviewed 2026-07-07 · glm-5.2
Pith's one-line read Disk luminosity deficit traces thin disk recession in black hole binaries
desk verdict Population-scale disk-recession tracer for BHXRB soft-to-hard transitions; validity hinges on unverified exponential mass-inflow assumption read the letter →
The pith
A machine-rendered reading of the paper's core claim, the machinery that carries it, and where it could break.
The reading
What carries the argument
The luminosity-deficit tracer (Equation 4): R_tr/R_ISCO = L_exp/L_obs, where L_exp is the extrapolated soft-state exponential disk luminosity and L_obs is the observed disk luminosity after the break. The exponential baseline is fit via MCMC with free interval boundaries, and the resulting ratio converts a luminosity deficit into a dimensionless truncation radius. Timing frequencies (broadband noise break frequency and QPO characteristic frequency) serve as an independent consistency check.
What would settle it
If an independent measurement of the disk inner radius (e.g., from reflection spectroscopy or reverberation lags) during the soft-to-hard transition showed the disk remaining at or near the ISCO while the luminosity deficit grows, the tracer would be measuring coronal power redistribution rather than geometric disk recession.
Extended reading notes
Core claim
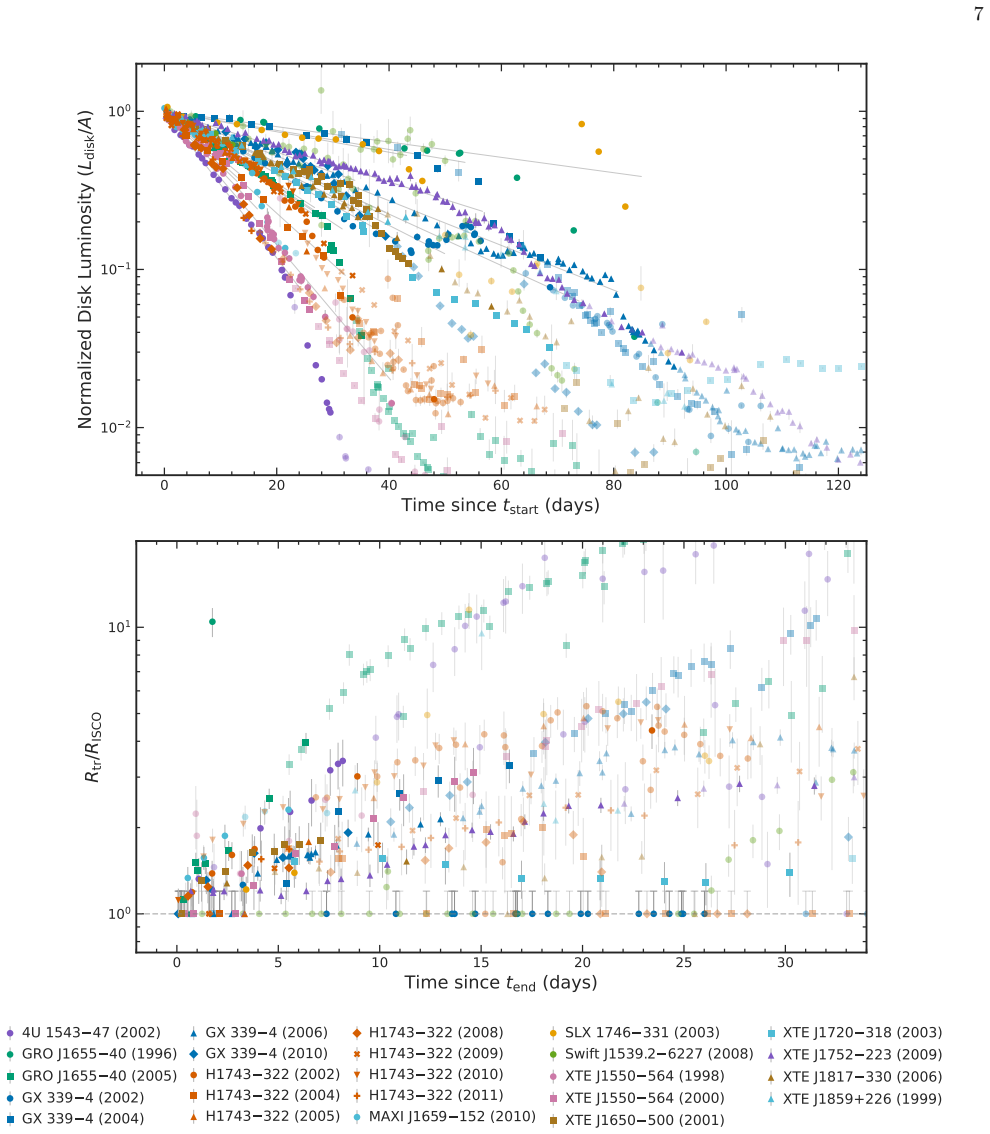
The ratio of extrapolated-to-observed thermal disk luminosity, R_tr/R_ISCO = L_exp/L_obs, provides a model-defined tracer of disk truncation radius evolution during the soft-to-hard transition in black hole X-ray binaries. In 24 outbursts, this tracer increases rapidly after the disk luminosity breaks below the soft-state exponential baseline, and the increase is corroborated by decreasing characteristic frequencies of broadband noise and low-frequency QPOs, consistent with an expanding hot inner flow.
Load-bearing premise
The method assumes that the underlying mass inflow rate continues to follow the soft-state exponential decay after the luminosity break. If the mass inflow rate itself deviates from the exponential trend — for example because outer-disk irradiation weakens or the disk drains differently — then the luminosity deficit reflects a change in mass supply rather than a change in accretion efficiency from disk recession.
Editorial extensions
If this is right
- The luminosity-deficit method can be applied to any black hole X-ray binary outburst with sufficient soft-state coverage, providing a uniform, model-light way to compare disk evolution across sources without relying on direct spectral radius measurements.
- The wide diversity in break accretion rate and recession slope across outbursts suggests that disk recession is not triggered by a single universal accretion-rate threshold, pointing to additional controlling factors such as irradiation geometry, magnetic field configuration, or disk evaporation efficiency.
- If the tracer is validated against independent radius estimates (e.g., from reverberation mapping or reflection modeling in the NICER era), it could become a standard diagnostic for mapping the accretion geometry evolution during state transitions.
- The method could be extended to neutron star X-ray binaries to test whether disk recession occurs in systems without an event horizon, constraining the role of the inner boundary condition.
Reading between the lines
- The tracer's validity hinges on the assumption that mass inflow continues to follow the soft-state exponential trend after the break. If the mass supply itself deviates — for instance due to outer-disk cooling reducing the inflow rate — the luminosity deficit would partially reflect a change in mass supply rather than purely a change in accretion efficiency from disk recession. The paper acknowled
- The luminosity deficit could also arise without large geometric recession if a growing fraction of accretion power is dissipated in a corona or outflow rather than in the thin disk. In that case, R_tr/R_ISCO would track an effective radiative efficiency change rather than a physical inner radius, though the timing trends would still be qualitatively consistent with inner-flow expansion.
- Combining the luminosity-deficit tracer with future simultaneous reflection or reverberation measurements (e.g., from NICER+NuSTAR) could break the degeneracy between true geometric recession and coronal power redistribution, testing whether the inferred R_tr corresponds to a physical disk edge.
Editorial analysis
A structured set of objections, weighed in public.
Referee Report
Summary. The manuscript presents a systematic study of 26 BHXRB outbursts observed with RXTE/PCA, proposing that the thermal disk luminosity deficit relative to an extrapolated soft-state exponential baseline serves as an empirical tracer of thin disk recession during soft-to-hard transitions. The central relation (Eq. 4) defines R_tr/R_ISCO = L_exp/L_obs, where L_exp is the extrapolated exponential and L_obs is the observed disk luminosity. The authors apply this tracer to 24 outbursts, finding that the inferred truncation radius increases during the transition, and present a qualitative timing cross-check showing decreasing characteristic frequencies. The paper also discusses the diversity of recession behavior across sources and addresses the distinction between irradiation-driven decay and disk evaporation.
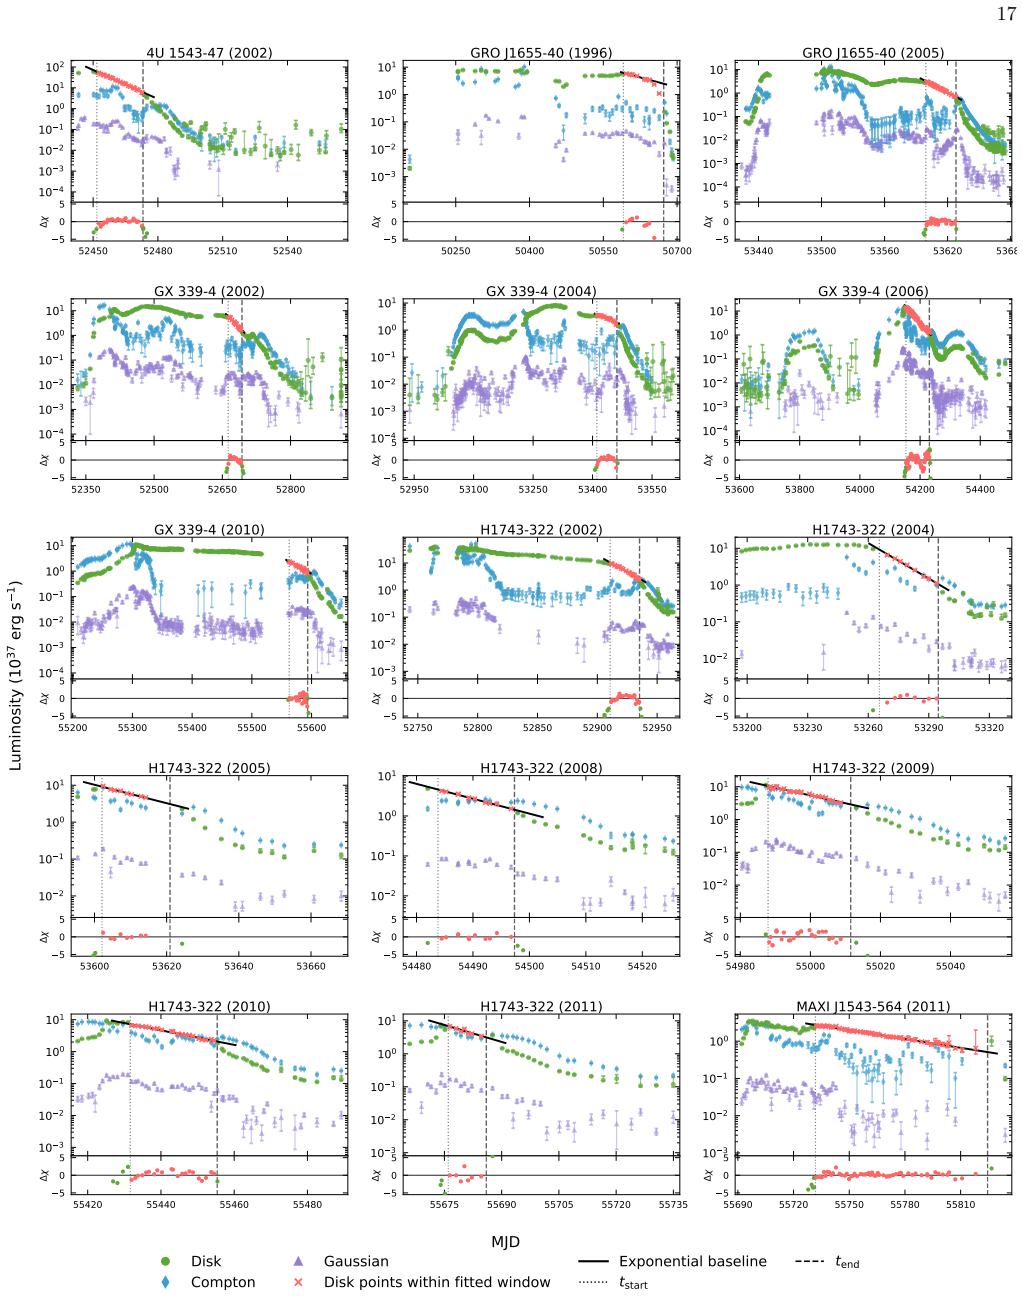
Significance. The paper addresses a genuine observational challenge — the unreliability of direct spectral radius measurements during soft-to-hard transitions — and proposes a practical, broadly applicable tracer using archival RXTE data across a large sample. The systematic nature of the analysis (24 outbursts, uniform spectral decomposition) and the MCMC-based baseline fitting procedure (Appendix B) are commendable. The qualitative timing cross-check and the irradiation radius consistency check (Section 5.2, Figure 4) add supporting evidence. The framework is transparent about its assumptions and limitations, which is appropriate. The falsifiable prediction — that total luminosity (disk + Comptonized) should approximately track the exponential baseline if mass inflow persists — is implicitly present in the data (Figures 8–9 show the Comptonized component rising as the disk drops) but is not explicitly tested as a quantitative check.
major comments (3)
- Section 3, Eq. (4): The recession tracer R_tr/R_ISCO = L_exp/L_obs is valid only if the mass inflow rate continues to follow the soft-state exponential decay after t_break. The paper acknowledges this assumption (Section 3, following B. You et al. 2023) and discusses it in Section 5.2, but the tracer's central claim depends on it. A direct, quantitative test is available but not performed: if the mass inflow persists exponentially while the disk recedes, the total luminosity L_disk + L_Comp should approximately track the extrapolated baseline (since accretion power is redistributed from the thermal disk to the Comptonized component). The individual light curves in Appendix C (Figures 8–9) show the Comptonized component rising as the disk drops, but no systematic comparison of L_total vs. L_exp is presented across the sample. Adding such a check — even for a representative subset — would
- Section 4.2, Figure 2: The timing cross-check is described as qualitative, and the authors note that frequencies 'should not be interpreted as direct measurements of the local Keplerian frequency.' However, the timing analysis is presented as a key corroborating result (point 2 of the Conclusion). The scatter in Figure 2 is substantial (spanning roughly an order of magnitude in frequency at any given R_tr/R_ISCO), and no quantitative correlation coefficient or fit is reported. A Spearman rank correlation or similar quantitative measure for the frequency–radius relation would strengthen the claim that the timing evolution is 'consistent with' disk recession, or alternatively would clarify the limits of the agreement.
- Section 5.1, Eq. (6) and Figure 3B: The recession slope gamma and the break scale m_dot_break are both derived from the same exponential baseline, and the authors note they are 'not statistically independent quantities.' The reported Spearman r_S = 0.3 at 0.6 sigma significance is therefore difficult to interpret. While the authors frame this as exploratory, the conclusion states that gamma 'shows no statistically significant correlation with m_dot_break' as a substantive finding (point 3). Given the shared dependence on the fitted baseline, this non-correlation may reflect the statistical structure of the construction rather than a physical result. The authors should clarify whether the non-independence could artificially suppress or inflate the correlation, or restrict the claim to a more cautious statement.
minor comments (8)
- Abstract: '26 BHXRBs' vs. '24 outbursts' — the abstract states 26 sources were studied and 24 outbursts identified with the deficit. Table 1 lists 26 sources but Table 2 lists 32 outburst episodes fitted. The relationship between '26 BHXRBs,' '24 outbursts,' and the 32 entries in Table 2 should be clarified.
- Section 2.2: The electron temperature is fixed at kT_e = 150 keV. Appendix Figure 5 shows the comparison for 4U 1543-47, but it would be useful to state how many sources were checked and whether any showed significant differences, rather than only one example.
- Section 2.2: The diskbb normalization depends on the color correction factor f_col and the inclination, neither of which is discussed in the context of the luminosity-to-radius conversion. Since Eq. (4) uses luminosity ratios for the same source, f_col cancels, but the disk fluxes themselves depend on the spectral model assumptions. A brief note on this cancellation would help the reader.
- Figure 1: The legend lists 24 outbursts but the panel B y-axis starts at 10^0. Some points are plotted as lower limits at R_tr = R_ISCO; the criteria for when a point is a lower limit vs. a measurement should be stated more precisely (currently described only as 'when the observed disk luminosity is higher than, or statistically consistent with, the extrapolated baseline').
- Table 2: GS 1354-64 (1997) has tau = 48.4 +309.1/-5.0 days, which is extremely poorly constrained. It would be useful to flag such cases or note whether they are included in the Figure 1/3 analysis.
- Section 5.2: The irradiation radius check (Figure 4) uses C_irr = 5e-3. The sensitivity of R_irr to this choice is not discussed; a brief note on how much R_irr changes for plausible C_irr values (e.g., 1e-3 to 1e-2) would strengthen the order-of-magnitude argument.
- References: Several 2026 references (König et al. 2026; Zdziarski et al. 2026a,b; You et al. 2026) are cited. Ensure these are properly published or have stable arXiv identifiers at the time of submission.
- Figure 2: The theory curves for Lense-Thirring precession are shown for a = 0.1, 0.5, 0.9 at 10 M_sun. The assumed hot-flow geometry (radial extent, surface density profile) is mentioned as important but not specified. A brief statement of the assumed geometry would make the comparison more interpretable.
Simulated Author's Rebuttal
We thank the referee for a careful and constructive report. All three major comments are well-taken and will be addressed in the revised manuscript. We agree to add a quantitative total-luminosity consistency check, report a formal correlation coefficient for the timing–radius relation, and soften the conclusion regarding the gamma–m_dot_break non-correlation. One standing limitation remains: the non-independence of gamma and m_dot_break cannot be fully disentangled without dedicated simulations, and we will state this explicitly.
read point-by-point responses
-
Referee: Section 3, Eq. (4): The recession tracer R_tr/R_ISCO = L_exp/L_obs is valid only if the mass inflow rate continues to follow the soft-state exponential decay after t_break. A direct, quantitative test is available but not performed: if mass inflow persists exponentially while the disk recedes, L_disk + L_Comp should approximately track the extrapolated baseline. No systematic comparison of L_total vs. L_exp is presented across the sample.
Authors: We agree that this is the most direct internal consistency check available for our central assumption, and we appreciate the referee identifying it. We will add a quantitative comparison of L_total = L_disk + L_Comp against the extrapolated exponential baseline L_exp for the full sample (or at minimum a representative subset), presented as a new figure and accompanying statistics in the revised manuscript. We note two caveats that we will also state explicitly in the paper. First, exact tracking of L_exp by L_total is a necessary but not sufficient condition: if the radiative efficiency of the hot inner flow differs from that of the thin disk at the ISCO, or if a fraction of the accretion power is carried away by outflows, L_total will deviate from L_exp even if the mass inflow rate continues exponentially. Second, the Comptonized flux in our spectral decomposition depends on the assumed electron temperature (fixed at kT_e = 150 keV) and on the thcomp covering fraction, introducing additional model-dependent uncertainty into L_total. Nevertheless, the test provides a valuable order-of-magnitude check: if L_total drops well below L_exp across the sample, the assumption of persistent exponential inflow would be seriously challenged. If L_total remains broadly consistent with L_exp (within the expected efficiency-factor scatter), the assumption is supported. We will report the results honestly regardless of outcome. revision: yes
-
Referee: Section 4.2, Figure 2: The timing cross-check is qualitative, but presented as a key corroborating result (Conclusion point 2). The scatter is substantial and no quantitative correlation coefficient is reported. A Spearman rank correlation would strengthen or clarify the claim.
Authors: This is a fair point. We will compute and report the Spearman rank correlation coefficient (with Monte Carlo propagation of measurement uncertainties, following the same procedure already used for the gamma–m_dot_break comparison) for the characteristic frequency versus R_tr/R_ISCO relation, separately for the broadband noise and QPO components shown in Figure 2. We expect the coefficient to confirm a negative trend but with substantial scatter, and we will report the significance level transparently. We will also revise the language in the Conclusion to accurately reflect the strength of the correlation rather than describing it only as 'qualitatively consistent.' If the correlation turns out to be weak in a statistical sense, we will say so and discuss the possible reasons (e.g., that the characteristic frequency is not a direct measurement of the Keplerian frequency at the truncation radius, that different variability components may trace different radii, and that red-noise leakage and multi-component decomposition introduce additional scatter). The timing analysis will remain a supporting consistency check rather than a primary result, consistent with how it is framed in the manuscript. revision: yes
-
Referee: Section 5.1, Eq. (6) and Figure 3B: gamma and m_dot_break are both derived from the same exponential baseline and are not statistically independent. The reported non-correlation (r_S = 0.3, 0.6 sigma) may reflect the statistical structure of the construction rather than a physical result. The conclusion states this as a substantive finding (point 3).
Authors: The referee raises a valid concern. We already note in Section 5.1 that gamma and m_dot_break 'are not statistically independent quantities, because both are derived from the same exponential baseline,' and we frame the comparison as 'exploratory.' However, we agree that Conclusion point 3 presents the non-correlation as a more substantive finding than is warranted given this shared dependence. In the revised manuscript, we will (1) add an explicit discussion of how the non-independence could in principle either suppress or inflate the correlation, depending on the covariance structure of the fitted baseline parameters; (2) note that without dedicated Monte Carlo simulations of the joint distribution of gamma and m_dot_break under the null hypothesis of a shared baseline, we cannot fully disentangle statistical artifact from physical result; and (3) revise Conclusion point 3 to restrict the claim to a more cautious statement — namely, that the data show no evidence for a strong correlation between the recession slope and the break scale, but that the non-independence of the two quantities limits the physical interpretation of this absence. We will not remove the comparison from the paper, as we believe the gamma–m_dot_break diagram remains a useful exploratory tool for visualizing the diversity of recession behavior, but we will ensure the conclusions do not overstate what the correlation test can demonstrate. revision: partial
- The non-independence of gamma and m_dot_break (Major Comment 3) cannot be fully resolved without dedicated simulations of the joint parameter distribution under controlled null hypotheses, which is beyond the scope of the current revision. We will acknowledge this limitation explicitly but cannot eliminate it.
Circularity Check
The recession tracer R_tr/R_ISCO = L_exp/L_obs is a fitted-input-as-prediction: the exponential baseline is fit to soft-state data, then the post-break deficit is relabeled as disk recession by construction; the timing cross-check is qualitative and shares the same transition driver.
-
fitted input called prediction
[Section 3, Equation (4) and surrounding text]
"Following the approach of B. You et al. (2023), we assume that this soft state exponential baseline approximately persists through the subsequent transition. Combined with Equation 2, a thermal disk luminosity deficit relative to the extrapolated baseline can be interpreted as a reduction in the disk accretion efficiency due to the outward recession of the optically thick disk. ... Comparing this expected luminosity with the observed disk luminosity L_obs_d(t) gives R_tr(t)/R_ISCO = L_exp_d(t) / L_obs_d(t). (4)"
The exponential baseline L_exp(t) = A*exp(-(t-t_start)/tau) is fitted to soft-state data (parameters A, tau, t_start, t_end determined by MCMC in Appendix B). Equation (4) then defines R_tr/R_ISCO as the ratio L_exp/L_obs. By construction, whenever L_obs falls below the fitted extrapolation, R_tr/R_ISCO exceeds 1. The 'prediction' of disk recession is thus mathematically equivalent to observing that the post-break luminosity drops below the fitted trend — there is no independent input that could produce a different conclusion. The paper does not verify the load-bearing assumption (that mass inflow rate continues exponentially) with an independent test; the total-luminosity check (L_disk + L_Comp vs. L_exp) that would falsify or confirm this is not performed.
-
self citation load bearing
[Section 3, first paragraph; Section 5.2]
"Following the approach of B. You et al. (2023), we assume that this soft state exponential baseline approximately persists through the subsequent transition."
The central assumption — that the soft-state exponential mass-inflow baseline persists through the transition — is the load-bearing premise that converts a luminosity deficit into a geometric recession tracer. This assumption is justified solely by citing B. You et al. (2023), where co-author Bei You is the corresponding author of the present paper. The cited work itself studied MAXI J1820+070 and adopted the same exponential-persistence assumption by ansatz, not by independent verification. The paper acknowledges the tension in Section 5.2 but does not test it against an external benchmark. The irradiation-radius check (Figure 4) only rules out one alternative (complete irradiation loss), not the broader class of mass-inflow deviations.
full rationale
The paper's central result, R_tr/R_ISCO = L_exp/L_obs (Eq. 4), is constructed by fitting an exponential to soft-state data and then defining the post-break luminosity deficit as disk recession. This is a fitted-input-called-prediction pattern: the 'recession' is mathematically forced whenever the observed luminosity drops below the extrapolated fit. The paper is transparent about this — it calls the result a 'model-defined tracer' and acknowledges in Section 5.2 that the deficit could also reflect coronal redistribution or mass-supply changes rather than geometric recession. The timing cross-check (Section 4.2) provides qualitative consistency but does not independently constrain the mass inflow rate, since both the recession tracer and timing frequencies are driven by the same underlying transition. The self-citation to B. You et al. (2023) for the exponential-persistence assumption is load-bearing but not uniquely circular, as the assumption is physically motivated by irradiated-disk theory (King & Ritter 1998). The score of 4 reflects that the central claim has genuine empirical content (24 outbursts, systematic spectral-timing coherence) but the headline tracer reduces to its fitted input by construction, and the key falsification test (total luminosity tracking the baseline) is not performed.
Assumptions & free parameters
free parameters (8)
- A (exponential normalization) =
varies per outburst; e.g. 59.86e37 erg/s for 4U 1543-47
- tau (decay timescale) =
varies; e.g. 9.4 days for 4U 1543-47
- t_start, t_end (baseline interval boundaries) =
varies per outburst
- kT_e (electron temperature) =
150 keV (fixed)
- sigma_int (intrinsic scatter) =
0.05
- f_out (out-of-interval down-weighting factor) =
5
- C_irr (irradiation parameter) =
5e-3
- gamma (recession slope) =
varies per outburst
assumptions (4)
- domain assumption The disk mass inflow rate continues to follow the soft-state exponential decay after the luminosity break.
- standard math L_d ∝ M_dot / R_tr (Eq. 2): disk luminosity scales inversely with the truncation radius.
- domain assumption The disk extends to the ISCO during the soft state, so R_tr ≈ R_ISCO is constant.
- domain assumption The color correction factor f_col does not vary significantly during the transition.
Cite this review
Pith. "Pith review of The disk luminosity deficit as a tracer of receding disk during Soft-to-Hard transitions in Black Hole X-ray Binaries." pith.science (2026). https://pith.science/paper/V5NIYYEO
@misc{pith2026260705249,
  author       = {Pith},
  title        = {Pith review of: The disk luminosity deficit as a tracer of receding disk during Soft-to-Hard transitions in Black Hole X-ray Binaries},
  year         = {2026},
  howpublished = {\url{https://pith.science/paper/V5NIYYEO}},
  note         = {Machine review of arXiv:2607.05249}
}
read the original abstract
Tracing the evolution of the thin accretion disk during the soft-to-hard state transition in black hole X-ray binaries (BHXRBs) remains difficult because conventional spectral estimates of the disk inner radius become highly model-dependent once the thermal component weakens. We present evidence that the thin disk recedes during this transition, obtained from a systematic study of RXTE/PCA observations of 26 BHXRBs. In 24 outbursts, the disk luminosity decays exponentially in the soft state, then drops significantly below the extrapolated baseline. This thermal luminosity deficit is considered a signature of reduced accretion efficiency, caused by the outward receding of the optically thick disk. Under this framework, we found that the estimated characteristic truncation radius increases rapidly as the systems evolve through the soft-to-hard transition. This interpretation is supported by timing analysis: in observations with well-constrained power density spectra, the characteristic frequencies of broadband noise and low-frequency QPOs generally decrease as the inferred truncation radius increases, consistent with the expansion of a hot inner flow. The onset and rapidity of recession vary substantially across different sources and outbursts. Our results demonstrate that luminosity deficits provide a practical empirical tracer of thin disk receding during soft-to-hard transitions, when direct spectral radius measurements become unreliable.
Figures


Figures from the paper (7 more)




Reference graph
Works this paper leans on
-
[1]
2020, A&A, 637, A47, doi: 10.1051/0004-6361/202037577
Aneesha, U., & Mandal, S. 2020, A&A, 637, A47, doi: 10.1051/0004-6361/202037577
-
[2]
Arnaud, K. A. 1996, in Astronomical Society of the Pacific Conference Series, Vol. 101, Astronomical Data Analysis Software and Systems V, ed. G. H. Jacoby & J. Barnes, 17
work page 1996
-
[3]
2023, A&A, 675, A199, doi: 10.1051/0004-6361/202346522
Avakyan, A., Neumann, M., Zainab, A., et al. 2023, A&A, 675, A199, doi: 10.1051/0004-6361/202346522
-
[4]
Basak, R., Zdziarski, A. A., Parker, M., & Islam, N. 2017, MNRAS, 472, 4220, doi: 10.1093/mnras/stx2283
-
[5]
P., Homan, J., Campana, S., & van der Klis, M
Belloni, T., Colombo, A. P., Homan, J., Campana, S., & van der Klis, M. 2002a, A&A, 390, 199, doi: 10.1051/0004-6361:20020703
-
[6]
2002b, ApJ, 572, 392, doi: 10.1086/340290
Belloni, T., Psaltis, D., & van der Klis, M. 2002b, ApJ, 572, 392, doi: 10.1086/340290
-
[7]
Belloni, T. M., & Motta, S. E. 2016, in Astrophysics and Space Science Library, Vol. 440, Astrophysics of Black Holes: From Fundamental Aspects to Latest Developments, ed. C. Bambi, 61, doi: 10.1007/978-3-662-52859-4 2
-
[8]
Beloborodov, A. M. 1999, ApJL, 510, L123, doi: 10.1086/311810
Show all 57 references
-
[9]
M., Casares, J., Mu˜ noz-Darias, T., et al
Corral-Santana, J. M., Casares, J., Mu˜ noz-Darias, T., et al. 2016, A&A, 587, A61, doi: 10.1051/0004-6361/201527130
2016 doi
- [10]
-
[11]
2001, A&A, 373, 251, doi: 10.1051/0004-6361:20010632
Dubus, G., Hameury, J.-M., & Lasota, J.-P. 2001, A&A, 373, 251, doi: 10.1051/0004-6361:20010632
2001 doi
-
[12]
1999, MNRAS, 303, 139, doi: 10.1046/j.1365-8711.1999.02212.x
Dubus, G., Lasota, J.-P., Hameury, J.-M., & Charles, P. 1999, MNRAS, 303, 139, doi: 10.1046/j.1365-8711.1999.02212.x
1999 doi
-
[13]
A., McClintock, J
Esin, A. A., McClintock, J. E., & Narayan, R. 1997, ApJ, 489, 865, doi: 10.1086/304829 Gierli´ nski, M., Done, C., & Page, K. 2008, MNRAS, 388, 753, doi: 10.1111/j.1365-2966.2008.13431.x Gierli´ nski, M., & Newton, J. 2006, MNRAS, 370, 837, doi: 10.1111/j.1365-2966.2006.10514.x
1997 doi
- [14]
-
[15]
2005, Ap&SS, 300, 107, doi: 10.1007/s10509-005-1197-4
Homan, J., & Belloni, T. 2005, Ap&SS, 300, 107, doi: 10.1007/s10509-005-1197-4
2005 doi
-
[16]
2011, MNRAS, 415, 2323, doi: 10.1111/j.1365-2966.2011.18860.x
Ingram, A., & Done, C. 2011, MNRAS, 415, 2323, doi: 10.1111/j.1365-2966.2011.18860.x
2011 doi
-
[17]
Ingram, A., Done, C., & Fragile, P. C. 2009, MNRAS, 397, L101, doi: 10.1111/j.1745-3933.2009.00693.x
2009 doi
-
[18]
R., & Motta, S
Ingram, A. R., & Motta, S. E. 2019, NewAR, 85, 101524, doi: 10.1016/j.newar.2020.101524
2019 doi
-
[19]
Kalemci, E., Kara, E., & Tomsick, J. A. 2022, in Handbook of X-ray and Gamma-ray Astrophysics, ed. C. Bambi & A. Sangangelo, 9, doi: 10.1007/978-981-16-4544-0 100-1
2022 doi
-
[20]
F., Fabian, A
Kara, E., Steiner, J. F., Fabian, A. C., et al. 2019, Nature, 565, 198, doi: 10.1038/s41586-018-0803-x
2019 doi
-
[21]
R., & Ritter, H
King, A. R., & Ritter, H. 1998, MNRAS, 293, L42, doi: 10.1046/j.1365-8711.1998.01295.x K¨ onig, O., Steiner, J. F., Bollemeijer, N., et al. 2026, arXiv preprint arXiv:2604.14693
1998 doi
-
[22]
A., Darbro, W., Elsner, R
Leahy, D. A., Darbro, W., Elsner, R. F., et al. 1983, ApJ, 266, 160, doi: 10.1086/160766
1983 doi
-
[23]
F., & Qiao, E
Liu, B. F., & Qiao, E. 2022, iScience, 25, 103544, doi: 10.1016/j.isci.2021.103544
2022 doi
-
[24]
Lyubarskii, Y. E. 1997, MNRAS, 292, 679, doi: 10.1093/mnras/292.3.679
1997 doi
-
[25]
Maccarone, T. J. 2003, A&A, 409, 697, doi: 10.1051/0004-6361:20031146
2003 doi
-
[26]
1986, ApJ, 308, 635, doi: 10.1086/164534
Makishima, K., Maejima, Y., Mitsuda, K., et al. 1986, ApJ, 308, 635, doi: 10.1086/164534
1986 doi
-
[27]
M., & Poutanen, J
Malzac, J., Beloborodov, A. M., & Poutanen, J. 2001, in American Institute of Physics Conference Series, Vol. 587, Gamma 2001: Gamma-Ray Astrophysics, ed. S. Ritz, N. Gehrels, & C. R. Shrader (AIP), 111–115, doi: 10.1063/1.1419382
2001 doi
-
[28]
C., & Ross, R
Merloni, A., Fabian, A. C., & Ross, R. R. 2000, MNRAS, 313, 193, doi: 10.1046/j.1365-8711.2000.03226.x
2000 doi
-
[29]
1984, PASJ, 36, 741, doi: 10.1093/pasj/36.4.741
Mitsuda, K., Inoue, H., Koyama, K., et al. 1984, PASJ, 36, 741, doi: 10.1093/pasj/36.4.741
1984 doi
-
[30]
1991, ApJ, 383, 784, doi: 10.1086/170837
Ebisawa, K. 1991, ApJ, 383, 784, doi: 10.1086/170837
1991 doi
-
[31]
1995, ApJ, 452, 710, doi: 10.1086/176343
Narayan, R., & Yi, I. 1995, ApJ, 452, 710, doi: 10.1086/176343
1995 doi
-
[32]
2014, A&A, 564, A37, doi: 10.1051/0004-6361/201322268
Fender, R. 2014, A&A, 564, A37, doi: 10.1051/0004-6361/201322268
2014 doi
-
[33]
Poutanen, J., Veledina, A., & Zdziarski, A. A. 2018, A&A, 614, A79, doi: 10.1051/0004-6361/201732345
2018 doi
-
[34]
R., Haswell, C
Powell, C. R., Haswell, C. A., & Falanga, M. 2007, MNRAS, 374, 466, doi: 10.1111/j.1365-2966.2006.11144.x
2007 doi
- [35]
-
[36]
A., & King, A
Shahbaz, T., Charles, P. A., & King, A. R. 1998, MNRAS, 301, 382, doi: 10.1046/j.1365-8711.1998.01991.x
1998 doi
-
[37]
I., & Sunyaev, R
Shakura, N. I., & Sunyaev, R. A. 1973, A&A, 24, 337
1973
-
[38]
1995, ApJ, 445, 780, doi: 10.1086/175740
Shimura, T., & Takahara, F. 1995, ApJ, 445, 780, doi: 10.1086/175740
1995 doi
-
[39]
C., Zhang, S., Chen, Y
Shui, Q. C., Zhang, S., Chen, Y. P., et al. 2023, ApJ, 943, 165, doi: 10.3847/1538-4357/aca7b8 21
2023 doi
-
[40]
J., McClintock, J
Sobczak, G. J., McClintock, J. E., Remillard, R. A., Bailyn, C. D., & Orosz, J. A. 1999, ApJ, 520, 776, doi: 10.1086/307474
1999 doi
- [41]
-
[42]
E., Dubus, G., Lasota, J.-P., Heinke, C
Tetarenko, B. E., Dubus, G., Lasota, J.-P., Heinke, C. O., & Sivakoff, G. R. 2018a, MNRAS, 480, 2, doi: 10.1093/mnras/sty1798
-
[43]
E., Lasota, J.-P., Heinke, C
Tetarenko, B. E., Lasota, J.-P., Heinke, C. O., Dubus, G., & Sivakoff, G. R. 2018b, Nature, 554, 69, doi: 10.1038/nature25159
-
[44]
R., Wynn, G
Truss, M. R., Wynn, G. A., Murray, J. R., & King, A. R. 2002, MNRAS, 337, 1329, doi: 10.1046/j.1365-8711.2002.05986.x
2002 doi
-
[45]
Tuchman, Y., Mineshige, S., & Wheeler, J. C. 1990, ApJ, 359, 164, doi: 10.1086/169045
1990 doi
-
[46]
1999, ApJ, 514, 939, doi: 10.1086/306993
Wijnands, R., & van der Klis, M. 1999, ApJ, 514, 939, doi: 10.1086/306993
1999 doi
-
[47]
2000, ApJ, 542, 914, doi: 10.1086/317016
Wilms, J., Allen, A., & McCray, R. 2000, ApJ, 542, 914, doi: 10.1086/317016
2000 doi
-
[48]
2025, ApJ, 993, 40, doi: 10.3847/1538-4357/ae058a
Xu, S.-E., You, B., Long, Y., & He, H. 2025, ApJ, 993, 40, doi: 10.3847/1538-4357/ae058a
2025 doi
-
[49]
2026, Nature Communications, 17, 2860, doi: 10.1038/s41467-026-69604-9
You, B., Yu, W., Ingram, A., et al. 2026, Nature Communications, 17, 2860, doi: 10.1038/s41467-026-69604-9
2026 doi
-
[50]
2021, Nature Communications, 12, 1025, doi: 10.1038/s41467-021-21169-5
You, B., Tuo, Y., Li, C., et al. 2021, Nature Communications, 12, 1025, doi: 10.1038/s41467-021-21169-5
2021 doi
-
[51]
2023, Science, 381, 961, doi: 10.1126/science.abo4504
You, B., Cao, X., Yan, Z., et al. 2023, Science, 381, 961, doi: 10.1126/science.abo4504
2023 doi
-
[52]
2014, ARA&A, 52, 529, doi: 10.1146/annurev-astro-082812-141003
Yuan, F., & Narayan, R. 2014, ARA&A, 52, 529, doi: 10.1146/annurev-astro-082812-141003
2014 doi
- [53]
-
[54]
A., Marcel, G., Veledina, A., Olejak, A., & Lanˇ cov´ a, D
Zdziarski, A. A., Marcel, G., Veledina, A., Olejak, A., & Lanˇ cov´ a, D. 2026b, NewAR, 102, 101746, doi: 10.1016/j.newar.2025.101746
2025 doi
-
[55]
A., Szanecki, M., Poutanen, J., Gierli´ nski, M., & Biernacki, P
Zdziarski, A. A., Szanecki, M., Poutanen, J., Gierli´ nski, M., & Biernacki, P. 2020, MNRAS, 492, 5234, doi: 10.1093/mnras/staa159
2020 doi
-
[56]
A., You, B., Szanecki, M., Li, X.-B., & Ge, M
Zdziarski, A. A., You, B., Szanecki, M., Li, X.-B., & Ge, M. 2022, ApJ, 928, 11, doi: 10.3847/1538-4357/ac54a7
2022 doi
-
[57]
2025, ApJ, 985, 258, doi: 10.3847/1538-4357/adcf1d
Zhan, Y., You, B., Ingram, A., Jiang, W., & Wang, F. 2025, ApJ, 985, 258, doi: 10.3847/1538-4357/adcf1d
2025 doi
Reviewed July 7, 2026 · model on record in the stance chip above.
Discussion (0). Continue with ORCID to comment.