Two-Stage Optimization for Dynamic Line Rating and Energy Storage Deployment
Pith reviewed 2026-06-26 07:03 UTC · model grok-4.3
The pith
A two-stage optimization jointly places dynamic line ratings and energy storage to raise transmission capacity and reduce congestion under weather changes.
A machine-rendered reading of the paper's core claim, the machinery that carries it, and where it could break.
Core claim
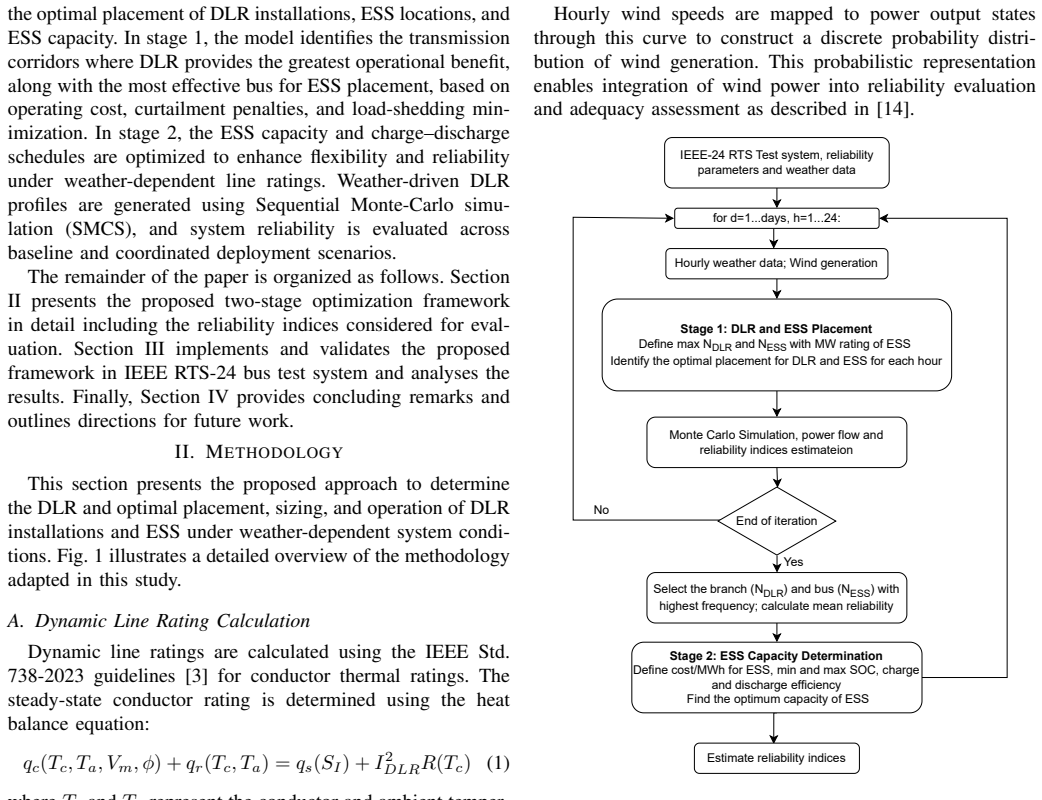
The two-stage mixed-integer linear program first selects DLR corridors and ESS buses to minimize operating cost, DER curtailment, and load-shedding penalties under DC power flow and investment limits; the second stage then fixes the chosen locations and determines ESS energy capacities and hourly schedules under ambient-driven DLR profiles. Sequential Monte Carlo simulation with weather-generated DLR profiles confirms that the joint deployment raises transfer capability and strengthens adequacy on the modified IEEE RTS 24-bus system.
What carries the argument
Two-stage mixed-integer linear program that selects DLR and ESS locations in stage one and sizes/operates ESS under weather-driven ratings in stage two.
If this is right
- Coordinated DLR and ESS deployment increases effective transmission capacity without new line construction.
- The method reduces DER curtailment and load-shedding penalties under variable weather.
- Sequential Monte Carlo evaluation confirms higher system adequacy when both technologies are sited together.
- Ambient weather data directly drives line rating profiles used in the optimization.
Where Pith is reading between the lines
- The same two-stage structure could be adapted to include other flexible assets such as demand response.
- Extending the model to AC power flow would test whether the reported gains hold when reactive power and voltage limits are considered.
- Applying the approach to larger networks would reveal whether the computational cost scales acceptably for real planning studies.
Load-bearing premise
The DC power flow equations and weather-based line rating curves accurately represent the real thermal limits and power flow behavior of the test network.
What would settle it
Running the same optimization on a real transmission corridor with measured line temperatures and actual weather data shows no net reduction in congestion or load shedding.
Figures
read the original abstract
The increasing penetration of distributed energy resources (DER) and weather-driven variability has intensified congestion and reliability stress in transmission networks. Strategies that enhance the utilization of existing infrastructure, such as static line ratings (SLR) and energy storage systems (ESS), have therefore become necessary. SLRs rely on conservative ambient assumptions and often understate thermal limits, whereas dynamic line ratings (DLR) adjust capacity according to weather conditions and unlock additional transfer capability. Energy storage systems provide temporal flexibility, but their transmission-level effectiveness depends on proper siting and sizing. This paper proposes a two-stage optimization method for joint placement of DLR installations and utility-scale energy storage. In the first stage, a mixed-integer linear program selects DLR corridors and ESS buses by minimizing operating cost, DER curtailment, and load-shedding penalties subject to DC power flow and investment constraints. In the second stage, the model determines ESS energy capacity and operating schedules under ambient-driven line ratings. Ambient weather data is used to generate DLR profiles, and sequential Monte Carlo simulation is applied to assess system adequacy. The proposed method, when deployed on the modified IEEE RTS 24-bus system, shows that coordinated DLR and ESS planning improves transmission capability, mitigates congestion, and strengthens system adequacy under weather variability.
Editorial analysis
A structured set of objections, weighed in public.
Referee Report
Summary. The paper claims that a two-stage MILP optimization for joint DLR corridor selection and ESS placement/sizing, with stage 1 minimizing costs subject to DC power flow and investment constraints and stage 2 determining capacities/schedules under ambient-driven DLR profiles, improves transmission capability, mitigates congestion, and strengthens adequacy on the modified IEEE RTS 24-bus system when evaluated via sequential Monte Carlo simulation under weather variability.
Significance. If the modeling assumptions hold, the coordinated two-stage framework could provide a practical planning tool for enhancing existing transmission utilization with increasing DER penetration and weather variability, potentially reducing the need for new infrastructure while improving reliability metrics.
major comments (1)
- [Abstract] Abstract: The optimization relies on a DC power flow model together with ambient-weather-generated DLR profiles. DCOPF omits reactive power, voltage magnitudes, and losses, which directly alter computed line loadings and therefore the effective DLR values driving the reported congestion mitigation and adequacy improvements on the modified IEEE RTS 24-bus system. This modeling choice is load-bearing for all quantitative claims and requires explicit validation (e.g., comparison to AC solutions or measured DLR data) to support the results.
minor comments (1)
- [Abstract] Abstract: The summary provides no equations, quantitative results, error analysis, or specific formulation details, making technical verification difficult from the provided description alone.
Simulated Author's Rebuttal
We thank the referee for the constructive feedback on our modeling approach. We address the major comment point by point below.
read point-by-point responses
-
Referee: [Abstract] Abstract: The optimization relies on a DC power flow model together with ambient-weather-generated DLR profiles. DCOPF omits reactive power, voltage magnitudes, and losses, which directly alter computed line loadings and therefore the effective DLR values driving the reported congestion mitigation and adequacy improvements on the modified IEEE RTS 24-bus system. This modeling choice is load-bearing for all quantitative claims and requires explicit validation (e.g., comparison to AC solutions or measured DLR data) to support the results.
Authors: We acknowledge that the DC optimal power flow (DCOPF) approximation omits reactive power, voltage magnitudes, and losses, which can influence computed line loadings and thus the effective utilization of dynamic line ratings (DLR). This is a standard limitation of DC models. However, DCOPF is widely employed in transmission expansion and planning studies involving mixed-integer linear programming (MILP) because it preserves linearity and enables tractable optimization of joint DLR corridor selection and energy storage system (ESS) investment decisions under weather-driven profiles. The modified IEEE RTS 24-bus system is a benchmark where DC-based models are routinely applied for congestion and adequacy analyses (e.g., in numerous DLR and ESS planning papers). The abstract and methodology already specify the use of DC power flow, making the quantitative claims conditional on this approximation. To strengthen the manuscript, we will add an explicit discussion subsection on DCOPF assumptions, their implications for DLR-driven results, and supporting references from the literature on DC model accuracy for similar problems. A full AC validation or comparison to measured DLR data would necessitate reformulating the problem as a mixed-integer nonlinear program, which is computationally prohibitive for the two-stage framework and beyond the current scope; we will note this as a direction for future work. revision: partial
Circularity Check
No circularity; no derivation chain or equations present to inspect
full rationale
The abstract and description describe a two-stage MILP for joint DLR/ESS placement on the IEEE RTS 24-bus system using DC power flow and ambient-generated DLR profiles, followed by Monte Carlo adequacy assessment. No equations, first-principles derivations, fitted parameters presented as predictions, or self-citations are visible in the provided text. The central claims are simulation outcomes on a standard test case under stated modeling assumptions; these do not reduce to self-definition or input renaming by construction. This is the expected non-finding when no load-bearing mathematical steps are exhibited.
Axiom & Free-Parameter Ledger
Reference graph
Works this paper leans on
-
[1]
Queued up: Characteristics of power plants seeking transmission interconnection,
U.S. Department of Energy, “Queued up: Characteristics of power plants seeking transmission interconnection,” tech. rep., DOE, 2024
2024
-
[2]
Queued up...but in need of transmission,
U.S. Department of Energy, “Queued up...but in need of transmission,” tech. rep., DOE, 2022
2022
-
[3]
IEEE Standard for Calculating the Current-Temperature Rela- tionship of Bare Overhead Conductors,
IEEE, “IEEE Standard for Calculating the Current-Temperature Rela- tionship of Bare Overhead Conductors,”IEEE Std 738-2023 (Revision of IEEE Std 738-2012), pp. 1–56, 2023
2023
-
[4]
Leveraging the existing German transmis- sion grid with dynamic line rating,
P. Glaum and F. Hofmann, “Leveraging the existing German transmis- sion grid with dynamic line rating,”Applied Energy, vol. 343, p. 121199, 2023
2023
-
[5]
Impacts of dynamic line ratings on the ERCOT transmission system,
T. Lee, V . J. Nair, and A. Sun, “Impacts of dynamic line ratings on the ERCOT transmission system,” in2022 North American Power Symposium (NAPS), pp. 1–6, IEEE, 2022
2022
-
[6]
Two- stage optimization framework for dynamic line rating implementation,
A. Abdelkader, C. Chaudhary, Y . Pei, M. Benidris, and J. Mitra, “Two- stage optimization framework for dynamic line rating implementation,” inIEEE PES Transmission and Distribution Conference and Exposition (T&D), (Chicago, IL, USA), 2026. Accepted
2026
-
[7]
Dynamic rating of transmission lines, transformers, traps and current transformers,
D. L. Stuehm and J. Mitra, “Dynamic rating of transmission lines, transformers, traps and current transformers,” tech. rep., Department of Electrical and Computer Engineering, North Dakota State University, Fargo, North Dakota 58105, June 2002. A Report Submitted to The Otter Tail Power Company
2002
-
[8]
Energy storage integration for grid reliability,
J. Sanchez, C. Chaudhary, M. Benidris, and J. Mitra, “Energy storage integration for grid reliability,” in18th International Conference on Probabilistic Methods Applied to Power Systems (PMAPS), pp. 1–6, 2024
2024
-
[9]
Energy storage as a service: optimal sizing for transmission congestion relief,
J. Arteaga, H. Zareipour, and N. Amjady, “Energy storage as a service: optimal sizing for transmission congestion relief,”Applied energy, vol. 298, p. 117095, 2021
2021
-
[10]
The role of energy storage with renewable electricity generation,
K. Kumar and B. Jaipal, “The role of energy storage with renewable electricity generation,” inElectric Grid Modernization, IntechOpen, 2022
2022
-
[11]
Optimal siting and sizing of energy storage system for power systems with large-scale wind power integration,
H. Zhao, Q. Wu, S. Huang, Q. Guo, H. Sun, and Y . Xue, “Optimal siting and sizing of energy storage system for power systems with large-scale wind power integration,” inIEEE Eindhoven PowerTech, pp. 1–6, 2015
2015
-
[12]
Understanding the benefits of dynamic line rating under multiple sources of uncertainty,
F. Teng, R. Dupin, A. Michiorri, G. Kariniotakis, Y . Chen, and G. Strbac, “Understanding the benefits of dynamic line rating under multiple sources of uncertainty,”IEEE Transactions on Power Systems, vol. 33, no. 3, pp. 3306–3314, 2018
2018
-
[13]
National Solar Radiation Database (NSRDB) Data Viewer
National Renewable Energy Laboratory (NREL), “National Solar Radiation Database (NSRDB) Data Viewer.” https://nsrdb.nrel.gov/ data-viewer
-
[14]
Development of a new procedure for reliability modeling of wind turbine generators,
P. Giorsetto and K. F. Utsurogi, “Development of a new procedure for reliability modeling of wind turbine generators,”IEEE Transactions on Power Apparatus and Systems, vol. PAS-102, no. 1, pp. 134–143, 1983
1983
-
[15]
Pulp: A linear programming toolkit for python
S. Mitchellet al., “Pulp: A linear programming toolkit for python.” https://github.com/coin-or/pulp, 2011. Version 2.7.0
2011
discussion (0)
Sign in with ORCID, Apple, or X to comment. Anyone can read and Pith papers without signing in.