REVIEW 2 major objections 5 minor 101 references
The AGORA High-Resolution Galaxy Simulations Comparison Project VII: Satellite quenching in zoom-in simulation of a Milky Way-mass halo
T0 review · 2 major / 5 minor · reviewed 2026-08-15 · deepseek-v4-flash
Pith's one-line read The paper argues that in a Milky Way-mass halo, strangulation and ram pressure stripping are the dominant satellite quenching mechanisms across five independent simulation codes, with the efficiency set by each satellite's…
desk verdict The quantitative quenching comparison across five codes is the real contribution; the ram-pressure-dominance claim is a plausible interpretation, not a measured result. read the letter →
The pith
A machine-rendered reading of the paper's core claim, the machinery that carries it, and where it could break.
The reading
What carries the argument
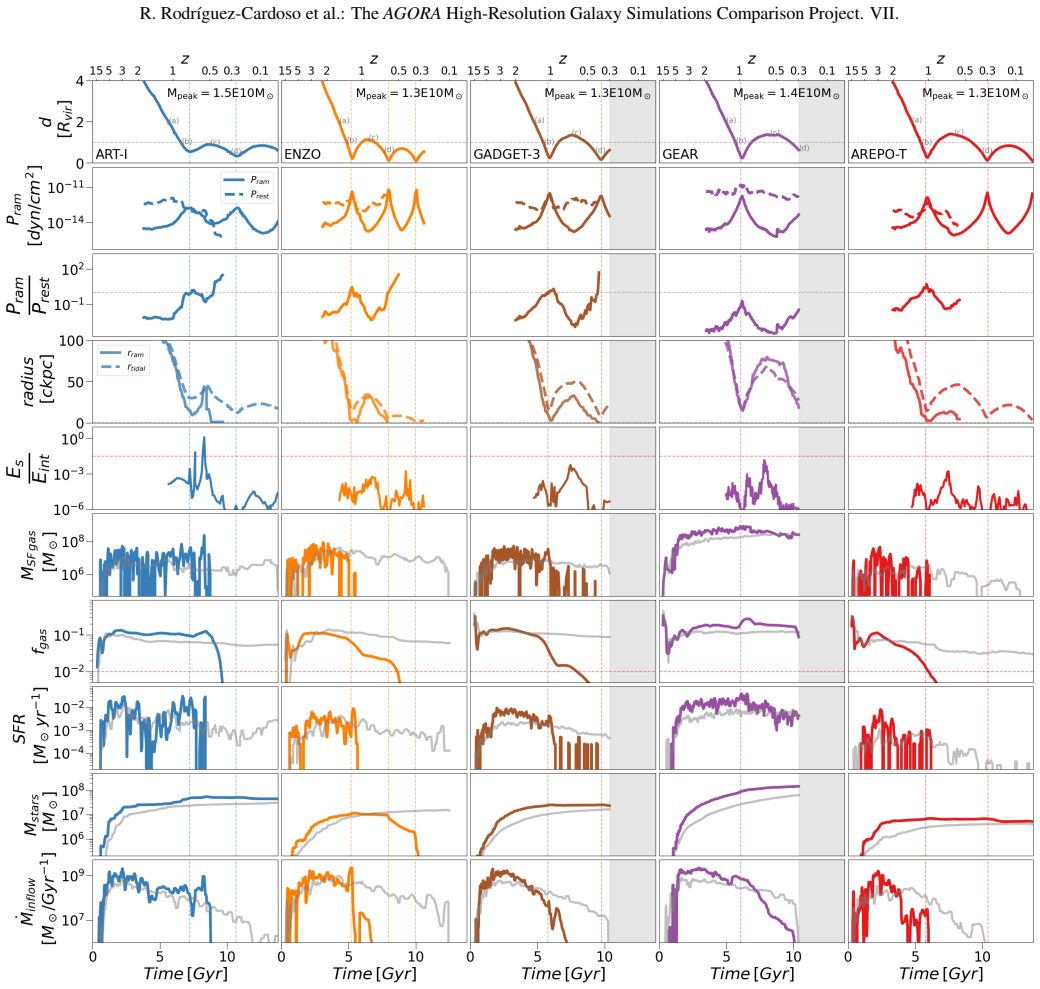
The carrying object is the AGORA CosmoRun comparison: five zoom-in simulations of the same ~$10^{12}\,M_\odot$ halo at $z=0$, sharing initial conditions, cooling, ultraviolet background, and star-formation criteria, but differing in hydrodynamic method (ART-I and ENZO on adaptive grids, GADGET-3 and GEAR as particle codes, AREPO-T on a moving mesh) and in supernova feedback. The argument runs on per-satellite diagnostics: the Gunn & Gott criterion $P_{\rm ram}=\rho_{\rm CGM}v_{\rm sat}^2$ against the restoring force $P_{\rm rest}$; the ram-pressure radius $r_{\rm ram}$ and tidal radius $r_{\rm tidal}$ compared with the half-gas radius; the harassment energy ratio $E_s/E_{\rm int}$; and tracked cold-gas inflow rates for strangulation. A particle-tracking subhalo pipeline keeps satellites alive through pericenters where standard halo finders lose them, which is what makes the mechanism comparison possible.
What would settle it
A survey of many Milky Way analogs that found most satellites above $\sim10^8\,M_\odot$ quenched, or a repeat of the same mechanism classification over many simulated hosts that found harassment or tidal stripping to be the leading gas-removal mechanism, would contradict the central claim.
Extended reading notes
Core claim
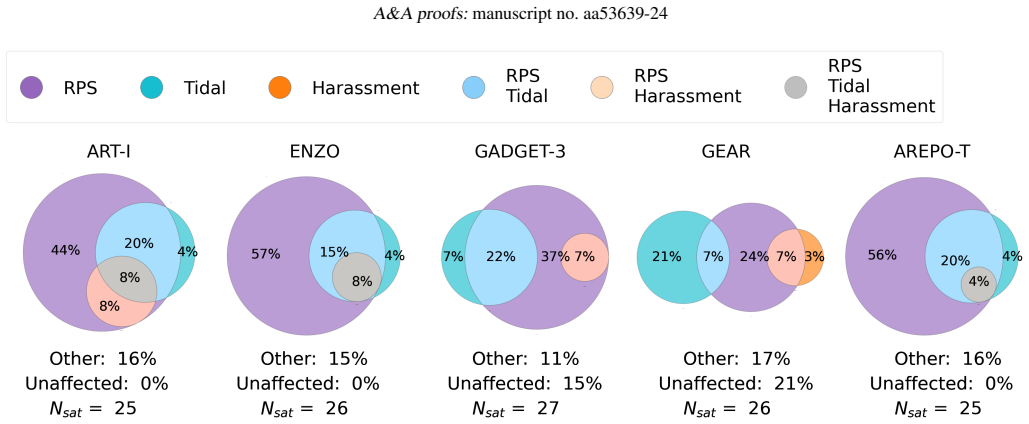
On the paper's own terms, the discovery is a convergence: when five codes — two grid-based, two particle-based, and one moving-mesh — simulate the same Milky Way-mass halo at high resolution, they agree on why satellites quench. Quenched fractions match the latest SAGA survey data within 1σ host-to-host scatter across all models, and the quenching-delay times follow the observed mass trend: the less massive the satellite, the faster it quenches. The shared mechanism is strangulation cutting off cold inflows for every satellite inside the virial-shocked halo, with ram pressure stripping as the main agent of gas removal, most effective below $M_* \sim 10^8\,M_\odot$. The models diverge in how quickly this happens, and the paper attributes that divergence to the satellites' restoring pressure — set by gas content and concentration, which supernova feedback controls — rather than to differences in the ram pressure the host exerts. A corollary is that the historical SPH-versus-grid differences do not appear to play a decisive role in this regime.
Load-bearing premise
The argument depends on the fixed numerical thresholds and visual inspection used to decide when a mechanism counts as the cause of gas removal, and on the assumption that this single simulated halo represents Milky Way-mass halos in general.
Editorial extensions
If this is right
- If the central claim holds, the dominant quenching mechanisms for Milky Way-mass hosts are not sensitive to hydrodynamic method: strangulation plus ram pressure stripping operate across grid, particle, and moving-mesh codes.
- Quenched fractions within the SAGA host-to-host 1σ scatter mean the observed spread among Milky Way analogs can plausibly arise from different feedback implementations rather than different assembly histories alone.
- The mass ladder of quenching timescales is robust: satellites below $\sim10^6\,M_\odot$ quench before infall, $10^6$–$10^7\,M_\odot$ quench rapidly by ram pressure, $10^7$–$10^8\,M_\odot$ need a full orbit with combined ram-pressure and tidal stripping, and satellites above $\sim10^8\,M_\odot$ resist stripping and quench only after depleting their gas.
- Since stripping efficiency is set mainly by the satellite's own gas content, supernova feedback in low-mass halos effectively controls how long a satellite survives before quenching.
- The convergence across hydro methods implies that the old grid-SPH discrepancy over fluid instabilities no longer dominates satellite quenching in this mass range.
Reading between the lines
- Beyond the paper: if the restoring-pressure picture is right, resolved gas observations of dwarf satellites around Milky Way analogs — their atomic gas fractions and radial gas distributions — become a direct probe of how efficiently supernova feedback expels gas from low-mass halos.
- Beyond the paper: the fixed thresholds used to classify mechanisms (imported from cluster studies) could be calibrated within these simulations by tracking individual gas parcels; the fractions of satellites assigned to each mechanism are testable predictions of that classification pipeline.
- Beyond the paper: applying the same pipeline to many simulated hosts would convert the predicted rise in quenched fraction as the host crosses $\sim5\times10^{11}\,M_\odot$ into a host-to-host scatter prediction that SAGA-style surveys could measure directly.
- Beyond the paper: the models disagree most for satellites above $\sim10^8\,M_\odot$ (one model quenches them, four do not), so this mass range is the most informative place for future surveys to discriminate between feedback implementations.
Signed reviews
Editorial analysis
A structured set of objections, weighed in public.
Referee Report
Summary. This paper analyzes satellite quenching in a single Milky Way-mass halo simulated with five cosmological zoom-in codes from the AGORA CosmoRun suite: ART-I, ENZO, GADGET-3, GEAR, and AREPO-T. The authors develop a particle-tracking extension of ROCKSTAR/Consistent-Trees to follow subhalos after the halo finder loses them, correct subhalo gas masses for CGM contamination in grid-based codes, and cross-validate these procedures against bound-particle measurements in Appendix A. They then compare quenched fractions and quenching delay times with the SAGA, ELVES, and Local Group data, and classify the contributions of ram pressure stripping, tidal stripping, harassment, and strangulation. The main claims are that quenched fractions are consistent with SAGA within its 1-sigma host-to-host scatter, that all models reproduce the observed trend that less massive satellites quench faster, and that strangulation plus ram pressure stripping are the dominant quenching mechanisms in all five codes, with quantitative differences driven mainly by satellite restoring pressures set by supernova feedback.
Significance. If the mechanism claim is accepted, this is a valuable contribution to galaxy-formation numerics: it shows qualitative convergence across five independent hydro codes and feedback implementations for a common initial condition, while tracing quantitative divergence to satellite gas content and restoring pressure. The methodological care is a genuine strength: particle-tracking versus ROCKSTAR comparisons, CGM-subtracted gas masses, inflow-rate cross-checks between particle and grid approaches, and alternative quenching definitions all support the robustness of the main trends. The single-halo limitation is real but explicitly acknowledged. The main risk is that the central mechanism attribution rests on threshold criteria and visual inspection rather than a quantitative gas-loss budget, as detailed below.
major comments (2)
- [3.4.3, Fig. 11; Eqs. (3)-(4)] The central claim that ram pressure stripping is the main gas-removal mechanism in all models is not supported by a quantitative accounting of gas-loss channels. A satellite is classified as ram-pressure-affected when P_ram > P_rest or r_ram < r_half,gas, and the timing is assessed by visual inspection of per-satellite evolution plots. Pericentric gas declines, however, can also be produced by star formation consumption, SN-driven outflows, or tidal stripping, and the models in this paper and Paper VI are known to differ strongly in outflow efficiency. The case study in Section 3.4.2 shows plausible ram pressure signatures but does not quantify how much gas each process removes. I recommend adding a gas budget (for example, tracked bound gas loss versus SFR consumption and SN ejection) or, failing that, softening the abstract and Section 4 item 5 to say that ram pressure stripping is consistent with being the dominant gas-removal mechanism rather than asserting this as established.
- [3.4.3, Fig. 13] The Venn-diagram fractions and the per-satellite classifications in Figure 13 carry no uncertainties and no sensitivity analysis. The underlying criteria are order-of-magnitude estimates, and the feedback-parameter α in Eq. (4) is imported from cluster studies without recalibration for Milky Way-mass hosts. Since the quantitative fractions are used to argue for cross-code convergence on the dominant mechanism, I would like to see a test of how the Venn-diagram percentages change when the thresholds are varied (for example, α between 0.5 and 2, and the harassment threshold around log(Es/Eint) = -1.5), or an explicit statement that only the qualitative ranking, not the exact fractions, is robust.
minor comments (5)
- [2.3] The quiescence condition (ii) is written as M_SF,gas < m_gas,IC = 3.39e5 M_sun, while Section 2.2 defines the galaxy mass threshold as six times the approximate particle mass resolution and quotes the same numerical value; please clarify whether the factor of six also applies to the star-forming gas threshold, since this matters for satellites near the resolution limit.
- [3.4.1] There is a typo in 'apporach' (should be 'approach'); please proofread.
- [3.2, Fig. 7] The comparison with z=0 observational surveys is made using f_q measured at z~0.3, which the authors correctly identify as a lower limit. It would strengthen the paper to also quote the expected upward evolution of f_q between z~0.3 and z=0, for example by extrapolating the trends in Figure 6, rather than only stating the direction of the bias.
- [References] Some references appear twice (Brown et al. 2014 and Greene et al. 2023); please unify the bibliography.
- [Fig. 12] The color coding in the bottom row of Figure 12 is not self-explanatory; a legend or explicit mapping between colors and mechanisms would improve readability.
Circularity Check
No significant circularity: quenching fractions, timescales, and mechanism attributions are simulation outputs compared against external surveys and literature thresholds, not fitted inputs or self-citation-derived predictions.
full rationale
I walked the paper's derivation chain from the CosmoRun initial conditions and code-specific feedback implementations through satellite identification, quenching definitions, timescale measurements, and mechanism classification. The central results — quenched fractions, quenching delay times, and the dominance of strangulation plus ram pressure stripping — are outputs of the simulations, not parameters fitted to the SAGA or ELVES data they are compared against. The observational comparisons are external benchmarks with stated caveats (e.g., the f_q computed between z=1 and z~0.3 is interpreted as a lower limit relative to z=0 data), so there is no fitted-input-called-prediction pattern. The mechanism thresholds (P_ram > P_rest, r_ram < r_half,gas, r_tidal < r_half,gas, log(Es/Eint) > -1.5) are adopted from prior literature (Gunn & Gott 1972; McCarthy et al. 2007; Marasco et al. 2016) and applied uniformly across all codes; there is no indication they were adjusted to produce the paper's conclusions. The paper explicitly notes that threshold-based classification is supplemented by visual inspection of per-satellite evolution plots, and while this is a methodological correctness risk if the thresholds misattribute gas loss, it is not a circular reduction: the classification criteria are not defined in terms of the quenching outcomes they are used to explain. Self-citations to AGORA Papers III–VI provide the simulation setup, calibration history, satellite population context, and CGM properties, but the load-bearing claim that ram pressure stripping is the dominant gas-removal mechanism is established by the present paper's own measured quantities (ram pressure, restoring pressure, tidal radius, inflow rates, gas mass evolution). The discussion of restoring-pressure differences being aligned with Paper VI's outflow-efficiency results is interpretive linkage, not the derivation of the main claim. The acknowledged single-halo limitation and the absence of a quantitative gas-loss budget are validity caveats, not evidence of circularity. I therefore find no step where a prediction reduces by construction to its inputs, and no load-bearing self-citation chain.
Assumptions & free parameters
free parameters (6)
- Quiescence lookback window =
200 Myr
- Star-forming gas threshold =
T < 10^4 K and n_H > 1 cm^-3
- Ram pressure stripping criterion =
P_ram > P_rest or r_ram < r_half,gas
- Tidal stripping criterion =
r_tidal < r_half,gas
- Harassment energy threshold =
log(Es/Eint) > -1.5
- Minimum galaxy stellar mass =
3.39e5 Msun (6 times gas particle mass)
assumptions (4)
- domain assumption The particle-tracking method assumes no new particles are accreted by a subhalo during its infall into the host halo.
- domain assumption The spherically averaged CGM density profile correctly represents the host gas that contaminates a subhalo's virial sphere.
- domain assumption The single simulated halo is representative of Milky Way-mass halos for satellite quenching trends.
- domain assumption The five codes share a common physical core, including GRACKLE cooling, UV background, and star formation criteria, so differences reflect feedback and hydro method choices.
Cite this review
Pith. "Pith review of The AGORA High-Resolution Galaxy Simulations Comparison Project VII: Satellite quenching in zoom-in simulation of a Milky Way-mass halo." pith.science (2026). https://pith.science/paper/V6U6GQC7
@misc{pith2026250505844,
  author       = {Pith},
  title        = {Pith review of: The AGORA High-Resolution Galaxy Simulations Comparison Project VII: Satellite quenching in zoom-in simulation of a Milky Way-mass halo},
  year         = {2026},
  howpublished = {\url{https://pith.science/paper/V6U6GQC7}},
  note         = {Machine review of arXiv:2505.05844}
}
abstract
Context: Satellite galaxies experience multiple physical processes when interacting with their host halos, often leading to the quenching of star formation. In the Local Group (LG), satellite quenching has been shown to be highly efficient, affecting nearly all satellites except the most massive ones. While recent surveys are studying Milky Way (MW) analogs to assess how representative our LG is, the dominant physical mechanisms behind satellite quenching in MW-mass halos remain under debate. Aims: We analyze satellite quenching within the same MW-mass halo, simulated using various widely-used astrophysical codes, each using different hydrodynamic methods and implementing different supernovae feedback recipes. The goal is to determine whether quenched fractions, quenching timescales and the dominant quenching mechanisms are consistent across codes or if they show sensitivity to the specific hydrodynamic method and supernovae (SNe) feedback physics employed. Methods: We use a subset of high-resolution cosmological zoom-in simulations of a MW-mass halo from the multiple-code AGORA CosmoRun suite. Results: We find that the quenched fraction is consistent with the latest SAGA survey results within its 1$\sigma$ host-to-host scatter across all the models. Regarding quenching timescales, all the models reproduce the trend observed in the ELVES survey, LG observations, and previous simulations: the less massive the satellite, the shorter its quenching timescale. All our models converge on the dominant quenching mechanisms: strangulation halts cold gas accretion and ram pressure stripping is the predominant mechanism for gas removal, particularly effective in satellites with $M_* < 10^8\, M_\odot$. Nevertheless, the efficiency of the stripping mechanisms differs among the codes, showing a strong sensitivity to the different SNe feedback implementations and/or hydrodynamic methods employed.
Figures


Figures from the paper (11 more)





Reference graph
Works this paper leans on
-
[1]
G., Moore, B., & Bower, R
Abadi, M. G., Moore, B., & Bower, R. G. 1999, MNRAS, 308, 947
1999
-
[2]
2007, MNRAS, 380, 963
Agertz, O., Moore, B., Stadel, J., et al. 2007, MNRAS, 380, 963
2007
-
[3]
B., Christensen, C
Akins, H. B., Christensen, C. R., Brooks, A. M., et al. 2021, ApJ, 909, 139
2021
-
[4]
R., et al
Behroozi, P., Knebe, A., Pearce, F. R., et al. 2015, MNRAS, 454, 3020
2015
-
[5]
S., Wechsler, R
Behroozi, P. S., Wechsler, R. H., Wu, H.-Y ., et al. 2012b, ApJ, 763, 18 Benítez-Llambay, A., Navarro, J. F., Abadi, M. G., et al. 2015, MNRAS, 450, 4207
2015
-
[6]
& Tremaine, S
Binney, J. & Tremaine, S. 2008, Galactic Dynamics: Second Edition
2008
-
[7]
& Dekel, A
Birnboim, Y . & Dekel, A. 2003, MNRAS, 345, 349
2003
-
[9]
M., Tumlinson, J., Geha, M., et al
Brown, T. M., Tumlinson, J., Geha, M., et al. 2014, ApJ, 796, 91
2014
Show all 101 references
-
[10]
2019, JOSS, 4, 1636
Brummel-Smith, C., Bryan, G., Butsky, I., et al. 2019, JOSS, 4, 1636
2019
-
[11]
Bryan, G. L. & Norman, M. L. 1998, ApJ, 495, 80
1998
-
[12]
L., Norman, M
Bryan, G. L., Norman, M. L., O’Shea, B. W., et al. 2014, ApJS, 211, 19
2014
-
[13]
S., Kravtsov, A
Bullock, J. S., Kravtsov, A. V ., & Weinberg, D. H. 2000, ApJ, 539, 517
2000
-
[14]
G., Greco, J
Carlsten, S. G., Greco, J. P., Beaton, R. L., & Greene, J. E. 2020, ApJ, 891, 144
2020
-
[15]
G., Greene, J
Carlsten, S. G., Greene, J. E., Beaton, R. L., Danieli, S., & Greco, J. P. 2022, ApJ, 933, 47
2022
-
[16]
& McDonald, P
Cen, R. & McDonald, P. 2002, ApJ, 570, 457
2002
-
[17]
J., Noble, A
Cramer, W. J., Noble, A. G., Rudnick, G., et al. 2024, ApJ, 975, 144
2024
-
[18]
& Birnboim, Y
Dekel, A. & Birnboim, Y . 2006, MNRAS, 368, 2
2006
-
[19]
2019, arXiv e-prints, arXiv:1904.08431
Dekel, A., Lapiner, S., & Dubois, Y . 2019, arXiv e-prints, arXiv:1904.08431
2019 arXiv
-
[20]
& Silk, J
Dekel, A. & Silk, J. 1986, ApJ, 303, 39
1986
-
[21]
2021, ApJ, 909, 112
Diemer, B. 2021, ApJ, 909, 112
2021
-
[22]
2024, MNRAS, 533, 3811
Diemer, B., Behroozi, P., & Mansfield, P. 2024, MNRAS, 533, 3811
2024
-
[23]
2021, MNRAS, 506, 4760
Donnari, M., Pillepich, A., Nelson, D., et al. 2021, MNRAS, 506, 4760
2021
-
[24]
P., Cooper, M
Fillingham, S. P., Cooper, M. C., Pace, A. B., et al. 2016, MNRAS, 463, 1916
2016
-
[25]
P., Cooper, M
Fillingham, S. P., Cooper, M. C., Wheeler, C., et al. 2015, MNRAS, 454, 2039
2015
-
[26]
S., McCarthy, I
Font, A. S., McCarthy, I. G., Belokurov, V ., Brown, S. T., & Stafford, S. G. 2022, MNRAS, 511, 1544
2022
-
[27]
Gabor, J. M. & Davé, R. 2015, MNRAS, 447, 374
2015
-
[28]
H., et al
Geha, M., Mao, Y .-Y ., Wechsler, R. H., et al. 2024, ApJ, 976, 118
2024
-
[29]
H., Mao, Y .-Y ., et al
Geha, M., Wechsler, R. H., Mao, Y .-Y ., et al. 2017, ApJ, 847, 4
2017
-
[30]
2020, A&A, 634, A135
Girelli, G., Pozzetti, L., Bolzonella, M., et al. 2020, A&A, 634, A135
2020
-
[31]
Grand, R. J. J., Marinacci, F., Pakmor, R., et al. 2021, MNRAS, 507, 4953
2021
-
[32]
B., van den Bosch, F
Green, S. B., van den Bosch, F. C., & Jiang, F. 2021, MNRAS, 509, 2624
2021
-
[34]
E., Danieli, S., Carlsten, S., et al
Greene, J. E., Danieli, S., Carlsten, S., et al. 2023, ApJ, 949, 94
2023
-
[35]
Gunn, J. E. & Gott, J. Richard, I. 1972, ApJ, 176, 1
1972
-
[36]
& Madau, P
Haardt, F. & Madau, P. 2012, ApJ, 746, 125
2012
-
[37]
S., Benitez-Llambay, A., & Helly, J
Han, J., Cole, S., Frenk, C. S., Benitez-Llambay, A., & Helly, J. 2017, MNRAS, 474, 604
2017
-
[38]
P., Wang, H., & Wang, W
Han, J., Jing, Y . P., Wang, H., & Wang, W. 2012, MNRAS, 427, 2437
2012
-
[39]
2019, A&A, 624, A11
Hausammann, L., Revaz, Y ., & Jablonka, P. 2019, A&A, 624, A11
2019
-
[40]
Henriques, B. M. B. & Thomas, P. A. 2010, MNRAS, 403, 768
2010
-
[41]
F., Wetzel, A., Kereš, D., et al
Hopkins, P. F., Wetzel, A., Kereš, D., et al. 2018, MNRAS, 480, 800
2018
-
[42]
Jiang, L., Cole, S., Sawala, T., & Frenk, C. S. 2015, MNRAS, 448, 1674
2015
-
[43]
2024, ApJ, 964, 123
Jung, M., Roca-Fàbrega, S., Kim, J.-H., et al. 2024, ApJ, 964, 123
2024
-
[44]
P., Besla, G., Anderson, J., & Alcock, C
Kallivayalil, N., van der Marel, R. P., Besla, G., Anderson, J., & Alcock, C. 2013, ApJ, 764, 161
2013
-
[45]
A., et al
Karunakaran, A., Spekkens, K., Oman, K. A., et al. 2021, ApJ, 916, L19
2021
-
[46]
2020, MNRAS, 494, 2200
Katz, H., Ramsoy, M., Rosdahl, J., et al. 2020, MNRAS, 494, 2200
2020
-
[47]
M., White, S
Kauffmann, G., Heckman, T. M., White, S. D. M., et al. 2003, MNRAS, 341, 33 Kereš, D., Katz, N., Weinberg, D. H., & Davé, R. 2005, MNRAS, 363, 2
2003
-
[48]
2014, ApJS, 210, 14
Kim, J.-h., Abel, T., Agertz, O., et al. 2014, ApJS, 210, 14
2014
-
[49]
2016, ApJ, 833, 202
Kim, J.-h., Agertz, O., Teyssier, R., et al. 2016, ApJ, 833, 202
2016
-
[50]
N., Cohen, J
Kirby, E. N., Cohen, J. G., Guhathakurta, P., et al. 2013, ApJ, 779, 102
2013
-
[51]
R., Muldrew, S
Knebe, A., Knollmann, S. R., Muldrew, S. I., et al. 2011, MNRAS, 415, 2293
2011
-
[52]
I., Pearce, F., et al
Knebe, A., Libeskind, N. I., Pearce, F., et al. 2012, MNRAS, 428, 2039
2012
-
[53]
V ., Klypin, A
Kravtsov, A. V ., Klypin, A. A., & Khokhlov, A. M. 1997, ApJS, 111, 73
1997
-
[54]
J., Davidzon, I., et al
Legrand, L., McCracken, H. J., Davidzon, I., et al. 2019, MNRAS, 486, 5468
2019
-
[55]
K., Walter, F., Brinks, E., et al
Leroy, A. K., Walter, F., Brinks, E., et al. 2008, ApJ, 136, 2782
2008
-
[56]
C., Wilkins, S
Lovell, C. C., Wilkins, S. M., Thomas, P. A., et al. 2021, MNRAS, 509, 5046
2021
-
[57]
2024, ApJ, 970, 178
Mansfield, P., Darragh-Ford, E., Wang, Y ., et al. 2024, ApJ, 970, 178
2024
-
[58]
H., et al
Mao, Y .-Y ., Geha, M., Wechsler, R. H., et al. 2024, ApJ, 976, 117
2024
-
[59]
H., et al
Mao, Y .-Y ., Geha, M., Wechsler, R. H., et al. 2021, ApJ, 907, 85
2021
-
[60]
A., Schaye, J., et al
Marasco, A., Crain, R. A., Schaye, J., et al. 2016, MNRAS, 461, 2630–2649
2016
-
[61]
2001, ApJ, 559, 754
Mayer, L., Governato, F., Colpi, M., et al. 2001, ApJ, 559, 754
2001
-
[62]
2006, MNRAS, 369, 1021
Mayer, L., Mastropietro, C., Wadsley, J., Stadel, J., & Moore, B. 2006, MNRAS, 369, 1021
2006
-
[63]
G., Frenk, C
McCarthy, I. G., Frenk, C. S., Font, A. S., et al. 2007, MNRAS, 383, 593
2007
-
[64]
McConnachie, A. W. 2012, ApJ, 144, 4
2012
-
[65]
A., et al
Merluzzi, P., Busarello, G., Dopita, M. A., et al. 2016, MNRAS, 460, 3345
2016
-
[66]
1996, Nature, 379, 613
Moore, B., Katz, N., Lake, G., Dressler, A., & Oemler, A. 1996, Nature, 379, 613
1996
-
[67]
I., Pearce, F
Muldrew, S. I., Pearce, F. R., & Power, C. 2010, MNRAS, 410, 2617
2010
-
[68]
M., Applebaum, E., et al
Munshi, F., Brooks, A. M., Applebaum, E., et al. 2021, ApJ, 923, 35
2021
-
[69]
2018, MNRAS, 475, 624
Nelson, D., Pillepich, A., Springel, V ., et al. 2018, MNRAS, 475, 624
2018
-
[70]
Nulsen, P. E. J. 1982, MNRAS, 198, 1007
1982
-
[71]
R., et al
Onions, J., Knebe, A., Pearce, F. R., et al. 2012, MNRAS, 423, 1200
2012
-
[72]
2015, Nature, 521, 192
Peng, Y ., Maiolino, R., & Cochrane, R. 2015, Nature, 521, 192
2015
-
[73]
J., Kovaˇc, K., et al
Peng, Y .-j., Lilly, S. J., Kovaˇc, K., et al. 2010, ApJ, 721, 193
2010
-
[74]
Price, D. J. 2008, JCP, 227, 10040
2008
-
[75]
E., Zheng, Y ., Price-Whelan, A
Putman, M. E., Zheng, Y ., Price-Whelan, A. M., et al. 2021, ApJ, 913, 53
2021
-
[76]
2000, Science, 288, 1617
Quilis, V ., Moore, B., & Bower, R. 2000, Science, 288, 1617
2000
-
[77]
I., Hayfield, T., & Agertz, O
Read, J. I., Hayfield, T., & Agertz, O. 2010, MNRAS, 405, 1513
2010
-
[78]
I., Wilkinson, M
Read, J. I., Wilkinson, M. I., Evans, N. W., Gilmore, G., & Kleyna, J. T. 2006, MNRAS, 366, 429
2006
-
[79]
& Jablonka, P
Revaz, Y . & Jablonka, P. 2012, A&A, 538, A82 Roca-Fàbrega, S., Kim, J.-H., Hausammann, L., et al. 2021, ApJ, 917, 64 Roca-Fàbrega, S., Kim, J.-H., Primack, J. R., et al. 2024, ApJ, 968, 125 Rodriguez Wimberly, M. K., Cooper, M. C., Fillingham, S. P., et al. 2019, MN- RAS, 483, 4031
2012
-
[80]
& Hensler, G
Roediger, E. & Hensler, G. 2005, A&A, 433, 875
2005
-
[81]
2023, MNRAS, 525, 3849
Samuel, J., Pardasani, B., Wetzel, A., et al. 2023, MNRAS, 525, 3849
2023
-
[82]
2022, MNRAS, 514, 5276–5295
Samuel, J., Wetzel, A., Santistevan, I., et al. 2022, MNRAS, 514, 5276–5295
2022
-
[83]
S., Bower, R
Schaller, M., Frenk, C. S., Bower, R. G., et al. 2015, MNRAS, 451, 1247
2015
-
[84]
M., et al
Schaye, J., Dalla Vecchia, C., Booth, C. M., et al. 2010, MNRAS, 402, 1536
2010
-
[85]
& Struck, C
Schulz, S. & Struck, C. 2001, MNRAS, 328, 185
2001
-
[86]
2024, arXiv e-prints, arXiv:2410.08290
Shuntov, M., Ilbert, O., Toft, S., et al. 2024, arXiv e-prints, arXiv:2410.08290
2024 arXiv
-
[87]
M., Grand, R
Simpson, C. M., Grand, R. J. J., Gómez, F. A., et al. 2018, MNRAS, 478, 548
2018
-
[88]
D., Bryan, G
Smith, B. D., Bryan, G. L., Glover, S. C. O., et al. 2016, MNRAS, 466, 2217
2016
-
[89]
S., Willman, B., & Aguirre, J
Spekkens, K., Urbancic, N., Mason, B. S., Willman, B., & Aguirre, J. E. 2014, ApJ, 795, L5
2014
-
[90]
2005, MNRAS, 364, 1105
Springel, V . 2005, MNRAS, 364, 1105
2005
-
[91]
2010, MNRAS, 401, 791
Springel, V . 2010, MNRAS, 401, 791
2010
-
[92]
Springel, V ., White, S. D. M., Tormen, G., & Kau ffmann, G. 2001, MNRAS, 328, 726
2001
-
[93]
R., et al
Strawn, C., Roca-Fàbrega, S., Primack, J. R., et al. 2024, ApJ, 962, 29
2024
-
[94]
W., Veeravalli, G., & Couchman, H
Wadsley, J. W., Veeravalli, G., & Couchman, H. M. P. 2008, MNRAS, 387, 427
2008
-
[95]
O., Mao, Y .-Y ., et al
Wang, Y ., Nadler, E. O., Mao, Y .-Y ., et al. 2024, ApJ, 976, 119
2024
-
[96]
R., Dolphin, A
Weisz, D. R., Dolphin, A. E., Skillman, E. D., et al. 2014, ApJ, 789, 148
2014
-
[97]
R., Tinker, J
Wetzel, A. R., Tinker, J. L., Conroy, C., & van den Bosch, F. C. 2013, MNRAS, 432, 336
2013
-
[98]
I., Cooper, M
Wheeler, C., Phillips, J. I., Cooper, M. C., Boylan-Kolchin, M., & Bullock, J. S. 2014, MNRAS, 442, 1396
2014
-
[99]
White, S. D. M. & Frenk, C. S. 1991, ApJ, 379, 52
1991
-
[100]
J., Lagos, C
Wright, R. J., Lagos, C. d. P., Power, C., et al. 2022, MNRAS, 516, 2891
2022
-
[101]
Zaritsky, D., Smith, R., Frenk, C., & White, S. D. M. 1993, ApJ, 405, 464
1993
-
[102]
Zaritsky, D., Smith, R., Frenk, C., & White, S. D. M. 1997, ApJ, 478, 39
1997
-
[103]
L., & Putman, M
Zhu, J., Tonnesen, S., Bryan, G. L., & Putman, M. E. 2024, ApJ, 974, 142 1 Departamento de Física de la Tierra y Astrofísica, Fac. de C.C. Físi- cas, Universidad Complutense de Madrid, E-28040 Madrid, Spain e-mail: ramorodr@ucm.es 2 GMV , Space and Avionics Equipment, Isaac Ne...
2024
Reviewed August 15, 2026 · model on record in the stance chip above.
Discussion (0). Continue with ORCID to comment.