REVIEW 4 major objections 6 minor
Beyond Leaders and Laggards: A Typology of Renewable Energy Adoption Trajectories with Evidence from Off-Grid Communities
T0 review · 4 major / 6 minor · reviewed 2026-08-07 · deepseek-v4-flash
Pith's one-line read A new index sorts every community into eight solar adoption paths and finds that retreat is common while leapfrogging is rare.
desk verdict A novel ATI metric and eight-path typology applied to a genuinely valuable off-grid PV dataset, but the headline 18% retreating share rests on six-point curve fitting that can manufacture the very patterns the paper claims to find. read the letter →
The pith
A machine-rendered reading of the paper's core claim, the machinery that carries it, and where it could break.
The reading
What carries the argument
The carrying object is the Adoption over Time Index (ATI), a scalar that combines the area under an entity's fitted adoption-intensity curve with a feedback adjustment for how long the entity strayed above or below the regional mean curve. ATI is built from intersections between the entity's best-fitting curve and the regional mean curve: the angle after each intersection sets the direction of the deviation, and the time between intersections sets its weight. The candidate curves are a set of commonly used cumulative diffusion shapes, polynomials, and a linear function, and the best fit is selected by maximum goodness of fit conditional on exceeding 0.9. ATI supplies the intensity axis of each profile; entry time, latest trajectory, and latest adoption intensity fill the other three axes, and a rule table maps every feasible combination to one of eight named paths.
What would settle it
Check the raw, un-fitted PV areas in 2020 and 2022 for clusters labeled decelerating or declining moderate; if most of them grew rather than stagnated or declined, the retreating paths are fitting artifacts rather than real behavior.
Extended reading notes
Core claim
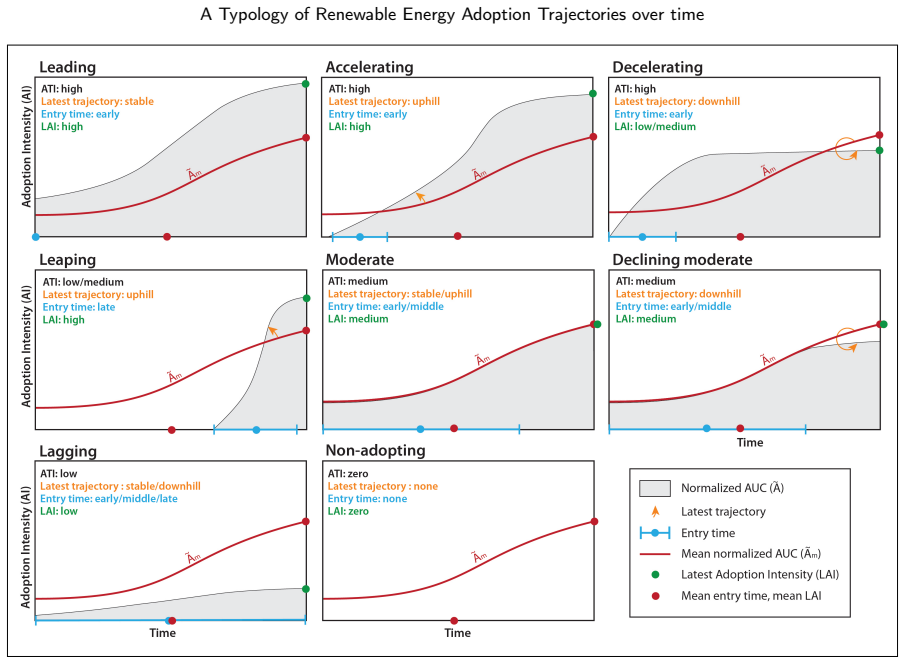
The paper's discovery is a formal way to see adoption dynamics as trajectories rather than milestones. Each entity's photovoltaic density over time is fitted with the best curve from a family that includes standard cumulative diffusion shapes, polynomials, and a linear form; the area under that curve, normalized to the regional mean, gives the base ATI. A feedback mechanism then penalizes entities whose high overall adoption was interrupted by periods below the regional mean, and rewards weak entities that temporarily rose above it, with adjustments proportional to how long the deviation lasted. The result is a typology of eight paths: leading, accelerating, decelerating, leaping, moderate, declining moderate, lagging, and non-adopting, where decelerating and declining moderate are newly identified. In the Bedouin case study, the retreating paths are substantial (18%), the leaping path is near-absent (2%), and lagging clusters dominate the region, so the paper concludes that a decade of access has not exhausted the region's adoption potential.
Load-bearing premise
The framework's load-bearing premise is that a curve fitted to only six yearly observations, chosen as best among many candidate shapes by a fit score above 0.9, faithfully represents each community's actual adoption trajectory, because overfitted curves would distort the area, crossing points, entry time, and final path label.
Editorial extensions
If this is right
- Retreating paths make up 18% of clusters, so adoption programs should monitor for deceleration and decline and intervene before backsliding entrenches.
- The near-absence of the leaping path (2%) suggests late, rapid catch-up is not a reliable default for marginalized off-grid populations.
- Separating leading from accelerating and lagging from non-adopting gives policymakers distinct targets: imitation hubs versus communities needing stronger engagement.
- One-third of clusters changed path between the two halves of the timeline, with downward shifts more abrupt than upward ones, implying early-warning systems may be feasible.
Reading between the lines
- The same four-feature pipeline could be exported to other technologies, regions, or time grids as long as at least six time points and a comparable entity-level intensity measure exist; path labels could then be compared across regions.
- If the finding that retreat is common holds elsewhere, diffusion models that assume monotonic saturation would need a regime-switching component that allows decline.
- A natural test is to link path labels to later behavior: do decelerating and declining-moderate clusters show measurable recovery after targeted interventions, and do leading clusters continue to lead?
- Path labels could also serve as a dependent variable in regressions on socioeconomic, spatial, or infrastructure factors to identify what drives each trajectory.
Signed reviews
Editorial analysis
A structured set of objections, weighed in public.
Referee Report
Summary. The paper develops an analytical framework for classifying renewable-energy adoption trajectories of geographic entities. It introduces an Adoption over Time Index (ATI) based on the area under a fitted cumulative adoption-intensity curve, normalized by the regional mean and adjusted by a feedback mechanism using intersections with the regional mean curve. ATI is combined with entry time, latest adoption intensity (LAI), and a latest-trajectory variable to define eight adoption paths, including two new 'retreating' paths (decelerating and declining moderate) and a leaping path. The framework is applied to 1,192 off-grid Bedouin settlement clusters in southern Israel using PV areas digitized from six aerial images (2012–2022). The empirical results show that lagging is the most common path, retreating paths account for 18% of clusters, and leaping is rare (2%). The paper also analyzes transitions between paths across two halves of the timeline.
Significance. The paper addresses a real gap: most adoption typologies are static or rely on milestone-based features, and none systematically captures deceleration or decline in ongoing diffusion processes. The proposed ATI and the eight-path typology are conceptually clear and policy-relevant, and the case study is novel: a complete spatial census of small-scale PV adoption in an off-grid population. The authors are transparent about several limitations, such as the lack of causal modeling and the dependence on high-resolution data. However, the quantitative claims—especially the prevalence of retreating paths and the near-absence of leaping—rest on a curve-fitting procedure that is not robust for the available time-series length. If the authors can demonstrate that these findings are insensitive to model-selection choices and measurement error, the contribution would be substantial and would open a useful direction for comparative studies.
major comments (4)
- [Section 2.1.1, Table 1] The candidate curve set includes polynomial functions of degree d ∈ {2,...,T−1}, with T = 6, so a degree-5 polynomial can interpolate the six observed points exactly (R² = 1). Because the selection rule chooses the curve with the highest R² subject to R² > 0.9, it can systematically prefer interpolating, oscillatory curves. These curves can create spurious intersections with the regional mean curve and arbitrary end slopes, directly affecting ATI, the latest-trajectory variable, and ultimately every path assignment. The paper reports no complexity penalty, cross-validation, or sensitivity analysis over the curve family. This is not merely a technical detail: the headline shares (18% retreating, 2% leaping) are computed from features derived from these fitted curves. I request that the authors either restrict the polynomial degree (e.g., to ≤3), use a criterion that penalizes complexity (AIC/BIC), or demonstrate that the main findings are stable across a range of curve families and degrees.
- [Section 2.4.4] The entry-time threshold—20% of the regional mean adoption intensity—is selected from the same dataset by optimizing distributional properties (closest to normal skewness/kurtosis, highest SD, and 92% coverage). This is a free parameter chosen post hoc, and the resulting ordinal entry-time categories and path shares are sensitive to it. No independent theoretical justification or external benchmark is provided, and no sensitivity analysis is reported for the threshold. The choice directly affects which clusters are classified as early, middle, or late entrants, and thus the composition of all eight paths, including the novel retreating paths. Please add a sensitivity analysis over the threshold (e.g., 10%, 30%, 40%) and report how the distribution of paths changes.
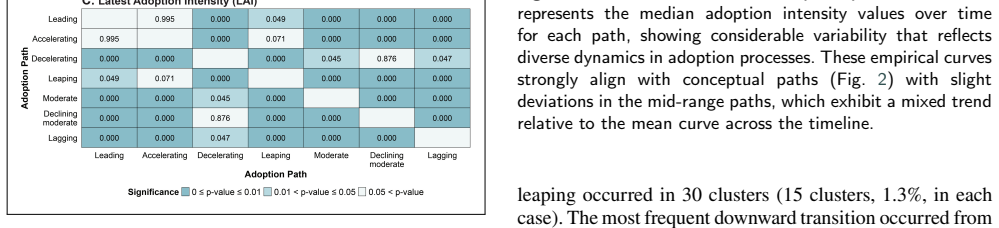
- [Section 3.3, Fig. 9] The alignment between the empirical median curves (Fig. 9) and the conceptual curves (Fig. 2) is presented as validation, but this is partly circular: the conceptual curves are defined by the same four features (ATI, entry time, latest trajectory, LAI) that are used to assign clusters to paths. By construction, the median curve of clusters assigned to, say, the 'decelerating' path will tend to display a plateau or decline because the path definition requires a downhill latest trajectory and medium/low LAI. The empirical alignment therefore does not provide independent evidence that the typology captures distinct underlying dynamics. To strengthen the contribution, the authors should validate against external criteria: for example, hold out the last time point and test whether path assignments predict subsequent adoption, or compare the spatial distribution of paths with independent socioeconomic or geographic variables.
- [Section 2.4.2, Section 3.3] The PV segmentation is reported to have an F1 score of 0.885, but this measurement error is not propagated into the features or the path classification. Since many clusters have very low PV density, even a small absolute error in PV area can swing the fitted curve, the entry time, and the latest trajectory. The paper should quantify the impact of segmentation errors—for example, by a Monte Carlo simulation that perturbs PV areas according to the reported precision matrix, or by a bootstrap resampling of the annotation process—and report the resulting uncertainty in the path shares. Without this, the empirical prevalence of the retreating paths (18%) cannot be distinguished from a measurement artifact.
minor comments (6)
- [Nomenclature / Eq. (5)] The definition of AI in Eq. (5) includes a scaling constant of 10^6, but the units are not stated (presumably m² of PV per m² of built-up area, then rescaled). Please state the units explicitly to make the results interpretable.
- [Section 2.1.1, Eq. (1)-(4)] The definition of the angle α_ij is given only in the nomenclature as 'Angle between C_i and C_m' and in the text as arctan of the difference of derivatives. Please state the formula in the main text (e.g., α_ij = arctan(C'_i(t_j) - C'_m(t_j))) to avoid ambiguity, especially since the sine of this angle drives the feedback mechanism.
- [References] References [76] and [117] appear to be the same work (Wang et al., 'More than innovativeness...', Renewable Energy 197 (2022) 552–563). Please consolidate to a single reference.
- [Figure 2] The conceptual illustration of adoption paths (Fig. 2) is informative, but the axes are not labeled. Adding axis labels (time and adoption intensity) would help readers compare the conceptual curves with the empirical curves in Fig. 9.
- [Section 3.3, paragraph 1] The sentence 'The moderate and declining moderate paths stand out, together comprising approximately one-third of the clusters; 13% of them exhibit stagnation or decline toward the end of the examined timeline' is unclear. The 13% appears to refer to declining moderate alone, but the wording could be read as a subset of the one-third. Please rephrase.
- [Section 4.4] The limitations section is candid about data resolution and temporal scope, but it does not mention the curve-fitting overfitting risk or the data-driven threshold selection. Adding these as limitations would be appropriate given their impact on the reported results.
Circularity Check
Typology validation is self-referential: paths are defined by the very same fitted features used to build their median curves, and the retreating-path shares inherit an unpenalized degree-5 polynomial fit to only six time points.
-
self definitional
[Section 2.3 (Table 2 and Fig. 2) and Section 3.3 (Fig. 9)]
"The paths are determined based on a set of criteria (Table 2) derived from ordinal categories of four key features: ATI, Entry time, Latest trajectory, and LAI. ... The data-driven curves in Fig. 9 show a strong alignment with the theoretical curves illustrated in Fig. 2. Thus, the implementation of an analytical framework indeed succeeds in distinguishing between adoption paths."
The 'theoretical' paths in Fig. 2 are defined entirely by Table 2 criteria on ATI, entry time, latest trajectory, and LAI. The 'data-driven' curves in Fig. 9 are medians of clusters grouped by exactly those same features, where all four features are computed from the same best-fitting curves described in Section 2.1.1. Therefore the strong alignment between the two sets of curves is a necessary result of the grouping rule, not independent empirical confirmation. The framework's success in 'distinguishing between adoption paths' is thus self-referential: the same feature values that assign clusters to paths are reused to verify that the path curves differ.
-
fitted input called prediction
[Sections 2.1.1, 2.1.4, and 3.3]
"polynomial functions of degree, d, where d∈{2,…,T−1} to provide flexibility and allow for potential declines in adoption trajectory... The best-fitting curve is selected based on the highest R² value, conditional on exceeding 0.9. ... Latest trajectory ... final slope direction of the entity's curve relative to the regional mean curve. ... Together with the Declining Moderate path, the retreating groups account for 18% of the clusters."
With T=6 time points (2012, 2015, 2017, 2020, 2021, 2022), degree-5 polynomials can interpolate the data exactly (R²=1), so the selection rule can systematically choose oscillating curves. A 'downhill' latest trajectory is then the slope after the last intersection of such an interpolating curve and can be an artifact of overfitting rather than an observed adoption dynamic. The 18% retreating share in Section 3.3, and the 21.6% downhill trajectories in Section 3.2, are computed from these same unpenalized fitted curves and data-tuned thresholds. The 'empirical' discovery of decelerating and declining moderate paths is therefore forced by the curve-fitting specification; no complexity penalty, cross-validation, or sensitivity analysis over the curve family is reported.
full rationale
The paper's PV measurements, descriptive statistics, and the construction of the ATI index itself retain independent content, and the self-citations (e.g., reference [110] for annotation accuracy) are not load-bearing for the typology's logical derivation. However, the central validation is circular. The eight adoption paths are defined by thresholds on four features that are all derived from the same best-fitting curves, so Fig. 9's alignment between 'data-driven' and 'theoretical' curves is guaranteed by the assignment mechanism rather than by independent evidence. The headline shares--18% retreating, 21.6% downhill, 2% leaping--are conditional on unpenalized degree-5 polynomial fits to six time points and on an entry-time threshold (20%) tuned to maximize normality and variance in the same data. No external benchmark, holdout validation, or model-selection penalty is reported, so the framework's 'success' is partly self-referential. This is partial circularity: the path typology is internally consistent, but its empirical confirmation reduces to the definitions and fitted curves that generated it.
Assumptions & free parameters
free parameters (4)
- Entry time threshold =
20% of regional mean
- R-squared threshold for curve selection =
0.9
- Ordinal category bandwidth =
±0.44σ
- Timeline midpoint for transitions =
2017
assumptions (6)
- domain assumption Built-up area is a valid proxy for population size within clusters.
- domain assumption The regional mean is an appropriate benchmark for comparing adoption dynamics.
- ad hoc to paper The ATI feedback mechanism quantifies adoption stability or volatility in a meaningful way.
- domain assumption A best-fitting curve with R-squared above 0.9 from the candidate family reliably represents adoption trajectories.
- ad hoc to paper Adoption paths can be ordered on an ordinal scale for transition analysis.
- domain assumption Rogers' adopter categorization thresholds apply to geographic entities.
invented entities (2)
-
Adoption over Time Index (ATI)
-
Adoption path typology (eight paths)
Cite this review
Pith. "Pith review of Beyond Leaders and Laggards: A Typology of Renewable Energy Adoption Trajectories with Evidence from Off-Grid Communities." pith.science (2026). https://pith.science/paper/V6XB3RUG
@misc{pith2026250522456,
  author       = {Pith},
  title        = {Pith review of: Beyond Leaders and Laggards: A Typology of Renewable Energy Adoption Trajectories with Evidence from Off-Grid Communities},
  year         = {2026},
  howpublished = {\url{https://pith.science/paper/V6XB3RUG}},
  note         = {Machine review of arXiv:2505.22456}
}
read the original abstract
Understanding the dynamics of renewable energy adoption is essential for designing strategies that accelerate its spread - an urgent priority for advancing climate goals and improving well-being, especially in off-grid regions facing energy poverty. This study introduces a time-series-based analytical framework that quantifies and classifies adoption behaviors of geographic entities within a region. A novel metric, the Adoption over Time Index (ATI), captures cumulative adoption intensity and identifies shifts in adoption trends, improving the ability to distinguish between fundamental adoption paths. By combining ATI with three key features found to be indicative of adoption dynamics, we define a typology of eight distinct paths, including two newly identified trajectories - the decelerating path and the declining moderate path. Applying this framework to a case study of an off-grid Bedouin population in southern Israel reveals that these retreating paths exist in substantial proportions. Identifying such trends is critical for addressing stagnation and preventing backsliding in the diffusion process. The leaping path, by contrast, was nearly absent. We also identify behavioral diversity within both front-runner and trailing groups. Differentiating among these groups can help tailor acceleration strategies. The analysis further reveals significant disparities in adoption levels across the region, with lagging clusters being widespread and overall adoption falling short of the region's potential.
Figures


Figures from the paper (8 more)




Reviewed August 7, 2026 · model on record in the stance chip above.
Discussion (0). Continue with ORCID to comment.