REVIEW 4 major objections 6 minor 26 references
An Overview of Statistical Data Analysis
T0 review · 4 major / 6 minor · reviewed 2026-08-14 · deepseek-v4-flash
Pith's one-line read One compact document gathers the theory behind everyday statistical analysis software, from descriptive statistics to classifiers.
desk verdict A sincere but careless overview of standard statistics whose transcription errors defeat its stated purpose as a fast-access reference. read the letter →
The pith
A machine-rendered reading of the paper's core claim, the machinery that carries it, and where it could break.
The reading
What carries the argument
The carrying structure is a catalog of formulas and rules, grouped by the stage of an analysis. Descriptive statistics are carried by frequency distributions and the mean, median, mode, percentile, range, and variance formulas; inference is carried by the probability densities for the normal, chi-square, Student t, F, and binomial distributions, together with the sampling-distribution table and the central limit theorem; hypothesis testing is carried by p-value and confidence-interval decision rules; regression by the sums-of-squares decomposition and F/t tests; factor analysis by the factor model, communalities, adequacy measures, and rotations; clustering by distance measures and linkage rules; classification by the named algorithms. The paper's claim to usefulness is that these entries are self-contained, so a reader can look up one formula and its interpretation without reading the whole document.
What would settle it
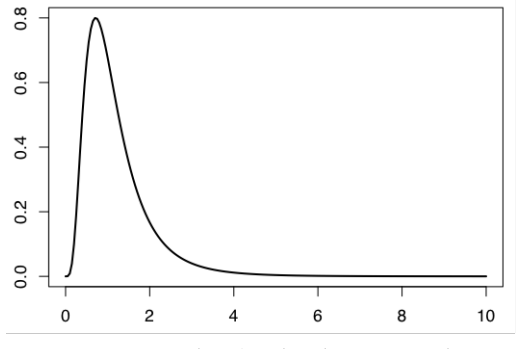
Compare the printed chi-square density in Section 3.1 with the standard expression $\frac{1}{2^{n/2}\Gamma(n/2)}x^{n/2-1}e^{-x/2}$: the printed version contains an integral sign, an undefined $X$, and a stray factor. The same section prints the t and F densities with $\tau(u)$ where $\Gamma(u)$ is intended and attributes them to a "Kerns, 2010" that is missing from the reference list; a reader checking any of these against the sources would find that the overview cannot be relied on as a stand-alone quick reference.
Extended reading notes
Core claim
The central claim of the overview is that the theory supporting everyday statistical software can be organized into a single coherent chain of concepts, and that a reader can move through that chain at reference speed: classify variables, summarize them with measures of central tendency and variability, choose a probability model, use sampling distributions and the central limit theorem for inference, apply hypothesis-testing decision rules with p-values and confidence intervals, then proceed to multivariate tools—linear regression, exploratory factor analysis, cluster analysis, and common classifiers. Each concept is presented as a formula or a decision rule, often with a small worked example, and estimation details are deliberately left to the software. The intended outcome is that a user who understands where a given test or estimator sits in this chain will be able to configure software settings and interpret results correctly, rather than treating the software as a black box.
Load-bearing premise
The load-bearing premise is that every formula and definition in the overview is transcribed accurately enough from its source that a reader can rely on it without checking the original textbooks; if even one formula is corrupted, a reader following the overview will get a wrong result with no sign that anything is amiss.
Editorial extensions
If this is right
- If the overview works as intended, a user of the companion R/Python material can look up the equation behind each output and the interpretive rule for it in one pass.
- The organization by analysis stage gives a beginner a map from raw data to reported results: summarize, choose a distribution, test, then model.
- The explicit warnings about p-value misinterpretation and the distinction between "reject" and "fail to reject" carry directly into the companion software examples.
- A reader who needs only one concept—say, the F-distribution or the KMO measure—can extract it without reading the surrounding chapters.
Reading between the lines
- Editorial inference: the same catalog format could be extended into a troubleshooting chart that maps each software setting (t-test vs. z-test, PCA vs. factor extraction, linkage method) to the distributional assumptions the overview lists.
- Editorial inference: a natural stress test is to ask whether a reader could reproduce every worked example in the paper (age mean 21.75, median 21.5, third quartile 23, factor-loading illustration) in any standard statistical package; agreement would confirm the reference is self-contained.
- Editorial inference: because the overview defers estimation to software, its most useful next step would be a side-by-side table of R, Python, and SPSS commands that correspond to each formula, making the theory-to-tool link explicit.
Signed reviews
Editorial analysis
A structured set of objections, weighed in public.
Referee Report
Summary. The manuscript presents a broad overview of statistical data analysis concepts for practitioners who use statistical software. It covers variable types, descriptive statistics, common probability distributions, sampling distributions, hypothesis testing, linear regression, exploratory factor analysis, cluster analysis, and popular classifiers, with the stated goal of providing 'fast access' to theoretical concepts. The paper restates standard textbook material, includes worked numerical examples (e.g., frequency tables, mean, median, percentiles) and illustrative figures, but does not contain original derivations, simulations, or data analyses.
Significance. If the formulas and definitions were accurately transcribed, the overview could serve a useful purpose as a quick reference for non-specialist users of statistical software, and the breadth of topics is appropriate. The paper explicitly credits its sources and includes concrete examples that help readers map definitions to computations. However, the manuscript's central promise of reliable 'fast access' depends entirely on whether the reproduced formulas and conditions are correct; the current text contains several transcription errors in load-bearing formulas, so the overview cannot be used without consulting the original textbooks.
major comments (4)
- [3.1] The chi-square PDF as printed, fX(x)= 1/(2^{n/2}) ∫_0^∞ x^{n/2−1} e^{−X} dX • x^{n/2−1} e^{−x/2}, is not a probability density function: the integral factor is a spurious constant involving the dummy variable X, and the normalization is missing. The correct density is 1/(2^{n/2} Γ(n/2)) x^{n/2−1} e^{−x/2} for x>0. Because the paper's purpose is an unmediated quick reference, this error directly undermines the stated goal.
- [3.1] For the Snedecor F-distribution, the text states 'where τ(u)=... and m >2 and n >4'. These inequalities are not support conditions for the density; the F density is defined for all m,n>0. The restrictions n>2 and n>4 are required only for the existence of the mean and variance, respectively. As written, a reader following the paper would incorrectly reject valid parameter pairs such as (m,n)=(1,1), which are routinely used in F tests.
- [2] In the percentile example, the 75th percentile is computed as (X15+X16)/2 = 23, which is correct, but the line is labeled 'P25 = Q3 = ...'. This directly contradicts the paper's own definition that P25 is the first quartile Q1 and P75 is the third quartile Q3, and it corrupts the notation used in the following IQR definition (IQR = Q3 − Q1). The label should be 'P75 = Q3'.
- [3.2 and 6.1] The sampling-distribution table contains a garbled chi-square row: 'S′2 (N−1)S′2 / σ² ∼ X²(n−1)' should read (n−1)S′²/σ² ∼ χ²(n−1). In Section 6.1, the Euclidean distance formula is printed as 'd(p,q) = v√ ∑...' with an unexplained 'v' before the radical. These additional transcription errors, alongside those in Section 3.1, indicate that the manuscript cannot currently serve as a reliable reference without external checking.
minor comments (6)
- [3.1] The sentence about the chi-square distribution says the central limit theorem ensures that the X² distribution approaches the normal distribution 'for high values of p'; this should be 'for high values of n', since p is not a parameter of this distribution.
- [3.1] The gamma function is denoted τ(u) in the Student-t and F PDFs, but the definition writes 'dX' instead of 'dx' inside the integral; the dummy variable should match the integration variable.
- [4] In the ANOVA paragraph, 'n is the number of variables' should be 'n is the sample size' when giving the F degrees of freedom (p, n−p−1).
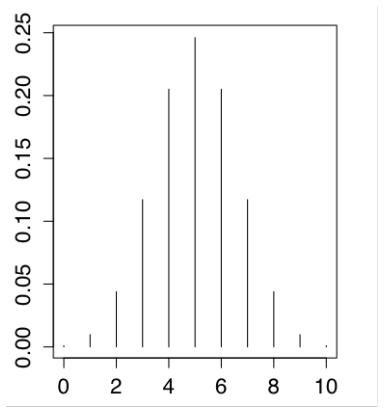
- [3.1] The binomial distribution text says 'exactly n successes out of N Bernoulli trials' while the PMF uses n as the number of trials; the wording should be 'x successes out of n trials'.
- [7] The instance-based learner is referred to as 'IBl'; the standard Weka name is 'IBk' (k-nearest neighbors).
- [References] The author name Marôco is spelled inconsistently: 'Marˆoco' in most citations but 'Morˆoco' in Section 4 and Section 5.1; please unify the spelling.
Circularity Check
No circularity: the paper is a textbook-style overview with no derivation chain, fitted parameters, or predictions to reduce to inputs.
full rationale
The paper explicitly presents itself as a compilation of standard statistical concepts for 'fast access' and derives nothing new. Its only self-citation (Sarmento and Costa, 2017) points to the companion programming book that the overview is meant to support; that citation is contextual and not load-bearing for any claimed result. The content consists of restated definitions, formulas, and worked examples (mean, median, quartiles, variance, distributions, regression, factor analysis, clustering, classifiers) all attributed to external textbooks such as Marôco, McCune, Rumsey, and Kerns. There are no fitted parameters renamed as predictions, no uniqueness theorem imported from the authors' prior work, and no ansatz smuggled in via citation. The substantive concerns about the paper are accuracy issues in transcription (e.g., the corrupted chi-square PDF, the F-distribution support conditions, and the mislabeled P25/Q3), which undermine reliability as a reference but do not constitute circularity. Because the paper makes no predictive or derivational claim that could be equivalent to its own inputs by construction, the circularity score is 0.
Assumptions & free parameters
assumptions (4)
- domain assumption The standard probability distributions and their properties (normal, chi-square, t, F, binomial) as stated in cited textbooks are correct and applicable.
- standard math The central limit theorem applies with the stated sample-size rules (n > 30, or min(np, n(1-p)) > 5).
- domain assumption The factor analysis model assumptions (orthogonal common factors with mean 0 and variance 1, independent specific factors) are standard and valid for the described method.
- domain assumption The companion R/Python code (Sarmento and Costa, 2017) implements the described methods correctly and is represented by this overview.
Cite this review
Pith. "Pith review of An Overview of Statistical Data Analysis." pith.science (2026). https://pith.science/paper/VDASND63
@misc{pith2026190807390,
  author       = {Pith},
  title        = {Pith review of: An Overview of Statistical Data Analysis},
  year         = {2026},
  howpublished = {\url{https://pith.science/paper/VDASND63}},
  note         = {Machine review of arXiv:1908.07390}
}
read the original abstract
The use of statistical software in academia and enterprises has been evolving over the last years. More often than not, students, professors, workers, and users, in general, have all had, at some point, exposure to statistical software. Sometimes, difficulties are felt when dealing with such type of software. Very few persons have theoretical knowledge to clearly understand software configurations or settings, and sometimes even the presented results. Very often, the users are required by academies or enterprises to present reports, without the time to explore or understand the results or tasks required to do an optimal preparation of data or software settings. In this work, we present a statistical overview of some theoretical concepts, to provide fast access to some concepts.
Figures


Figures from the paper (8 more)


Reference graph
Works this paper leans on
-
[1]
write newline
" write newline "" before.all 'output.state := FUNCTION fin.entry add.period write newline FUNCTION new.block output.state before.all = 'skip after.block 'output.state := if FUNCTION new.sentence output.state after.block = 'skip output.state before.all = 'skip after.sentence 'output.state := if if FUNCTION not #0 #1 if FUNCTION and 'skip pop #0 if FUNCTIO...
-
[2]
Abdi, H. (2003). Factor rotations in factor analyses. Encyclopedia for Research Methods for the Social Sciences. Sage: Thousand Oaks, CA , pages 792--795
2003
-
[3]
Aha, D. W., Kibler, D., and Albert, M. K. (1991). Instance-based learning algorithms. Machine learning , 6(1):37--66
work page 1991
-
[4]
Bishop, C. M. (2006). Pattern recognition and machine learning . springer
work page 2006
-
[5]
Breiman, L. (1996). Bagging predictors. Machine learning , 24(2):123--140
1996
-
[6]
Cattell, R. B. (1966). The scree test for the number of factors. Multivariate behavioral research , 1(2):245--276
work page 1966
-
[7]
Cohen, W. W. (1995). Fast effective rule induction. In Machine learning proceedings 1995 , pages 115--123. Elsevier
work page 1995
-
[8]
Dam \'a sio, B. F. (2012). Uso da an \'a lise fatorial explorat \'o ria em psicologia. Avalia c ao Psicologica: Interamerican Journal of Psychological Assessment , 11(2):213--228
work page 2012
Show all 26 references
-
[9]
and Kroeber, A
Driver, H. and Kroeber, A. (1932). Quantitative expression of cultural relationships. university of california publications in american archaeology and ethnology 31: 211--256. ester, m.; kriegel, h.-p.; sander, j.; and xu, x. 1996. a density-based algorithm for discovering clu...
1932
-
[10]
E., et al
Freund, Y., Schapire, R. E., et al. (1996). Experiments with a new boosting algorithm. In icml , volume 96, pages 148--156. Citeseer
1996
-
[11]
Friedman, J., Hastie, T., Tibshirani, R., et al. (2000). Additive logistic regression: a statistical view of boosting (with discussion and a rejoinder by the authors). The annals of statistics , 28(2):337--407
2000
-
[12]
Haykin, S. (2010). Neural networks: a comprehensive foundation, 1999. Mc Millan, New Jersey , pages 1--24
2010
-
[13]
C., Allen, D
Hayton, J. C., Allen, D. G., and Scarpello, V. (2004). Factor retention decisions in exploratory factor analysis: A tutorial on parallel analysis. Organizational research methods , 7(2):191--205
2004
-
[14]
Holte, R. C. (1993). Very simple classification rules perform well on most commonly used datasets. Machine learning , 11(1):63--90
1993
-
[15]
Kaiser, H. F. (1958). The varimax criterion for analytic rotation in factor analysis. Psychometrika , 23(3):187--200
1958
-
[16]
Kerns, G. J. (2018). Introduction to probability and statistics using r
2018
-
[17]
Kolvankar, C., Trivedi, J., Mani, B., Ramanathan, R., and Kadam, S. (2012). Support vector machine for learning in artificial intelligence systems. In Proceedings ofNational Conference on Emerging Trends in Engineering & Technology (VNCET) , pages 409--412
2012
-
[18]
Kootstra, G. J. (2004). Exploratory factor analysis. University of Groningen
2004
-
[19]
Ledesma, R. D. and Valero-Mora, P. (2007). Determining the number of factors to retain in efa: An easy-to-use computer program for carrying out parallel analysis. Practical assessment, research & evaluation , 12(2):1--11
2007
-
[20]
McCune, S. (2009). Practice makes perfect statistics . McGraw Hill Professional
2009
-
[21]
Mor \^o co, J. (2014). An \'a lise estat \' stica com o spss statistics. report, 6th ed., Lisboa
2014
-
[22]
Peers, I. (2006). Statistical analysis for education and psychology researchers: Tools for researchers in education and psychology . Routledge
2006
-
[23]
and Van Hout, R
Rietveld, T. and Van Hout, R. (2011). Statistical techniques for the study of language and language behaviour . Walter de Gruyter
2011
-
[24]
Rumsey, D. J. (2010). Statistics essentials for dummies . John Wiley & Sons
2010
-
[25]
and Costa, V
Sarmento, R. and Costa, V. (2017). Comparative Approaches to Using R and Python for Statistical Data Analysis . IGI Global
2017
-
[26]
Sijtsma, K. (2009). On the use, the misuse, and the very limited usefulness of cronbach’s alpha. Psychometrika , 74(1):107
2009
Reviewed August 14, 2026 · model on record in the stance chip above.
Discussion (0). Continue with ORCID to comment.