REVIEW 3 major objections 4 minor 76 references
Str\"omgren photometric metallicity map of the Magellanic Cloud stars using Gaia DR3--XP spectra
T0 review · 3 major / 4 minor · reviewed 2026-08-07 · deepseek-v4-flash
Pith's one-line read This paper claims that synthetic Strömgren photometry from Gaia DR3 XP spectra yields homogeneous [Fe/H] estimates for about 360,000 stars across the Magellanic Clouds, and that the radial metallicity gradients are piecewise, with…
desk verdict First homogeneous Strömgren metallicity maps across both Clouds for old and young stars; the overall gradients are solid, but the LMC RGB breakpoints may be imprinted by the step-function APOGEE zero-point recalibration. read the letter →
The pith
A machine-rendered reading of the paper's core claim, the machinery that carries it, and where it could break.
The reading
What carries the argument
The carrying object is synthetic Strömgren photometry: GaiaXPy converts each Gaia DR3 XP spectrum into standardised Strömgren v, b, and y magnitudes, and two empirical relations turn the reddening-corrected colours into [Fe/H]—one for RGB stars and one for supergiants. The resulting individual estimates have median propagated errors of 0.6–0.8 dex, so the argument does not rest on any single star; it rests on the median of thousands of stars per radial bin, after zero-point recalibration against the APOGEE spectroscopic sample (a constant shift for the SMC and for supergiants, a radially varying shift for LMC RGB stars). Piecewise regression then locates the breakpoints in the binned median profile, and Voronoi binning with 100 stars per bin produces the metallicity maps.
What would settle it
Derive the LMC RGB radial profile using only stars with photometric [Fe/H] uncertainty below about 0.3 dex, giving a few thousand high-quality stars. If the breakpoints at 5, 9, and 13 kpc move or disappear in that subsample, they are artefacts of the radially varying recalibration or of noise rather than genuine breaks in chemical structure; if they survive, the piecewise structure is real.
Extended reading notes
Core claim
The central claim is that photometric metallicities computed from synthetic Strömgren photometry of Gaia DR3 XP spectra, calibrated with two literature relations and recalibrated in zero point against the APOGEE spectroscopic sample, trace the true [Fe/H] of old (RGB) and young (supergiant) stars across the entire LMC and SMC. On the paper's own terms, the overall radial metallicity gradients of both galaxies decrease from centre to outskirts in both populations, but each profile is better described by a piecewise-linear model with multiple breakpoints than by one straight line. The breakpoints isolate distinct radial regimes: the SMC RGB profile breaks at 1, 5, and 7 kpc; the LMC RGB profile at 2, 5, 9, and 13 kpc; SMC supergiants break at 1 kpc; and LMC supergiants at 4 and 7 kpc, with some segments showing opposite (positive or flat) slopes. The paper also provides the catalogues of recalibrated photometric metallicities, making the maps a reusable product.
Load-bearing premise
The load-bearing premise is that the median of individually noisy photometric metallicities, after zero-point shifts calibrated against a spectroscopic survey, still traces the true radial abundance profile even though the per-star errors are larger than the measured gradients, and that the recalibration does not erase real features.
Editorial extensions
If this is right
- If the paper is right, the Magellanic Clouds' radial metallicity structure is not a single smooth decline: piecewise models with multiple breakpoints are required, and different radial segments can have slopes of opposite sign.
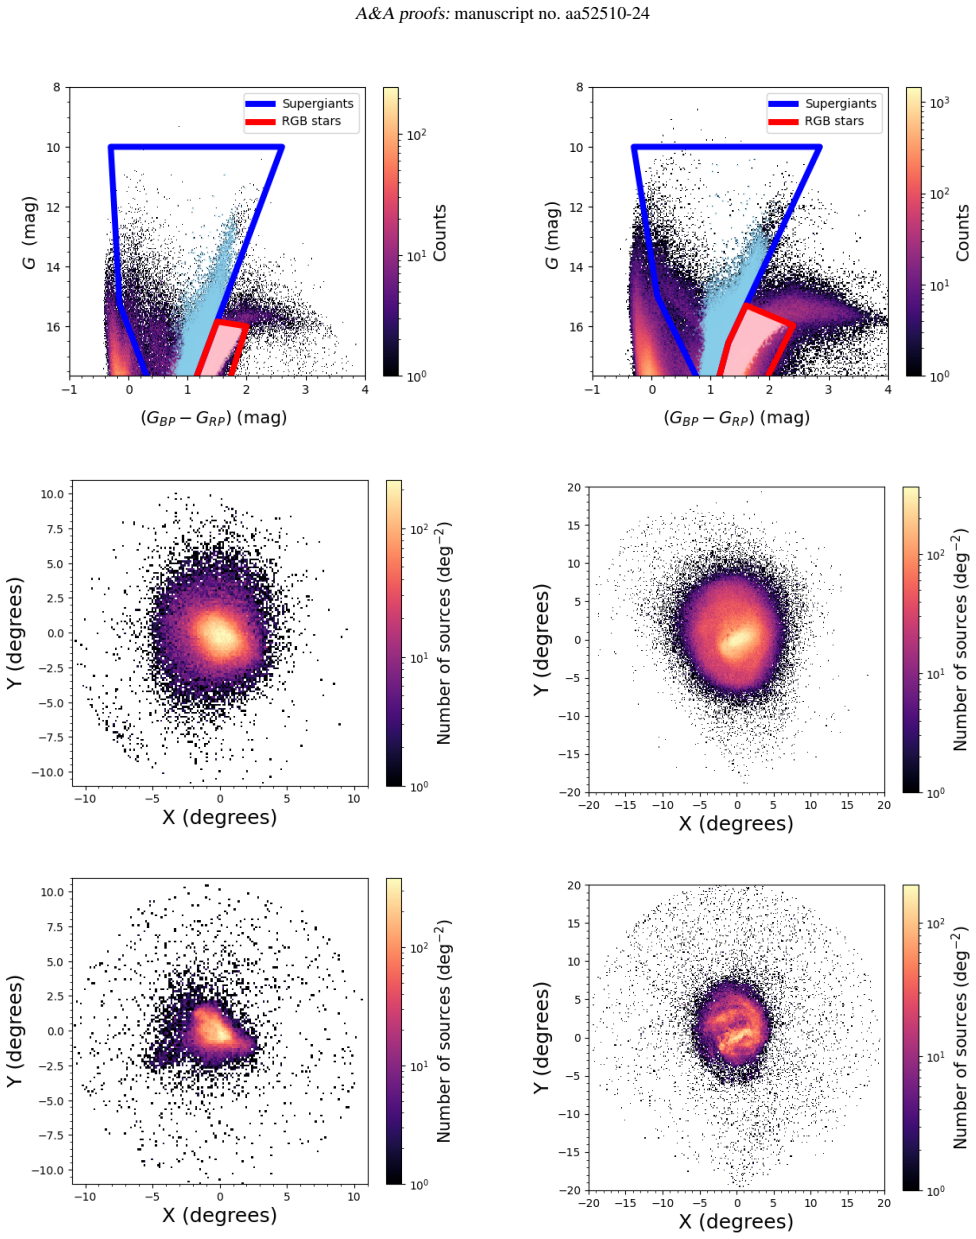
- The homogeneous method produces usable maps for about 90,000 young and 270,000 old stars over roughly 11 degrees around the SMC and 20 degrees around the LMC, with bin sizes of 0.25–0.5 square degrees and Voronoi bins of 100 stars.
- The pipeline can be applied to fainter stars once future Gaia data releases provide XP spectra below the current ~17.65 mag limit, extending the same analysis to larger samples.
- Young supergiants are metal-richer than old RGB stars in both Clouds, and the two populations show different radial structure, implying that chemical enrichment and dynamical response differ by generation.
Reading between the lines
- Beyond the paper: if the breakpoints survive independent spectroscopy, they would give a chemical chronology of interaction events; for instance, the LMC break near 5 kpc coincides with the reported misalignment of the inner disc, which would tie a change in metal distribution to a recent SMC encounter.
- Beyond the paper: the positive central gradients within 1–2 kpc may be partly caused by crowding and missing sources, so a direct test is to re-derive the inner profiles with crowding-corrected or deeper data before interpreting them as real chemical features.
- Beyond the paper: the same synthetic-Strömgren pipeline could be applied to other Local Group dwarf galaxies with Gaia XP spectra, producing a uniform multi-galaxy metallicity map in which the Clouds' breakpoints could be compared with those of less disturbed dwarfs.
Editorial analysis
A structured set of objections, weighed in public.
Referee Report
Summary. This paper derives photometric metallicities for ~271,000 red-giant and ~90,000 supergiant stars in the Magellanic Clouds by computing synthetic Strömgren magnitudes from Gaia DR3 XP spectra with GaiaXPy and applying literature calibrations (Calamida et al. 2007 for RGB stars; Grebel & Richtler 1992 for supergiants). The metallicities are compared with and recalibrated against APOGEE spectroscopic values, then used to construct Hess and Voronoi metallicity maps and to fit radial metallicity gradients, both as single linear slopes and as piecewise-linear models with breakpoints. The main results are overall negative gradients for both galaxies and populations (Tables 1 and 2), with multiple breakpoints that the authors associate with bars, spiral arms, crowding, and tidal interactions.
Significance. If the results are robust, the paper would provide a valuable homogeneous, spatially extended metallicity-map product for both an old and a young stellar population in the LMC/SMC, including a public catalogue, and an interesting extension of synthetic-photometry methods to supergiants. The use of external APOGEE data for zero-point calibration and the explicit comparison with previous work are strengths. However, the headline claims about individual breakpoints and even the central decreasing-gradient narrative are not yet secure: individual [Fe/H] errors are large (median 0.6–0.8 dex), and the LMC RGB sample is recalibrated with radially varying APOGEE offsets whose step-like structure may imprint artificial features on the very gradients being measured. The paper also honestly acknowledges several limitations (crowding at the centre, low outer-bin counts, possible projection effects), but those limitations are not fully propagated into the strength of the abstract's conclusions.
major comments (3)
- [§5.3, Figure B.1, Table 2] The reported LMC RGB breakpoints (2, 5, 9, 13 kpc) may be artifacts of the radially varying APOGEE zero-point recalibration. Section 5.3 and Figure B.1 show that the LMC RGB offset changes from ~0.7 dex in the centre to ~0.3 dex and then ~0.5 dex in the outer bins, and these offsets are applied as per-annulus constants. This introduces step discontinuities in the recalibrated [Fe/H] at the annulus boundaries, and the same recalibrated values are then fed into the piecewise-regression. The offset steps are up to ~0.4 dex, comparable to the total gradient amplitude over the affected radial range, so this is not a small correction. In addition, the validation is partly circular: APOGEE defines the zero points that the method is then said to agree with. I request a robustness test using a smooth radial recalibration (e.g., a low-order polynomial fit to the offset as a function of radius) and a check of whether the breakpoints and their uncertainties survive; it would also help to quote the annulus boundaries in kpc and compare them directly with the fitted breakpoint radii. The constant 0.4 dex shift applied to the SMC RGB and to the supergiants cannot imprint radial structure and is therefore less concerning, although the tests are still needed for the LMC supergiant breakpoints if any radial recalibration were applied therein.
- [§4.1, §4.2, §5.5, Tables 1–2] The load-bearing assumption that binned median photometric [Fe/H] values recover the true radial profile is not demonstrated. The median propagated errors are ~0.6 dex for RGB stars and ~0.6–0.8 dex for supergiants, while the fitted segment slopes are per-kpc changes as small as 0.02–0.05 dex and the radial bins are 0.2–1 kpc wide. A large sample size does not by itself guarantee that medians are unbiased when measurement errors are heteroscedastic, correlate with colour or crowding, and when the sample is incomplete at the centre. The paper states that no further cut on [Fe/H] errors was applied to preserve sample size, but the effect of this on the gradient recovery is not quantified. I ask for a simulation in which a known input metallicity profile is convolved with the quoted error distribution and selection function, then recovered with the same binning and piecewise-regression procedure; the resulting biases and breakpoint false-positive rates should be reported.
- [§6.1, §6.2, Tables 1–2] The abstract's statement that the gradients decrease from the centre to the outskirts is not uniformly supported by the paper's own best-fit segments. Tables 1 and 2 list positive inner gradients for both galaxies and populations (SMC RGB 0.079±0.014 dex/kpc, LMC RGB 0.127±0.026 dex/kpc, LMC supergiants 0.025±0.014 dex/kpc over part of the range), and the LMC RGB has a positive segment at 9–13 kpc. The authors attribute the central positive gradients to crowding and incompleteness, but this attribution is not turned into a quantitative correction or a reliability flag in the abstract. The central gradients should either be reported as completeness-limited or the global statement should be restricted to the regions where the data are demonstrably reliable.
minor comments (4)
- [Table D.1] In Appendix D, the supergiant gradient for R>1 is printed as 0.058±0.008 dex/deg, whereas the corresponding entry in Table 1 and the discussion in §5.6 give -0.058±0.008 dex/kpc; the sign appears to be missing in the appendix table.
- [§5.2] The sentence describing the cross-matched APOGEE sample would be clearer if it distinguished the 4308 RGB and 1212 supergiant matches from the initial ~70,000 APOGEE sources and stated whether the APOGEE selection criteria for the LMC and SMC were identical.
- [§6.1] The discussion of Dias et al. (2022) is ambiguous: it should say explicitly whether the projected gradient disappears or is not detectable when three-dimensional cluster distances are used, and how that affects the interpretation of the present projected gradients.
- [§6.3] The paper would benefit from a short statement in the conclusions reiterating that the breakpoint radii are model-dependent and should be interpreted with caution where the APOGEE radial recalibration was applied, rather than only mentioning crowding and outer-bin limitations.
Circularity Check
LMC RGB metallicity breakpoints are partly imprinted by the radially varying APOGEE recalibration, making part of the key claim circular.
-
fitted input called prediction
[Section 5.3 (Radial recalibration), applied in Section 5.5 and Table 2]
"Therefore, radial recalibration is applied to the RGB stars in the LMC. For the defined radial bins shown in Figure B.1, we utilise the corresponding peak difference rather than a constant value."
The LMC RGB photometric [Fe/H] is shifted by a per-annulus offset derived from APOGEE, with the offset varying from 0.7 dex in the centre to 0.3 dex and then 0.5 dex outward. This makes the recalibrated radial profile equal to the photometric profile plus a stepwise APOGEE-imposed function. Section 5.5 then fits piecewise regression to these recalibrated values, so the reported LMC RGB breakpoints (2, 5, 9, 13 kpc) and the overall gradient (-0.062 dex/kpc) are not independent photometric measurements; they partially inherit the radial structure of the calibration offsets. The agreement with APOGEE used as validation is likewise by construction, because the offsets were chosen to equalise the photometric and spectroscopic peak in each radial bin.
full rationale
The photometric metallicity estimates are based on external literature calibrations (Calamida et al. 2007; Grebel & Richtler 1992), and the SMC RGB, SMC supergiant, and LMC supergiant gradients use only a constant APOGEE zero-point offset, which cannot imprint radial structure; those results are not circular. The circularity is confined to the LMC RGB gradient and its breakpoints, where Section 5.3 applies radially varying APOGEE offsets before the piecewise-regression fit in Section 5.5. Because the offsets themselves change by about 0.4 dex across the galaxy, the shape of the recalibrated profile is substantially determined by the calibration input, so the novel breakpoint claim for the LMC RGB is partly forced by the fit rather than measured from the photometry alone. The paper would need a constant-offset or smooth-recalibration test to show that the breakpoints survive. The rest of the analysis contains independent content, so the score is partial, not total.
Assumptions & free parameters
free parameters (5)
- SMC RGB APOGEE zero-point shift =
0.4 dex (constant)
- LMC RGB APOGEE zero-point shift =
Radial-bin dependent, approximately 0.7 dex at the centre and 0.3 to 0.5 dex outside
- Supergiant APOGEE zero-point shift =
0.4 dex (constant); peak difference measured as 0.35 dex
- Piecewise-regression breakpoint radii =
SMC RGB 1, 5, 7 kpc; LMC RGB 2, 5, 9, 13 kpc; SMC supergiants 1 kpc; LMC supergiants 4, 7 kpc
- Voronoi bin size =
100 sources per bin
assumptions (6)
- domain assumption GaiaXPy standardized synthetic Strömgren magnitudes (v, b, y) are accurate for Magellanic Cloud sources.
- domain assumption Calamida et al. (2007) calibration (Eq. 1) is valid for MC RGB stars with 0.85 <= (v-y)0 <= 3 and -2.2 <= [Fe/H] <= -0.7.
- domain assumption Grebel and Richtler (1992) calibration (Eq. 2) is valid for MC supergiants with 0.4 <= (b-y)0 <= 1.1.
- domain assumption Skowron et al. (2021) and Schlegel et al. (1998) reddening maps give accurate E(B-V) for each star, with the adopted extinction ratio conversions.
- domain assumption The CMD polygons from Gaia Collaboration et al. (2021b) isolate RGB and supergiant populations without significant contamination.
- domain assumption APOGEE spectroscopic [Fe/H] is on the same metallicity scale as the Strömgren photometric calibrations, so zero-point offsets can be transferred.
Cite this review
Pith. "Pith review of Str\"omgren photometric metallicity map of the Magellanic Cloud stars using Gaia DR3--XP spectra." pith.science (2026). https://pith.science/paper/VJ5JVKBY
@misc{pith2026250610749,
  author       = {Pith},
  title        = {Pith review of: Str\"omgren photometric metallicity map of the Magellanic Cloud stars using Gaia DR3--XP spectra},
  year         = {2026},
  howpublished = {\url{https://pith.science/paper/VJ5JVKBY}},
  note         = {Machine review of arXiv:2506.10749}
}
read the original abstract
One important key in understanding a galaxy's evolution is to study the consequences of its past dynamical interactions that influenced its shape. By measuring the metallicity distribution of stellar populations with different ages, one can learn about these interactions. The Magellanic Clouds, being the nearest pair of interacting dwarf galaxies with a morphology characterised by different tidal and kinematic sub-structures as well as a vast range of stellar populations, represent an excellent place to study the consequences of dwarf-dwarf galaxy interactions and with their large host, the Milky Way. We aim to determine the metallicities ([Fe/H]) of red giant branch (old) and supergiant (young) stars covering the entire galaxies, estimate their radial metallicity gradients and produce homogeneous metallicity maps. We use the XP spectra from Gaia Data Release 3 to calculate synthetic Str\"omgren magnitudes from the application of the GaiaXPy tool and adopt calibration relations from the literature to estimate the metallicities. We present photometric metallicity maps for ~90,000 young stars and ~270,000 old stars within ~11 deg of the Small Magellanic Cloud and ~20 deg of the Large Magellanic Cloud from a homogeneous dataset. We find that the overall radial metallicity gradients decrease linearly in agreement with previous studies. We apply piecewise-regression fitting to derive the gradients within different radial regions. The overall metallicity gradients, traced by young and old stars, decrease from the centre to the outskirts of both galaxies. However, they show multiple breakpoints depicting regions following different and sometime opposite trends. These are associated to the structure of the galaxies, their history of star formation and chemical evolution but may be influenced by a low number of sources, especially at the centre (due to crowding) and in the outermost regions.
Figures


Figures from the paper (5 more)


Reference graph
Works this paper leans on
- [1]
-
[2]
Almeida, A., Majewski, S. R., Nidever, D. L., et al. 2024, MNRAS, 529, 3858
work page 2024
-
[3]
2023, ApJS, 267, 8 Árnadóttir, A
Andrae, R., Rix, H.-W., & Chandra, V . 2023, ApJS, 267, 8 Árnadóttir, A. S., Feltzing, S., & Lundström, I. 2010, A&A, 521, A40
work page 2023
-
[4]
Bagheri, G., Cioni, M. R. L., & Napiwotzki, R. 2013, A&A, 551, A78
2013
- [5]
-
[6]
2023, A&A, 674, A194
Bellazzini, M., Massari, D., De Angeli, F., et al. 2023, A&A, 674, A194
2023
-
[7]
J., et al
Belokurov, V ., Erkal, D., Deason, A. J., et al. 2017, MNRAS, 466, 4711
2017
- [8]
Show all 76 references
-
[9]
A., Clayton, G
Cardelli, J. A., Clayton, G. C., & Mathis, J. S. 1989, ApJ, 345, 245
1989
-
[10]
C., Noël, N
Carrera, R., Conn, B. C., Noël, N. E. D., Read, J. I., & López Sánchez, Á. R. 2017, MNRAS, 471, 4571
2017
-
[11]
2008, AJ, 136, 1039
Carrera, R., Gallart, C., Aparicio, A., et al. 2008, AJ, 136, 1039
2008
-
[12]
P., Conroy, C., et al
Chandra, V ., Naidu, R. P., Conroy, C., et al. 2023, ApJ, 956, 110
2023
-
[13]
L., Olsen, K., et al
Choi, Y ., Nidever, D. L., Olsen, K., et al. 2018, ApJ, 866, 90
2018
-
[14]
2021, MNRAS, 507, 4752
Choudhury, S., de Grijs, R., Bekki, K., et al. 2021, MNRAS, 507, 4752
2021
-
[15]
2020, MNRAS, 497, 3746
Choudhury, S., de Grijs, R., Rubele, S., et al. 2020, MNRAS, 497, 3746
2020
-
[16]
A., & Sohn, Y
Choudhury, S., Subramaniam, A., Cole, A. A., & Sohn, Y . J. 2018, MNRAS, 475, 4279
2018
-
[17]
Cioni, M. . R. L., Storm, J., Bell, C. P. M., et al. 2019, The Messenger, 175, 54
2019
-
[18]
Cioni, M. R. L. 2009, A&A, 506, 1137
2009
-
[19]
Cioni, M. R. L., Habing, H. J., & Israel, F. P. 2000, A&A, 358, L9
2000
-
[20]
F., Milone, A
Cordoni, G., Marino, A. F., Milone, A. P., et al. 2023, A&A, 678, A155
2023
-
[21]
Crawford, D. L. & Mandwewala, N. 1976, PASP, 88, 917 De Angeli, F., Weiler, M., Montegriffo, P., et al. 2023, A&A, 674, A2 De Bortoli, B. J., Parisi, M. C., Bassino, L. P., et al. 2022, A&A, 664, A168 de Grijs, R. & Bono, G. 2015, AJ, 149, 179 de Grijs, R., Wicker, J. E., & Bo...
1976
-
[22]
C., Angelo, M., et al
Dias, B., Parisi, M. C., Angelo, M., et al. 2022, MNRAS, 512, 4334
2022
-
[23]
Diaz, J. D. & Bekki, K. 2012, ApJ, 750, 36
2012
-
[24]
D., Cole, A
Dobbie, P. D., Cole, A. A., Subramaniam, A., & Keller, S. 2014, MNRAS, 442, 1680 El Youssoufi, D., Cioni, M.-R. L., Bell, C. P. M., et al. 2021, MNRAS El Youssoufi, D., Cioni, M.-R. L., Bell, C. P. M., et al. 2019, MNRAS, 490, 1076
2014
-
[25]
Fall, S. M. & Efstathiou, G. 1980, MNRAS, 193, 189
1980
-
[26]
W., Abedigamba, O
Feast, M. W., Abedigamba, O. P., & Whitelock, P. A. 2010, MNRAS, 408, L76
2010
-
[27]
2024, arXiv e- prints, arXiv:2403.08516 Gaia Collaboration, Brown, A
Frankel, N., Andrae, R., Rix, H.-W., Povick, J., & Chandra, V . 2024, arXiv e- prints, arXiv:2403.08516 Gaia Collaboration, Brown, A. G. A., Vallenari, A., et al. 2021a, A&A, 649, A1 Gaia Collaboration, Brown, A. G. A., Vallenari, A., et al. 2016, A&A, 595, A2 Gaia Collaborati...
2024 arXiv
-
[28]
A., Mucciarelli, A., Origlia, L., et al
Gonzalez, O. A., Mucciarelli, A., Origlia, L., et al. 2020, The Messenger, 180, 18 Article number, page 14 of 20 Omkumar et al.: Metallicity maps of the Clouds
2020
-
[29]
Grady, J., Belokurov, V ., & Evans, N. W. 2021, ApJ, 909, 150
2021
-
[30]
Grebel, E. K. & Richtler, T. 1992, A&A, 253, 359
1992
-
[31]
K., Duffau, S., & Jin, S
Haschke, R., Grebel, E. K., Duffau, S., & Jin, S. 2012, AJ, 143, 48
2012
-
[32]
2000, A&A, 355, 994
Hilker, M. 2000, A&A, 355, 994
2000
-
[33]
2014, MNRAS, 439, 788
Hughes, J., Wallerstein, G., Dotter, A., & Geisler, D. 2014, MNRAS, 439, 788
2014
-
[34]
M., Mróz, P., Kruszy´nska, K., et al
Jacyszyn-Dobrzeniecka, A. M., Mróz, P., Kruszy´nska, K., et al. 2020, ApJ, 889, 26
2020
-
[35]
M., Skowron, D
Jacyszyn-Dobrzeniecka, A. M., Skowron, D. M., Mróz, P., et al. 2016, Acta As- tron., 66, 149
2016
-
[36]
M., Skowron, D
Jacyszyn-Dobrzeniecka, A. M., Skowron, D. M., Mróz, P., et al. 2017, Acta As- tron., 67, 1
2017
-
[37]
O., et al
James, D., Subramanian, S., Omkumar, A. O., et al. 2021, MNRAS, 508, 5854
2021
-
[38]
2024, AJ, 167, 123
Li, Y ., Jiang, B., & Ren, Y . 2024, AJ, 167, 123
2024
-
[39]
D., Koposov, S
Mackey, A. D., Koposov, S. E., Erkal, D., et al. 2016, MNRAS, 459, 239
2016
-
[40]
2018, ApJ, 858, L21
Mackey, D., Koposov, S., Da Costa, G., et al. 2018, ApJ, 858, L21
2018
-
[41]
L., & Olsen, K
Massana, P., Nidever, D. L., & Olsen, K. 2023, MNRAS, 527, 8706
2023
-
[42]
Massana, P., Noël, N. E. D., Nidever, D. L., et al. 2020, MNRAS, 498, 1034
2020
-
[43]
2017, MNRAS, 473, 3131
Muraveva, T., Subramanian, S., Clementini, G., et al. 2017, MNRAS, 473, 3131
2017
-
[44]
2021, A&A, 647, A135
Narloch, W., Pietrzy´nski, G., Gieren, W., et al. 2021, A&A, 647, A135
2021
-
[45]
2022, A&A, 666, A80
Narloch, W., Pietrzy´nski, G., Gieren, W., et al. 2022, A&A, 666, A80
2022
-
[46]
L., Majewski, S
Nidever, D. L., Majewski, S. R., Muñoz, R. R., et al. 2011, ApJ, 733, L10
2011
-
[47]
L., Rubele, S., et al
Niederhofer, F., Cioni, M.-R. L., Rubele, S., et al. 2021, MNRAS, 502, 2859
2021
-
[48]
L., Schmidt, T., et al
Niederhofer, F., Cioni, M.-R. L., Schmidt, T., et al. 2022, MNRAS, 512, 5423 Noël, N. E. D., Conn, B. C., Carrera, R., et al. 2013, ApJ, 768, 109 Noël, N. E. D., Conn, B. C., Read, J. I., et al. 2015, MNRAS, 452, 4222
2022
-
[49]
Oliveira, R. A. P., Maia, F. F. S., Barbuy, B., et al. 2023, MNRAS, 524, 2244
2023
-
[50]
Olsen, K. A. G. & Salyk, C. 2002, AJ, 124, 2045
2002
-
[51]
O., Subramanian, S., Niederhofer, F., et al
Omkumar, A. O., Subramanian, S., Niederhofer, F., et al. 2021, MNRAS, 500, 2757
2021
-
[52]
C., Geisler, D., Carraro, G., et al
Parisi, M. C., Geisler, D., Carraro, G., et al. 2016, AJ, 152, 58
2016
-
[53]
E., Pietrzy ´nski, G., Narloch, W., Górski, M., & Graczyk, D
Piatti, A. E., Pietrzy ´nski, G., Narloch, W., Górski, M., & Graczyk, D. 2019, MNRAS, 483, 4766
2019
-
[54]
2021, Journal of Open Source Software, 6, 3859
Pilgrim, C. 2021, Journal of Open Source Software, 6, 3859
2021
-
[55]
T., Nidever, D
Povick, J. T., Nidever, D. L., Majewski, S. R., et al. 2023a, arXiv e-prints, arXiv:2309.12503
-
[56]
T., Nidever, D
Povick, J. T., Nidever, D. L., Massana, P., et al. 2023b, arXiv e-prints, arXiv:2310.14299
-
[57]
1998, Nature, 394, 752
Putman, M., Gibson, B., Staveley-Smith, L., et al. 1998, Nature, 394, 752
1998
-
[58]
E., Staveley-Smith, L., Freeman, K
Putman, M. E., Staveley-Smith, L., Freeman, K. C., Gibson, B. K., & Barnes, D. G. 2003, ApJ, 586, 170
2003
-
[59]
J., & Beraldo E Silva, L
Rathore, H., Besla, G., Daniel, K. J., & Beraldo E Silva, L. 2025a, arXiv e-prints, arXiv:2504.16163
-
[60]
A., et al
Recio-Blanco, A., de Laverny, P., Palicio, P. A., et al. 2023, A&A, 674, A29
2023
-
[61]
W., et al
Riello, M., De Angeli, F., Evans, D. W., et al. 2021, A&A, 649, A3
2021
-
[62]
L., Moretti, M
Ripepi, V ., Cioni, M.-R. L., Moretti, M. I., et al. 2017, MNRAS, 472, 808
2017
-
[63]
2018, MNRAS, 478, 5017
Rubele, S., Pastorelli, G., Girardi, L., et al. 2018, MNRAS, 478, 5017
2018
-
[64]
& Subramanian, S
Saroon, S. & Subramanian, S. 2022, A&A, 666, A103
2022
-
[65]
Schlafly, E. F. & Finkbeiner, D. P. 2011, ApJ, 737, 103
2011
-
[66]
J., Finkbeiner, D
Schlegel, D. J., Finkbeiner, D. P., & Davis, M. 1998, ApJ, 500, 525
1998
-
[67]
L., Madore, B
Scowcroft, V ., Freedman, W. L., Madore, B. F., et al. 2016, ApJ, 816, 49
2016
-
[68]
M., Jacyszyn, A
Skowron, D. M., Jacyszyn, A. M., Udalski, A., et al. 2014, ApJ, 795, 108
2014
-
[69]
M., Skowron, J., Udalski, A., et al
Skowron, D. M., Skowron, J., Udalski, A., et al. 2021, ApJS, 252, 23 Strömgren, B. 1963, QJRAS, 4, 8 Strömgren, B. 1964, Rev. Mod. Phys., 36, 532
2021
-
[70]
& Subramanian, S
Subramaniam, A. & Subramanian, S. 2009, ApJ, 703
2009
-
[71]
2022, A&A, 665, A92 van den Bosch, F
Taibi, S., Battaglia, G., Leaman, R., et al. 2022, A&A, 665, A92 van den Bosch, F. C. 2002, MNRAS, 331, 98 van der Marel, R. P. & Cioni, M.-R. L. 2001, AJ, 122, 1807
2022
-
[72]
2024, arXiv e-prints, arXiv:2408.17250
Viswanathan, A., Byström, A., Starkenburg, E., et al. 2024, arXiv e-prints, arXiv:2408.17250
2024
-
[73]
& Sarajedini, A
Wagner-Kaiser, R. & Sarajedini, A. 2013, MNRAS, 431, 1565
2013
-
[74]
& Sarajedini, A
Wagner-Kaiser, R. & Sarajedini, A. 2017, MNRAS, 466, 4138
2017
-
[75]
2023, arXiv e-prints, arXiv:2312.07219
Yuxi, Lu, Buck, T., et al. 2023, arXiv e-prints, arXiv:2312.07219
2023 arXiv
-
[76]
E., Chojnowski, S
Zasowski, G., Cohen, R. E., Chojnowski, S. D., et al. 2017, AJ, 154, 198 Article number, page 15 of 20 A&A proofs:manuscript no. aa52510-24 Appendix A: Metallicity recalibration using APOGEE Figure A.1 shows the metallicity distribution of the RGB sources in common between our...
2017
Reviewed August 7, 2026 · model on record in the stance chip above.
Discussion (0). Continue with ORCID to comment.