REVIEW 4 major objections 6 minor 77 references
Hydrodynamical modelling of Type IIb SNe
T0 review · 4 major / 6 minor · reviewed 2026-08-07 · deepseek-v4-flash
Pith's one-line read Most Type IIb supernovae arise from low-mass progenitors whose envelopes were stripped by binary companions.
desk verdict Solid new grid-fitting work with a clean degeneracy result, but the headline IMF fractions rest on an unpublished mass conversion and the draft is not yet ready. read the letter →
The pith
A machine-rendered reading of the paper's core claim, the machinery that carries it, and where it could break.
The reading
What carries the argument
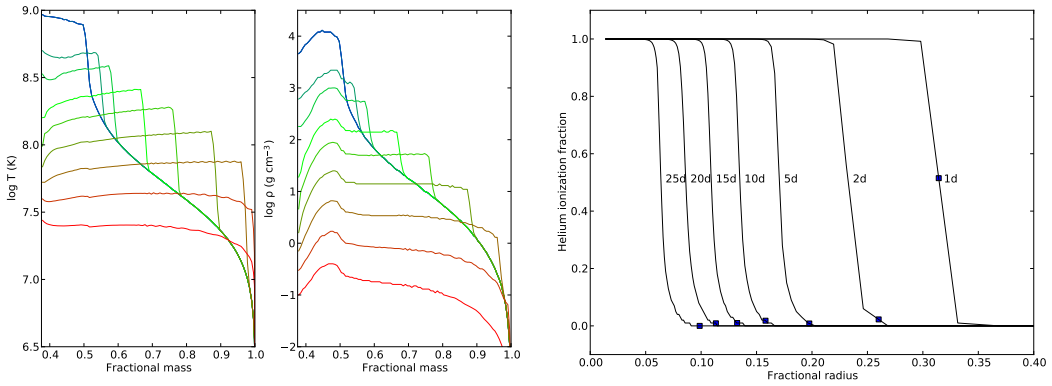
The argument is carried by HYDE, a one-dimensional hydrodynamical code built on the diffusion approximation, which treats the explosion as a thermal bomb and follows the coupled radiation-hydrodynamics of the ejecta with standard opacity tables, an opacity floor calibrated against more detailed codes, and Monte-Carlo deposition of radioactive decay energy. The model grid is built from solar-metallicity bare helium-core progenitors evolved with MESA to the verge of core collapse, spanning helium-core masses $2.5$ to $10\,M_\odot$, explosion energies from $0.4\times10^{51}$ to $6\times10^{51}$ erg, $^{56}\mathrm{Ni}$ masses from $0.015$ to $0.3\,M_\odot$, and mixing parameters. The key object is the helium-core mass, because for Type IIb SNe the hydrogen envelope is nearly gone and the helium-core mass is directly linked to the initial stellar mass; the automated fitter minimizes relative residuals of the diffusion-phase lightcurve, the tail lightcurve, and the photospheric velocity evolution, and propagates errors in distance, extinction, and velocity.
What would settle it
A volume-limited sample of nearby Type IIb SNe with pre-explosion imaging that resolves a majority of progenitors at initial masses above about 20 $M_\odot$ would contradict the paper's central claim.
Extended reading notes
Core claim
On the paper's own terms, the central discovery is an empirical statement about Type IIb progenitors: fitting the observed bolometric lightcurves and photospheric velocities of 17 Type IIb SNe to hydrodynamic explosion models of bare helium cores yields helium-core masses that, after conversion through stellar models, give a distribution of initial masses with 56 percent below 15 $M_\odot$ and 81 percent below 20 $M_\odot$, and an under-population above 25 $M_\odot$ relative to a Salpeter IMF. Since standard single-star evolution at solar metallicity expects hydrogen-envelope loss only above roughly 25 $M_\odot$, the paper states the implication plainly: either the binary channel dominates Type IIb production or single-star mass loss is not understood. The same fits establish correlations between explosion energy and initial mass and between $^{56}\mathrm{Ni}$ mass and explosion energy, and they identify the error structure of the method: distance and extinction errors land mainly in the derived nickel mass, while photospheric velocity errors land mainly in the helium-core mass and explosion energy. The central discovery therefore has two layers: a claim about what most Type IIb progenitors are, and a methodological claim about how lightcurve and velocity data must be combined to measure them.
Load-bearing premise
The result rests on the assumption that solar-metallicity, non-rotating stellar models with standard single-star mass loss correctly turn a fitted helium-core mass into an initial stellar mass; if those mass-loss rates are wrong, the claimed IMF fractions and the binary-dominance conclusion shift.
Editorial extensions
If this is right
- If most Type IIb SNe come from stars below 20 $M_\odot$, then binary mass transfer rather than single-star winds must be the dominant hydrogen-stripping mechanism, and a substantial fraction of Type IIb remnants should have surviving companion stars.
- Photospheric velocity evolution is not optional: without it, fits are completely degenerate along the $M_{\mathrm{ej}}^2/E_{\mathrm{ej}}=\mathrm{const}$ curve, so helium-core mass and explosion energy cannot be separated from the bolometric lightcurve alone.
- Distance and extinction errors propagate mainly into the derived $^{56}\mathrm{Ni}$ mass, while photospheric velocity errors propagate mainly into the helium-core mass and explosion energy; improving velocity measurements is therefore the most effective path to sharper progenitor-mass estimates.
- The reported correlations between explosion energy, initial mass, and $^{56}\mathrm{Ni}$ mass support a picture in which more massive progenitors explode more energetically and synthesize more radioactive nickel, in agreement with earlier sample studies based on simpler models.
Reading between the lines
- Inference: if binary stripping dominates Type IIb production, deep imaging of recent Type IIb remnants should reveal surviving companion stars for a substantial fraction of events; the paper does not quantify a predicted detection rate.
- Inference: applying the same grid-fitting method to Type Ib and Ic SNe, whose ejecta masses are similarly low, could test whether the binary channel dominates those classes as well; the paper flags this as desirable but does not perform it.
- Inference: because the derived explosion energy is almost proportional to the opacity floor in HYDE, recalibrating that floor with a code that treats line opacity consistently could shift the absolute energy scale and the slope of the energy-mass correlation, while helium-core masses would be less affected.
- Inference: for future surveys of stripped-envelope SNe, the error analysis suggests that multi-epoch spectroscopic velocity measurements add more constraining power per observation than additional photometric epochs.
Editorial analysis
A structured set of objections, weighed in public.
Referee Report
Summary. The paper presents HYDE, a one-dimensional hydrodynamical code based on flux-limited diffusion, and uses it to construct a grid of supernova models from solar-metallicity bare helium-core MESA progenitors. The grid is fitted, via an automated procedure, to the bolometric lightcurves and photospheric velocities of 17 Type IIb SNe, yielding helium-core masses, explosion energies, 56Ni masses and mixing parameters, and explosion epochs. The authors derive correlations among explosion energy, helium-core mass and 56Ni mass, and convert the helium-core masses to initial masses to compare the sample with a Salpeter IMF. They report that 56% and 81% of the SNe have initial masses below 15 and 20 solar masses, respectively, and conclude that either the binary channel dominates Type IIb production or single-star mass-loss is poorly understood. The paper also includes an analysis of degeneracies and error propagation, a comparison with previous modelling of individual SNe and with the Lyman et al. (2014) sample, and an explicit discussion of limitations.
Significance. If the population-level results are correct, the paper would substantially strengthen the case that most Type IIb SNe arise from low-mass progenitors stripped by binary interaction, and it would provide one of the first hydrodynamical-model-based parameter studies of a sizeable Type IIb sample. The paper has clear technical strengths: the HYDE code is tested against analytic solutions, energy conservation, the Bersten et al. (2012) model, and low-mass hydrogen-envelope calculations; the fitting procedure includes explicit error propagation from distance, extinction and photospheric velocities; and the degeneracy analysis in Sect. 5.5 is informative. The authors are also transparent about the main limitations. However, the central quantitative claims—the 56%/81% initial-mass fractions and, to a lesser degree, the E-M_He correlation—depend on choices and conversions that are not yet fully documented or propagated, so the population-level conclusions are not reproducible from the manuscript as it stands.
major comments (4)
- [Sect. 5.6.2 / Fig. 18] The headline fractions (56% below 15 M_sun and 81% below 20 M_sun) and the comparison to a Salpeter IMF require converting the fitted helium-core masses in Tables 2 and 3 into initial stellar masses, but the manuscript never presents this M_He-to-M_init conversion or its uncertainty. Section 3.1 describes only solar-metallicity non-rotating 15 M_sun MESA models with adjusted mass-loss; no mapping for the full 2.5-10 M_sun grid is given. Because the single-star mass-loss prescriptions entering that conversion are the same physics against which the binary-channel conclusion is contrasted, the two branches of the dichotomy are not independent as quantified. Please provide the conversion (a figure, table or fitting formula), justify its applicability to binary-stripped progenitors, and propagate its systematic uncertainty into the quoted percentages.
- [Sect. 3.5 / Fig. 9] The opacity floor is calibrated by private communication (Bersten et al. 2012), and Fig. 9 shows that the inferred explosion energy is almost proportional to this floor over the plotted range, while the helium-core mass changes by roughly 25%. Because the explosion energy enters the E-M_He and E-M_Ni correlations directly, the sample-level conclusions in Sect. 5.6.1 need a propagated systematic: either refit the sample with the opacity floor varied across its plausible range, or add a floor-induced systematic term to the fitted exponents and report how the correlation indexes shift. The current single-model sensitivity study does not establish the effect on the sample statistics.
- [Sect. 3.2, footnote 1; Sect. 5] SNe 1996cb, 2003bg, 2011ei and 2011fu were fitted with an older grid based on mass-scaled 4 M_sun models with fixed Mix_Ni, while the final grid is not yet computed for M_He>7 M_sun and E>2.2x10^51 erg. These are the extreme, high-mass objects that anchor the high-mass end of the E-M_He relation and the >25 M_sun IMF bin. Please either recompute these fits with the final grid or quantify the offset between the old and new grids over their overlapping parameter space; without this, the high-mass statistics remain provisional.
- [Sect. 5.5 / 5.6.1 / Fig. 17] The paper notes that the E-M_He correlation is partly aligned with the M_ej^2/E_ej degeneracy curve, but it does not quantify how much of the fitted power-law index 1.8 survives when the covariance of the fits is taken into account. Several SNe in the sample (e.g., 2009K, 2011ei, 1996cb, 2011fu) have strongly degenerate contours in the E-M_He plane, so an unweighted power-law fit can bias the exponent. Please show the correlation with error ellipses or covariance information, or restrict the fit to SNe whose contours are well closed, and report the resulting index.
minor comments (6)
- [Sect. 2.2 vs Sect. 3.5] The helium-core opacity floor is given as 0.025 cm2 g^-1 in Sect. 2.2 but as 0.024 g^-1 cm2 in Sect. 3.5; the values should be made consistent.
- [Sect. 3.3, text near Eq. (7)] The text says an increase of explosion energy or decrease of ejecta mass should 'decrease the photospheric velocity', but Eq. (7) shows the photospheric velocity increasing with E and decreasing with M_ej; the wording needs to be corrected.
- [Fig. 18 caption] The caption lists bins as '8-15, 15-20, 20-25 and 25-30 M_sun', whereas the text in Sect. 5.6.2 says '10-15, 15-20, 20-25 and 25-30 M_sun'; these should be reconciled.
- [Sect. 3.2, footnote 4] Footnote 4 says 'a fixed mixing of the 56Ni (M_Ni=1.0)', which appears to be a typo for Mix_Ni=1.0; the notation should be corrected.
- [Sect. 5.6.2] The text contains the placeholder '(references)' after 'has been proposed by several authors'; the citations should be filled in.
- [Various] Several passages state that settings 'will be changed for the final version of the model grid', that zero error bars 'will be fixed in the final version', and that a figure 'only include[s]' a subset of SNe; these statements should be resolved in the published version.
Circularity Check
No significant circularity: fit outputs are not defined by the inputs, and the IMF-conversion gap is a reproducibility concern, not a definitional reduction.
full rationale
The central derivation chain is self-contained: observed bolometric lightcurves and photospheric velocities are least-squares fitted to a precomputed HYDE/MESA grid, yielding M_He, E, and M_Ni as genuine fit outputs (Sect. 5.2). These quantities are not defined in terms of the conclusions drawn from them. The M_ej^2/E_ej degeneracy is explicitly identified and quantified in Sect. 5.5, and the E-M_He correlation in Sect. 5.6.1 is flagged as partially aligned with that degeneracy, with agreement with the independent Lyman et al. (2014) results cited as a check. The opacity floor, a key input, is calibrated against the external STELLA code (Sect. 2.2), not against the target supernovae. The genuine weakness is the unstated M_He-to-M_initial conversion behind the Sect. 5.6.2 IMF bins and the 56%/81% fractions: the manuscript never displays the relation or propagates its uncertainty, so the quantitative population claim is not reproducible as written. That omission is a reproducibility and systematic-error problem, however, not a circular reduction; the initial masses are not defined by the observed lightcurves, and the abstract itself allows the alternative that single-star mass-loss is flawed. The same-author citations (E14a/E14b) supply data-reduction tools and a comparison object, but the population conclusion does not rest on a self-citation chain. No fitted parameter is renamed as a prediction, and no load-bearing uniqueness or ansatz is imported from the authors' prior work. Score 2 reflects minor self-citations and the undocumented mass conversion, not demonstrated circularity.
Assumptions & free parameters
free parameters (7)
- Opacity floor in helium core =
0.024 g^-1 cm^2 (0.01 in H envelope)
- Photospheric velocity systematic error =
15%
- Explosion energy E (per SN) =
0.64-3.60 x 10^51 erg in Tables 2-3
- Helium-core mass M_He (per SN) =
2.62-7.50 M_sun in Tables 2-3
- 56Ni mass M_Ni (per SN) =
0.032-0.231 M_sun in Tables 2-3
- 56Ni mixing fraction Mix_Ni (per SN) =
0.80-1.60 in Tables 2-3
- Explosion epoch (per SN) =
JD values in Tables 2-3
assumptions (8)
- domain assumption Type IIb SNe are well approximated by explosions of bare helium cores; the hydrogen envelope only affects the early cooling phase and photospheric velocities during the diffusion phase.
- domain assumption The helium-core mass is directly linked to initial mass via solar-metallicity, non-rotating MESA models with standard mass-loss.
- domain assumption Gray diffusion approximation with an opacity floor is adequate for bolometric lightcurves; line opacity and non-LTE effects are neglected.
- ad hoc to paper Mass cut fixed at 1.5 M_sun; explosion energy injected as thermal bomb at this location.
- ad hoc to paper 56Ni mass fraction declines linearly with ejecta mass, controlled by Mix_Ni.
- domain assumption The observed sample, though heterogeneous, is treated as representative for IMF comparison.
- domain assumption The bolometric correction determined from SN 2011dh applies to all Type IIb SNe in the sample.
- domain assumption Photospheric velocity from Fe II 5169 A absorption minimum corresponds to the model photospheric velocity.
Cite this review
Pith. "Pith review of Hydrodynamical modelling of Type IIb SNe." pith.science (2026). https://pith.science/paper/VNPD4LW3
@misc{pith2026250600543,
  author       = {Pith},
  title        = {Pith review of: Hydrodynamical modelling of Type IIb SNe},
  year         = {2026},
  howpublished = {\url{https://pith.science/paper/VNPD4LW3}},
  note         = {Machine review of arXiv:2506.00543}
}
abstract
We present HYDE, a new one-dimensional hydrodynamical code, and use it to construct a grid of supernova (SN) models based on solar-metallicity bare helium-core models evolved to the verge of core-collapse with MESA STAR. This grid is suited to model Type IIb SNe, which progenitor stars are thought to have lost all but a tiny fraction of their hydrogen envelopes. Using an automated procedure we fit the bolometric lightcurves and photospheric velocities for a large sample of (17) Type IIb SNe to the grid of SN models. We find that the distribution of initial masses for the sample can be reasonably well described by a standard Salpeter IMF, although there is an under-population in the >25 M$_\odot$ range. The fractions of SNe with initial masses <15 M$_\odot$ and <20 M$_\odot$ are 56 and 81 percent, respectively, suggesting either the binary channel to dominate the production of Type IIb SNe or a flaw in our understanding of single-star mass-loss. We find correlations between the explosion energy, initial mass and mass of $^{56}$Ni; the explosion energy increases with initial mass and the mass of $^{56}$Ni increases with explosion energy. The method used allows us to determine the errors in the model parameters arising from the observed quantities and the degeneracy of the solution. We find that an error in the distance and extinction propagates mainly to the derived mass of $^{56}$Ni, whereas an error in the photospheric velocity propagates mainly to the derived helium-core mass and explosion energy. Fits using the bolometric lightcurve alone are completely degenerate along the M$_{\mathrm{ej}}^{2}$/E$_{\mathrm{ej}}$=const curve, whereas fits using also the photospheric velocities are quite robust for well-sampled SNe. Finally, we provide a description and tests of the HYDE code, and a discussion of the limitations of the method used.
Figures


Figures from the paper (13 more)




Reference graph
Works this paper leans on
-
[1]
Alexander, D. R. & Ferguson, J. W. 1994, ApJ, 437, 879
work page 1994
-
[2]
Arnett, W. D. 1982, ApJ, 253, 785
1982
-
[3]
C., Benvenuto, O., & Hamuy, M
Bersten, M. C., Benvenuto, O., & Hamuy, M. 2011, ApJ, 729, 61
2011
-
[4]
Bersten, M. C., Benvenuto, O. G., Nomoto, K., et al. 2012, ApJ, 757, 31
work page 2012
-
[5]
I., Eastman, R., Bartunov, O
Blinnikov, S. I., Eastman, R., Bartunov, O. S., Popolitov, V . A., & Woosley, S. E. 1998, ApJ, 496, 454
1998
-
[6]
J., Immler, S., & Swift Satellite Team
Brown, P. J., Immler, S., & Swift Satellite Team. 2008, The Astronomer’s Tele- gram, 1403, 1
work page 2008
- [7]
-
[8]
2013, MNRAS, 434, 1098
Cano, Z. 2013, MNRAS, 434, 1098
2013
Show all 77 references
-
[9]
V ., Blondin, S., & Narayan, G
Chu, J., Li, W., Filippenko, A. V ., Blondin, S., & Narayan, G. 2008, Central Bureau Electronic Telegrams, 1271, 1
2008
-
[10]
2013, Central Bureau Electronic Telegrams, 3557, 1 Article number, page 16 of 17 M
Ciabattari, F., Mazzoni, E., Donati, S., et al. 2013, Central Bureau Electronic Telegrams, 3557, 1 Article number, page 16 of 17 M. Ergon et al.: Hydrodynamical modelling of Type IIb SNe
2013
-
[11]
2011, Central Bureau Electronic Tele- grams, 2827, 1
Ciabattari, F., Mazzoni, E., Jin, Z., et al. 2011, Central Bureau Electronic Tele- grams, 2827, 1
2011
-
[12]
2001, ArXiv Astrophysics e-prints
Deng, J., Qiu, Y ., & Hu, J. 2001, ArXiv Astrophysics e-prints
2001
-
[13]
2011, Central Bureau Electronic Telegrams, 2902, 1 Ekström, S., Georgy, C., Eggenberger, P., et al
Drescher, C., Parker, S., Brimacombe, J., et al. 2011, Central Bureau Electronic Telegrams, 2902, 1 Ekström, S., Georgy, C., Eggenberger, P., et al. 2012, A&A, 537, A146
2011
-
[14]
Eldridge, J. J. & Stanway, E. R. 2009, MNRAS, 400, 1019
2009
-
[15]
& Burrows, A
Ensman, L. & Burrows, A. 1992, ApJ, 393, 742
1992
-
[16]
Epstein, R. I. 1981, ApJ, 244, L89
1981
-
[17]
Falk, S. W. & Arnett, W. D. 1977, ApJS, 33, 515
1977
-
[18]
C., Kuncarayakti, H., et al
Folatelli, G., Bersten, M. C., Kuncarayakti, H., et al. 2014, ApJ, 792, 7
2014
-
[19]
D., Azalee Bostroem, K., Van Dyk, S
Fox, O. D., Azalee Bostroem, K., Van Dyk, S. D., et al. 2014, ApJ, 790, 17
2014
-
[20]
J., et al
Fraser, M., Ergon, M., Eldridge, J. J., et al. 2011, MNRAS, 417, 1417
2011
-
[21]
L., Madore, B
Freedman, W. L., Madore, B. F., Gibson, B. K., et al. 2001, ApJ, 553, 47
2001
-
[22]
B., Li, W., & Filippenko, A
Griffith, C., Cenko, S. B., Li, W., & Filippenko, A. V . 2009, Central Bureau Electronic Telegrams, 1685, 1
2009
-
[23]
2006, A&A, 457, 1015
Hamann, W.-R., Gräfener, G., & Liermann, A. 2006, A&A, 457, 1015
2006
-
[24]
A., et al
Hamuy, M., Deng, J., Mazzali, P. A., et al. 2009, ApJ, 703, 1612
2009
-
[25]
Iglesias, C. A. & Rogers, F. J. 1996, ApJ, 464, 943
1996
-
[26]
Imshennik, V . S. & Popov, D. V . 1992, AZh, 69, 497
1992
-
[27]
R., Nakasato, N., et al
Iwamoto, K., Young, T. R., Nakasato, N., et al. 1997, ApJ, 477, 865
1997
-
[28]
Jacques, C., Pimentel, E., & Monard, L. A. G. 2004, IAU Circ., 8418, 1
2004
-
[29]
2014, In preparation
Jerkstrand, A., Ergon, M., Smartt, S., et al. 2014, In preparation
2014
-
[30]
2011, A&A, 530, A45
Jerkstrand, A., Fransson, C., & Kozma, C. 2011, A&A, 530, A45
2011
-
[31]
2012, A&A, 546, A28
Jerkstrand, A., Fransson, C., Maguire, K., et al. 2012, A&A, 546, A28
2012
-
[32]
H., Lasher, G., Chan, K
Karp, A. H., Lasher, G., Chan, K. L., & Salpeter, E. E. 1977, ApJ, 214, 161
1977
-
[33]
D., Illingworth, G
Kelson, D. D., Illingworth, G. D., Tonry, J. L., et al. 2000, ApJ, 529, 768
2000
-
[34]
& Fransson, C
Kozma, C. & Fransson, C. 1992, ApJ, 390, 602
1992
-
[35]
B., Sahu, D
Kumar, B., Pandey, S. B., Sahu, D. K., et al. 2013, MNRAS, 431, 308
2013
-
[36]
M., Massey, P., Olsen, K
Levesque, E. M., Massey, P., Olsen, K. A. G., et al. 2005, ApJ, 628, 973
2005
-
[37]
Litvinova, I. I. & Nadezhin, D. K. 1983, Ap&SS, 89, 89
1983
-
[38]
Litvinova, I. Y . & Nadezhin, D. K. 1985, Soviet Astronomy Letters, 11, 145
1985
-
[39]
Lucy, L. B. 1999, A&A, 345, 211
1999
-
[40]
2014, ArXiv e-prints
Lyman, J., Bersier, D., James, P., et al. 2014, ArXiv e-prints
2014
-
[41]
J., et al
Maguire, K., Jerkstrand, A., Smartt, S. J., et al. 2012, MNRAS, 420, 3451
2012
-
[42]
2011, Central Bureau Electronic Telegrams, 2777, 1
Marples, P., Parker, S., Stritzinger, M., Drescher, C., & Bock, G. 2011, Central Bureau Electronic Telegrams, 2777, 1
2011
-
[43]
R., Fraser, M., Ergon, M., et al
Maund, J. R., Fraser, M., Ergon, M., et al. 2011, ApJ, 739, L37
2011
-
[44]
R., Smartt, S
Maund, J. R., Smartt, S. J., Kudritzki, R. P., Podsiadlowski, P., & Gilmore, G. F. 2004, Nature, 427, 129
2004
-
[45]
Mazzali, P. A. 2000, A&A, 363, 705
2000
-
[46]
A., Deng, J., Hamuy, M., & Nomoto, K
Mazzali, P. A., Deng, J., Hamuy, M., & Nomoto, K. 2009, ApJ, 703, 1624
2009
-
[47]
Mazzali, P. A. & Lucy, L. B. 1993, A&A, 279, 447
1993
-
[48]
& Weibel Mihalas, B
Mihalas, D. & Weibel Mihalas, B. 1984, Foundations of radiation hydrodynam- ics
1984
-
[49]
M., et al
Milisavljevic, D., Margutti, R., Soderberg, A. M., et al. 2013, ApJ, 767, 71
2013
-
[50]
Monard, L. A. G. 2005, Central Bureau Electronic Telegrams, 106, 1
2005
-
[51]
1991, A&A, 251, 505
Mueller, E., Fryxell, B., & Arnett, D. 1991, A&A, 251, 505
1991
-
[52]
& Zwitter, T
Munari, U. & Zwitter, T. 1997, A&A, 318, 269
1997
-
[53]
1996, IAU Circ., 6524, 1
Nakano, S., Aoki, M., Garnavich, P., Kirshner, R., & Berlind, P. 1996, IAU Circ., 6524, 1
1996
-
[54]
& Hashimoto, M
Nomoto, K. & Hashimoto, M. 1988, Phys. Rep., 163, 13
1988
-
[55]
2011, ApJS, 192, 3
Paxton, B., Bildsten, L., Dotter, A., et al. 2011, ApJS, 192, 3
2011
-
[56]
2013, ApJS, 208, 4
Paxton, B., Cantiello, M., Arras, P., et al. 2013, ApJS, 208, 4
2013
-
[57]
2009, Central Bureau Electronic Tele- grams, 1663, 1
Pignata, G., Maza, J., Hamuy, M., et al. 2009, Central Bureau Electronic Tele- grams, 1663, 1
2009
-
[58]
Piro, A. L. & Morozova, V . S. 2014, ApJ, 792, L11
2014
-
[59]
2013, MNRAS, 436, 3224
Poznanski, D. 2013, MNRAS, 436, 3224
2013
-
[60]
X., & Bloom, J
Poznanski, D., Prochaska, J. X., & Bloom, J. S. 2012, MNRAS, 426, 1465
2012
-
[61]
2004, IAU Circ., 8425, 1
Pugh, H., Park, S., & Li, W. 2004, IAU Circ., 8425, 1
2004
-
[62]
1996, IAU Circ., 6527, 1
Qiao, Q., Li, W., Qiu, Y ., et al. 1996, IAU Circ., 6527, 1
1996
-
[63]
1999, AJ, 117, 736
Qiu, Y ., Li, W., Qiao, Q., & Hu, J. 1999, AJ, 117, 736
1999
-
[64]
W., Treffers, R
Richmond, M. W., Treffers, R. R., Filippenko, A. V ., & Paik, Y . 1996, AJ, 112, 732
1996
-
[65]
W., Treffers, R
Richmond, M. W., Treffers, R. R., Filippenko, A. V ., et al. 1994, AJ, 107, 1022
1994
-
[66]
Schlafly, E. F. & Finkbeiner, D. P. 2011, ApJ, 737, 103
2011
-
[67]
J., Finkbeiner, D
Schlegel, D. J., Finkbeiner, D. P., & Davis, M. 1998, ApJ, 500, 525
1998
-
[68]
1994, ApJ, 420, 341
Shigeyama, T., Suzuki, T., Kumagai, S., et al. 1994, ApJ, 420, 341
1994
-
[69]
2004, IAU Circ., 8422, 2
Shimasaki, K., Li, W., Yamaoka, H., & Itagaki, K. 2004, IAU Circ., 8422, 2
2004
-
[70]
2014, ARA&A, 52, 487
Smith, N. 2014, ARA&A, 52, 487
2014
-
[71]
2014, ArXiv e-prints Takáts, K
Taddia, F., Sollerman, J., Leloudas, G., et al. 2014, ArXiv e-prints Takáts, K. & Vinkó, J. 2012, MNRAS, 419, 2783
2014
-
[72]
I., et al
Taubenberger, S., Navasardyan, H., Maurer, J. I., et al. 2011, MNRAS, 413, 2140
2011
-
[73]
Y ., V olkov, I
Tsvetkov, D. Y ., V olkov, I. M., Baklanov, P., Blinnikov, S., & Tuchin, O. 2009, Peremennye Zvezdy, 29, 2
2009
-
[74]
2003 Van Dyk, S
Turatto, M., Benetti, S., & Cappellaro, E. 2003 Van Dyk, S. D., Zheng, W., Fox, O. D., et al. 2014, AJ, 147, 37 V on Neumann, J. & Richtmyer, R. D. 1950, Appl. Phys., 21, 232
2003
-
[75]
M., Aldering, G., Nugent, P., & Chassagne, R
Wood-Vasey, W. M., Aldering, G., Nugent, P., & Chassagne, R. 2003, IAU Circ., 8082, 1
2003
-
[76]
E., Eastman, R
Woosley, S. E., Eastman, R. G., Weaver, T. A., & Pinto, P. A. 1994, ApJ, 429, 300
1994
-
[77]
Woosley, S. E. & Weaver, T. A. 1995, ApJS, 101, 181 Article number, page 17 of 17
1995
Reviewed August 7, 2026 · model on record in the stance chip above.
Discussion (0). Sign in to comment.