REVIEW 5 major objections 5 minor 1 cited by
The formation and evolution of Supermassive disks in IllustrisTNG
T0 review · 5 major / 5 minor · reviewed 2026-08-06 · deepseek-v4-flash
Pith's one-line read Supermassive disk galaxies are long-lived: roughly 60% of those present at z=0.5 still have disks at z=0, and the number of mergers, not stellar mass or environment, sets morphology.
desk verdict Useful TNG-based counterpoint to the Horizon-AGN rejuvenation scenario, but the merger mass-ratio definition needs tightening before the headline 48% figure can be trusted. read the letter →
The pith
A machine-rendered reading of the paper's core claim, the machinery that carries it, and where it could break.
The reading
What carries the argument
The load-bearing instrument is the morpho-kinematic classifier: the spin parameter $\lambda_R$, measured within three stellar half-mass radii, divided by the square root of the galaxy's ellipticity $\varepsilon$, with thresholds 0.31 and 0.71 taken from earlier fast/slow rotator work. This decides which massive galaxies count as disks. The second piece is the merger-impact parameter $\sum f_i/(1+z_i)^2$ (following Fragkoudi et al. 2020), where $f_i$ is the stellar mass ratio of each merger since $z=1$; it quantifies how much merging contributed to building a galaxy. A control sample of massive spheroids matched in stellar mass isolates the effect of morphology from the effect of mass.
What would settle it
Recompute the central fractions with an independent merger definition — for instance, defining merger time as the moment the stellar components fully coalesce, or using a higher-resolution run such as TNG50 — and check whether the 48% of strict-threshold disks with no significant merger since $z=1$ survives. If the fraction drops well below half under a different but valid tree, the claim that supermassive disks form with quiescent, gas-rich histories would be an artifact of the subhalo tracking.
Extended reading notes
Core claim
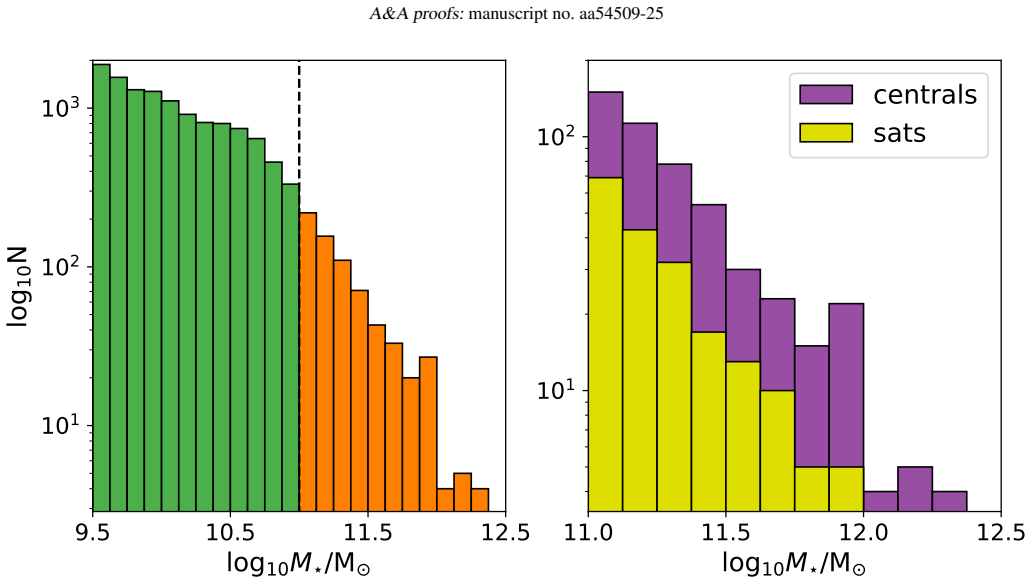
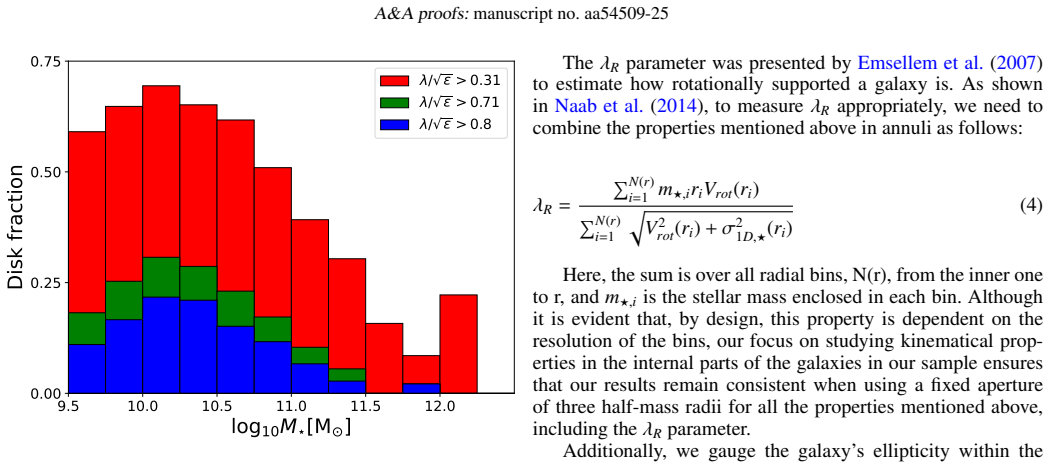
On its own terms, the paper establishes that supermassive disks are not a transient stage on the way to becoming spheroids. Of the 694 galaxies in TNG-100 with $\log_{10} M_\star/M_\odot \ge 11$, 220 satisfy the loose disk threshold ($\lambda_R/\sqrt{\varepsilon}\ge 0.31$) and 50 the strict one ($\ge 0.71$). The strict disks are remarkably quiet: 48% have had no significant merger ($f_i\ge 1:10$) since $z=1$, and the mergers that do occur are almost always gas-rich, whether minor or major. When supermassive disks are selected at $z=0.5$ and followed to $z=0$, between 58% and 63% survive as disks, depending on threshold; most of the rest transform into spheroids without merging, and only 7–14% merge into a more massive galaxy. The paper concludes that the number of mergers determines morphology and kinematical support at any stellar mass, and that AGN feedback, while regulating star formation, does not directly reshape disks into spheroids.
Load-bearing premise
The merger histories come from the simulation's bookkeeping of which galaxies are bound together; a merger is recorded only at the last moment when two galaxies can still be recognized as independent objects, and if that recognition fails for large satellites or in dense clusters, the quiet histories it finds would be artifacts.
Editorial extensions
If this is right
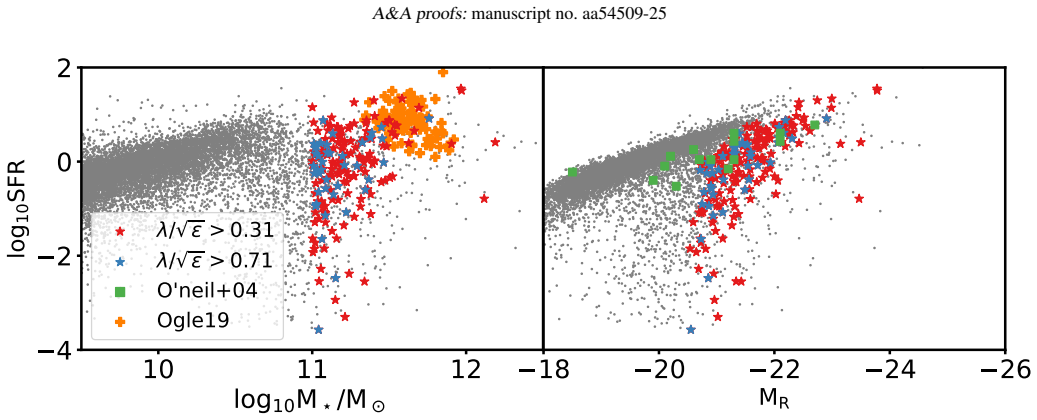
- The observed scarcity of supermassive disks (fewer than 200 known) may be partly a selection effect: the simulated population spans the full range of star formation rates, and flux-limited surveys miss the quiescent and low-surface-brightness members.
- Because roughly 60% of supermassive disks selected at $z=0.5$ survive to $z=0$, upcoming wide surveys such as LSST and Euclid should find that these objects are not transitional phases but a persistent population.
- The finding that one gas-rich merger can spin a spheroid into a disk means galaxy morphology at the high-mass end is regulated by merger count and gas content, not by stellar mass alone.
- Supermassive disks can be found from isolation to clusters, so surveys targeting only low-density environments would miss roughly a quarter of the population that resides in massive groups and clusters.
Reading between the lines
- A stricter definition of gas-rich than the paper's $f_{\rm gas}>0.1$ would likely reduce the fraction of disk mergers counted as wet, so the claim that disks accrete almost only gas-rich satellites is partly a definitional result.
- The paper's disk fraction drops smoothly with stellar mass (Figure 2), so 'supermassive disk' is a selected tail of a continuum, not a distinct class; the formation mechanisms it isolates may apply to less extreme disks too.
- A direct test of the merger-count rule would be to artificially suppress mergers in a simulation while holding feedback fixed; if disks then survive even in massive haloes, the merger-count claim would be confirmed as causal rather than correlational.
- Because the statistics at the strict threshold rest on 50 galaxies, the reported 48% quiescent fraction carries a wide binomial uncertainty; a larger-volume run such as TNG300 could tighten it.
Editorial analysis
A structured set of objections, weighed in public.
Referee Report
Summary. The manuscript uses IllustrisTNG-100 to identify supermassive disk galaxies (M* > 10^11 Msun, λ/√ε ≥ 0.31 or 0.71) and compares them with mass-matched spheroidal control samples. It analyzes their colors, merger histories since z=1, AGN feedback histories, host environments, and the evolution of disks selected at z=0.5 down to z=0. The central claims are that supermassive disks have quiescent and gas-rich merger histories, that 48% of the strict-threshold disks experience no significant merger since z=1, that about 60% of disks selected at z=0.5 survive to z=0, and that 'the number of mergers defines galaxies' morphology and/or kinematical support at any stellar mass.'
Significance. If the merger-quiescence and longevity results are robust, the paper provides a useful simulation-based counterpart to observational studies of superluminous spirals and massive low-surface-brightness disks. The analysis is reproducible from public TNG data, and the use of two kinematic thresholds, a mass-matched control sample, and visual verification of disk morphologies are genuine strengths. However, the headline statistics rest on small samples (N=50 and N=26 for the strict threshold) and, more importantly, on an ambiguous definition of the merger mass ratio in Section 3.3, so the evidence is currently suggestive rather than definitive. With the ambiguity resolved, sensitivity tests added, and uncertainties reported, the paper would be a solid contribution.
major comments (5)
- [Sec. 3.3, Eq. (8)] The definition of f_i is internally inconsistent. The text first says the parameter uses 'the stellar mass ratio of galaxies at the time of the merger,' but the equation and following sentence define f_i as 'the ratio between the maximum stellar mass reached by the two merging galaxies.' These two definitions differ when a satellite is tidally stripped before subfind ceases to recognize it, which is precisely the regime relevant to the significance threshold f_i > 0.1. Because the headline 48% quiescent fraction and the gas-rich merger fractions are computed from this threshold, the authors must state which definition is actually used and test the sensitivity of the 48% statistic to the alternative reading. The same ambiguity affects the gas-rich ratio f_gas in the same section, described both as a maximum and as evaluated 'at their merging time.' This is not a cosmetic point; it changes which mergers are counted as significant.
- [Abstract; Sec. 4.4] The abstract reports that '48% experiencing no significant mergers at z≤1' without specifying that this number is specific to the stricter λ/√ε=0.71 selection. Section 4.4 derives it from 24 of 50 galaxies in that subsample, while the λ/√ε=0.31 sample yields a lower quiescent fraction (Section 3.3 only quotes 'more than 30%'). The reader cannot tell from the abstract whether 48% is a population statement or a threshold-specific one. Please qualify the statement and give a binomial uncertainty; for N=50 the 1σ error on a 48% fraction is about 7 percentage points.
- [Sec. 4.1, Fig. 9] The strict-threshold sample selected at z=0.5 contains only 26 galaxies, and the claim of '~60% survival regardless of threshold' rests on 15/26 (58%) versus 102/164 (63%). The 58% value carries a binomial uncertainty of roughly 10 percentage points, so the two thresholds are statistically indistinguishable and the 'regardless of threshold' claim needs supporting uncertainty estimates. The fractions of disks classified as surviving spheroids and merged spheroids for the N=26 sample are similarly uncertain; raw counts should be accompanied by confidence intervals.
- [Sec. 5] The concluding statement that 'the number of mergers defines galaxies' morphology and/or kinematical support at any stellar mass' is stronger than the evidence presented. The study establishes an association between merger counts and morphology for M*>10^11 galaxies in TNG100, but it does not demonstrate a causal direction, does not control for gas content and environment jointly, and does not cover other stellar masses. I recommend rephrasing to 'is strongly associated with' and restricting the claim to the mass range and simulation studied.
- [Figs. 6 and 7] The cumulative distributions in Figures 6 and 7 are central to the disk-spheroid dichotomy, but they are plotted without error bars or statistical tests. With 50 disks and 250 control spheroids in the strict-threshold case, the apparent separation between the populations should be quantified with, for example, a Kolmogorov-Smirnov test or bootstrap confidence bands before the text states that disks have a 'significantly more quiescent' merger history. This is particularly important because the paper quotes specific percentages directly from these distributions.
minor comments (5)
- [Throughout] The notation is inconsistent: several places write λ/ε instead of λ/√ε (e.g., Sections 4.1 and 4.3, and Figure 13 axes). Please standardize.
- [Fig. 1] The caption is incomplete: 'The dashed line shows the limit log' should specify that the limit is log10 M*/M⊙ = 11.
- [Section 3.3] The quoted quiescent fractions differ across the text: 'more than 30%' in Figure 6, '46%' in Section 3.3, and '48%' in Section 4.4. Please reconcile these numbers and state exactly which merger criterion and redshift range each refers to.
- [Section 2.1] There is a typo in 'V oronoi tessellation'; it should read 'Voronoi tessellation.'
- [Title page] The received date 'September 15, 1996' is clearly incorrect and should be updated to the actual submission date.
Circularity Check
No significant circularity; the central derivation is self-contained and benchmarks against external data.
full rationale
The paper's central claims—that supermassive disks have quiescent merger histories, that ~48% experience no significant merger since z=1, and that ~60% of disks selected at z=0.5 survive to z=0—are derived from quantities measured independently of the disk definition. The kinematic thresholds (lambda/sqrt(eps)=0.31 and 0.71) are adopted from Emsellem et al. (2011), an external reference, not fitted to the conclusions, and the stellar-mass cut at log10 M*>11 is presented as a description of an observed drop in disk fraction (Figure 2) rather than as a fitted parameter. Merger histories come from IllustrisTNG subhalo merger trees (Section 3.3) and are combined with the disk classification only afterward, so the reported merger statistics are not forced by construction. The longevity analysis at z=0.5 restates the same kinematic threshold at two epochs, but this is a measurement of survival under a fixed definition, not a circular derivation. The paper also benchmarks against external observational samples (Ogle et al. 2019; O'Neil et al. 2004) and against an independent simulation study (Jackson et al. 2020). The only overlapping-author citation identified is Rosas-Guevara et al. (2019), which includes author P. B. Tissera, but it supports a peripheral statement about AGN thermal feedback affecting star formation rather than a load-bearing step in the morphology or merger argument. The noted inconsistency in the definition of f_i ('at the time of the merger' vs. 'maximum stellar mass reached') is a potential correctness or robustness issue, not a circularity, because both readings trace to simulation data independent of the classification. Overall, the derivation chain does not reduce any prediction to its own inputs.
Assumptions & free parameters
free parameters (4)
- Kinematic threshold lambda/sqrt(eps) =
0.31 and 0.71
- Stellar mass threshold =
log10 M*/Msun > 11
- Gas-rich merger ratio threshold =
fgas > 0.1
- Significant merger ratio threshold =
mass ratio > 1:10
assumptions (4)
- domain assumption IllustrisTNG-100's subgrid models (star formation, feedback, AGN) produce realistic massive galaxy populations.
- domain assumption The morpho-kinematic parameter lambda_R measured within three stellar half-mass radii (Lagos et al. 2017) correctly classifies simulated massive galaxies.
- domain assumption The merger tree definitions and subfind-based merger times are reliable.
- standard math Standard definitions of galactic kinematics (specific angular momentum, velocity dispersion, ellipticity) as in Lagos et al. (2017).
Cite this review
Pith. "Pith review of The formation and evolution of Supermassive disks in IllustrisTNG." pith.science (2026). https://pith.science/paper/VNPWIAPK
@misc{pith2026250700141,
  author       = {Pith},
  title        = {Pith review of: The formation and evolution of Supermassive disks in IllustrisTNG},
  year         = {2026},
  howpublished = {\url{https://pith.science/paper/VNPWIAPK}},
  note         = {Machine review of arXiv:2507.00141}
}
abstract
Supermassive disks are outstanding galaxies whose formation and evolution are still poorly understood. They comprise a large variety of objects, ranging from large, low-surface-brightness galaxies, such as Malin 1, to the most spectacular superluminous spirals. However, we still do not know the physical mechanisms behind its formation, and whether they will be long-lived objects or whether their mass could destroy them in time. We aim to investigate the formation and evolution of these galaxies using the magnetohydrodynamical state-of-the-art simulation IllustrisTNG-100. We defined supermassive disks as galaxies with $\lambda / \sqrt{\varepsilon} \geq 0.31$ or 0.71, and with stellar mass log$_{10}M_\star/M_\odot > 10^{11}$. We studied the color, merging history, AGN history, and environment in which these galaxies reside. Supermassive disk galaxies typically experience a quiescent merging history, with $48\%$ experiencing no significant mergers at $z \leq 1$. Their stellar mass growth is driven mainly by star formation, unlike spheroidal galaxies, which require a significant number of mergers to form. Moreover, the mergers experienced by disk galaxies are generally rich in gas content, irrespective of whether they are minor or major events. Supermassive disks exist across various environments, from isolation to clusters, with $\sim 60\%$ inhabiting in isolation or low-mass groups, $\sim 25\%$ residing in massive groups, and $\sim15\%$ residing within galaxy clusters. When studying the evolution of supermassive disks selected at $z=0.5$, we show that when they gain sufficient mass, the probability of them maintaining their disk-like structure up to $z=0$ is relatively high ($\sim 60\%$). Lastly, while AGN significantly influences the regulation of star formation in galaxies, it does not directly alter their morphological structure.
Figures

Figures from the paper (9 more)




Forward citations
Cited by 1 Pith paper
-
Characterizing the Formation and Evolution of S0-galaxies (CaFES-0): Their formation pathways around Galaxy Clusters
Hydrangea simulations show over 85% of S0 galaxies are cluster satellites formed primarily by environmental stripping of spirals rather than mergers.
Reference graph
Works this paper leans on
-
[1]
N., Adelman-McCarthy, J
Abazajian, K. N., Adelman-McCarthy, J. K., Agüeros, M. A., et al. 2009, ApJS, 182, 543
2009
-
[2]
2011, ApJS, 193, 29
Aihara, H., Allende Prieto, C., An, D., et al. 2011, ApJS, 193, 29
2011
-
[3]
Barnes, J. E. 1992, ApJ, 393, 484
work page 1992
-
[4]
Bernardi, M., Sheth, R. K., Annis, J., et al. 2003, AJ, 125, 1817
work page 2003
-
[5]
Blanton, M. R. & Moustakas, J. 2009, ARA&A, 47, 159
2009
- [6]
-
[7]
2011, PASA, 28, 128
Cameron, E. 2011, PASA, 28, 128
2011
-
[8]
2016, ARA&A, 54, 597
Cappellari, M. 2016, ARA&A, 54, 597
2016
Show all 61 references
-
[9]
A., Warnick, K., & Knebe, A
Cattaneo, A., Mamon, G. A., Warnick, K., & Knebe, A. 2011, A&A, 533, A5
2011
-
[10]
2003, PASP, 115, 763
Chabrier, G. 2003, PASP, 115, 763
2003
-
[11]
Choi, Y .-Y ., Han, D.-H., & Kim, S.-S. S. 2010, Journal of Korean Astronomical Society, 43, 191
2010
-
[12]
E., & White, M
Conroy, C., Gunn, J. E., & White, M. 2009, ApJ, 699, 486
2009
-
[13]
J., Bluck, A
Conselice, C. J., Bluck, A. F. L., Mortlock, A., Palamara, D., & Benson, A. J. 2014, MNRAS, 444, 1125 de Lapparent, V ., Baillard, A., & Bertin, E. 2011, A&A, 532, A75
2014
-
[14]
2009, MNRAS, 399, 497
Dolag, K., Borgani, S., Murante, G., & Springel, V . 2009, MNRAS, 399, 497
2009
-
[15]
2013, MNRAS, 433, 3297
Dubois, Y ., Gavazzi, R., Peirani, S., & Silk, J. 2013, MNRAS, 433, 3297
2013
-
[16]
2011, MNRAS, 414, 888
Emsellem, E., Cappellari, M., Krajnovi´c, D., et al. 2011, MNRAS, 414, 888
2011
-
[17]
2007, MNRAS, 379, 401
Emsellem, E., Cappellari, M., Krajnovi´c, D., et al. 2007, MNRAS, 379, 401
2007
-
[18]
M., Willmer, C
Faber, S. M., Willmer, C. N. A., Wolf, C., et al. 2007, ApJ, 665, 265
2007
-
[19]
Fabian, A. C. 2012, ARA&A, 50, 455
2012
-
[20]
Fragkoudi, F., Grand, R. J. J., Pakmor, R., et al. 2020, MNRAS, 494, 5936
2020
-
[21]
2018, MNRAS, 474, 3976
Genel, S., Nelson, D., Pillepich, A., et al. 2018, MNRAS, 474, 3976
2018
-
[22]
2014, MNRAS, 445, 175 Gómez, P
Genel, S., V ogelsberger, M., Springel, V ., et al. 2014, MNRAS, 445, 175 Gómez, P. L., Nichol, R. C., Miller, C. J., et al. 2003, ApJ, 584, 210
2014
-
[23]
Hubble, E. P. 1926, ApJ, 64, 321 Article number, page 12 of 13 Diego Pallero et al.: The formation and evolution of Supermassive disks in IllustrisTNG Ivezi´c, Ž., Kahn, S. M., Tyson, J. A., et al. 2019, ApJ, 873, 111
1926
-
[24]
A., Kaviraj, S., Martin, G., et al
Jackson, R. A., Kaviraj, S., Martin, G., et al. 2022, MNRAS, 511, 607
2022
-
[25]
A., Martin, G., Kaviraj, S., et al
Jackson, R. A., Martin, G., Kaviraj, S., et al. 2020, MNRAS, 494, 5568
2020
-
[26]
Kauffmann, G., White, S. D. M., Heckman, T. M., et al. 2004, MNRAS, 353, 713
2004
-
[27]
2017, MNRAS, 467, 4739
Kaviraj, S., Laigle, C., Kimm, T., et al. 2017, MNRAS, 467, 4739
2017
-
[28]
M., de Carvalho, R
Kolesnikov, I., Sampaio, V . M., de Carvalho, R. R., & Conselice, C. 2024, arXiv e-prints, arXiv:2412.03778
2024 arXiv
-
[29]
Lagos, C. d. P., Theuns, T., Stevens, A. R. H., et al. 2017, MNRAS, 464, 3850
2017
-
[30]
2011, arXiv e-prints, arXiv:1110.3193
Laureijs, R., Amiaux, J., Arduini, S., et al. 2011, arXiv e-prints, arXiv:1110.3193
2011 arXiv
-
[31]
2018, MNRAS, 480, 5113
Marinacci, F., V ogelsberger, M., Pakmor, R., et al. 2018, MNRAS, 480, 5113
2018
-
[32]
C., Wyder, T
Martin, D. C., Wyder, T. K., Schiminovich, D., et al. 2007, ApJS, 173, 342
2007
-
[33]
Martin, G., Kaviraj, S., Devriendt, J. E. G., Dubois, Y ., & Pichon, C. 2018, MN- RAS, 480, 2266
2018
-
[34]
H., Guo, Y ., Hertzberg, J., et al
McIntosh, D. H., Guo, Y ., Hertzberg, J., et al. 2008, MNRAS, 388, 1537
2008
-
[35]
P., Monachesi, A., Torres-Flores, S., et al
Montaguth, G. P., Monachesi, A., Torres-Flores, S., et al. 2025, A&A, 696, A240
2025
-
[36]
P., Torres-Flores, S., Monachesi, A., et al
Montaguth, G. P., Torres-Flores, S., Monachesi, A., et al. 2023, MNRAS, 524, 5340
2023
-
[37]
Morgan, W. W. & Mayall, N. U. 1957, PASP, 69, 291
1957
-
[38]
2014, MNRAS, 444, 3357
Naab, T., Oser, L., Emsellem, E., et al. 2014, MNRAS, 444, 3357
2014
-
[39]
P., Pillepich, A., Springel, V ., et al
Naiman, J. P., Pillepich, A., Springel, V ., et al. 2018, MNRAS, 477, 1206
2018
-
[40]
2015, Astronomy and Computing, 13, 12
Nelson, D., Pillepich, A., Genel, S., et al. 2015, Astronomy and Computing, 13, 12
2015
-
[41]
2018, MNRAS, 475, 624
Nelson, D., Pillepich, A., Springel, V ., et al. 2018, MNRAS, 475, 624
2018
-
[42]
M., Lanz, L., Appleton, P
Ogle, P. M., Lanz, L., Appleton, P. N., Helou, G., & Mazzarella, J. 2019, ApJS, 243, 14 O’Neil, K., Bothun, G., van Driel, W., & Monnier Ragaigne, D. 2004, A&A, 428, 823
2019
-
[43]
2011, MNRAS, 418, 1392
Pakmor, R., Bauer, A., & Springel, V . 2011, MNRAS, 418, 1392
2011
-
[44]
A., Padilla, N
Pallero, D., Gómez, F. A., Padilla, N. D., et al. 2022, MNRAS, 511, 3210
2022
-
[45]
2009, MNRAS, 397, 748 Pérez-Montaño, L
Perez, J., Tissera, P., & Blaizot, J. 2009, MNRAS, 397, 748 Pérez-Montaño, L. E. & Cervantes Sodi, B. 2019, MNRAS, 490, 3772 Pérez-Montaño, L. E., Cervantes Sodi, B., Rodriguez-Gomez, V ., Zhu, Q., &
2009
-
[46]
2024, MNRAS, 533, 93 Pérez-Montaño, L
Ogiya, G. 2024, MNRAS, 533, 93 Pérez-Montaño, L. E., Rodriguez-Gomez, V ., Cervantes Sodi, B., et al. 2022, MNRAS, 514, 5840
2024
-
[47]
2018b, MNRAS, 473, 4077 Planck Collaboration, Ade, P
Pillepich, A., Springel, V ., Nelson, D., et al. 2018b, MNRAS, 473, 4077 Planck Collaboration, Ade, P. A. R., Aghanim, N., et al. 2016, A&A, 594, A13
2016
-
[48]
& de Lapparent, V
Quilley, L. & de Lapparent, V . 2022, A&A, 666, A170
2022
-
[49]
M., Bower, R
Rosas-Guevara, Y . M., Bower, R. G., McAlpine, S., Bonoli, S., & Tissera, P. B. 2019, MNRAS, 483, 2712
2019
-
[50]
K., Martin, D
Schiminovich, D., Wyder, T. K., Martin, D. C., et al. 2007, ApJS, 173, 315
2007
-
[51]
2015, ApJS, 219, 15
Shibuya, T., Ouchi, M., & Harikane, Y . 2015, ApJS, 219, 15
2015
-
[52]
2015, MNRAS, 452, 575
Sijacki, D., V ogelsberger, M., Genel, S., et al. 2015, MNRAS, 452, 575
2015
-
[53]
2010, MNRAS, 401, 791
Springel, V . 2010, MNRAS, 401, 791
2010
-
[54]
2018, MNRAS, 475, 676
Springel, V ., Pakmor, R., Pillepich, A., et al. 2018, MNRAS, 475, 676
2018
-
[55]
Springel, V ., White, S. D. M., Tormen, G., & Kau ffmann, G. 2001, MNRAS, 328, 726
2001
-
[56]
& Toomre, J
Toomre, A. & Toomre, J. 1972, in BAAS, V ol. 4, Bulletin of the American As- tronomical Society, 214
1972
-
[57]
2018, MNRAS, 477, L16 V ogelsberger, M., Genel, S., Springel, V ., et al
Torrey, P., V ogelsberger, M., Hernquist, L., et al. 2018, MNRAS, 477, L16 V ogelsberger, M., Genel, S., Springel, V ., et al. 2014a, Nature, 509, 177 V ogelsberger, M., Genel, S., Springel, V ., et al. 2014b, MNRAS, 444, 1518 V ogelsberger, M., Marinacci, F., Torrey, P., et a...
2018
-
[58]
White, S. D. M. & Rees, M. J. 1978, MNRAS, 183, 341
1978
-
[59]
M., van der Wel, A., et al
Wuyts, S., Förster Schreiber, N. M., van der Wel, A., et al. 2011, ApJ, 742, 96
2011
-
[60]
K., Martin, D
Wyder, T. K., Martin, D. C., Schiminovich, D., et al. 2007, ApJS, 173, 293
2007
-
[61]
E., Rodriguez-Gomez, V ., et al
Zhu, Q., Pérez-Montaño, L. E., Rodriguez-Gomez, V ., et al. 2023, MNRAS, 523, 3991 Article number, page 13 of 13
2023
Reviewed August 6, 2026 · model on record in the stance chip above.
Discussion (0). Sign in to comment.