REVIEW 2 major objections 2 minor 72 references
Tracing the Star Formation History of the Universe through Thermal Free-Free Emission with the SKA
T0 review · 2 major / 2 minor · reviewed 2026-06-25 · grok-4.3
Pith's one-line read SKA multi-band surveys can recover thermal star formation rates in 15000 galaxies out to redshift 7 with 0.1 dex precision.
desk verdict Forecasts 15k galaxy detections and 0.1 dex thermal SFR precision with a specific SKA-Mid multi-band setup, but the numbers rest entirely on T-RECS matching real high-z radio properties. read the letter →
The pith
A machine-rendered reading of the paper's core claim, the machinery that carries it, and where it could break.
The reading
What carries the argument
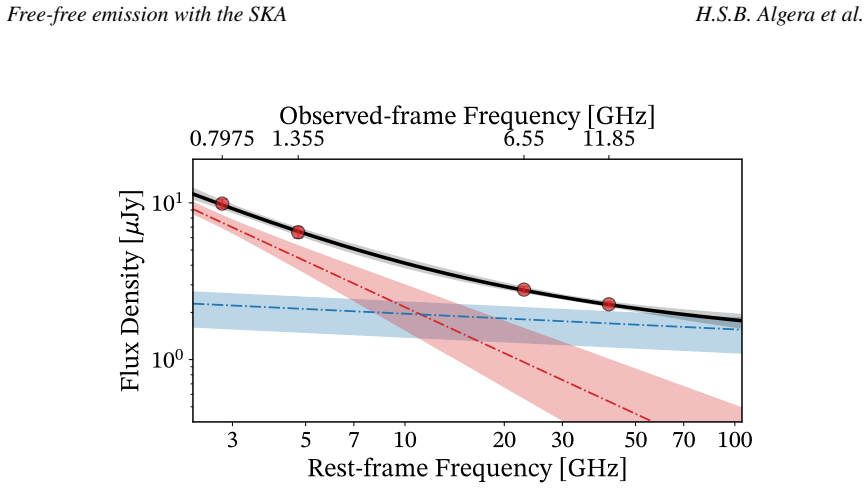
Multi-frequency fitting of the radio spectrum to isolate the thermal free-free emission component from the synchrotron emission.
What would settle it
Actual observations from the SKA survey revealing a significantly different number of detected galaxies or larger uncertainties in the recovered thermal star formation rates than predicted.
Extended reading notes
Core claim
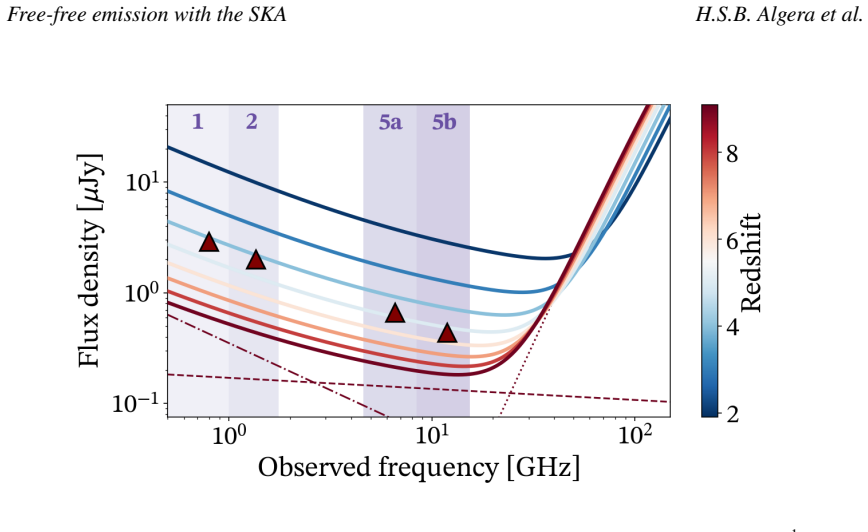
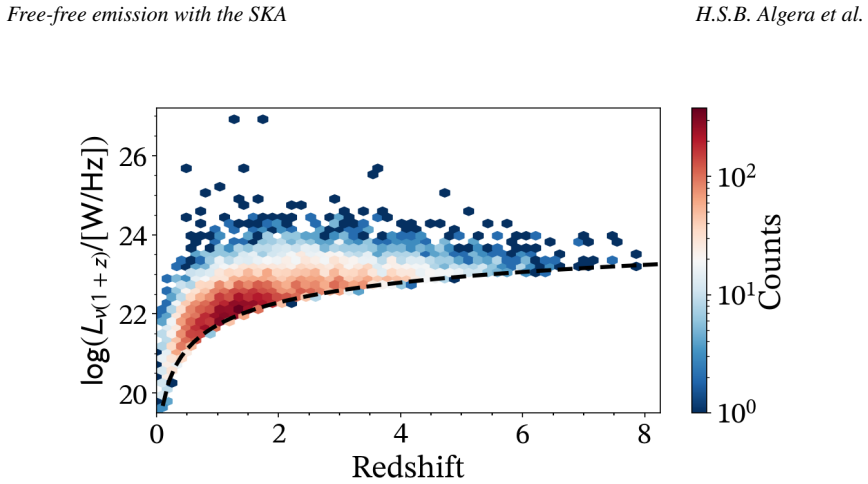
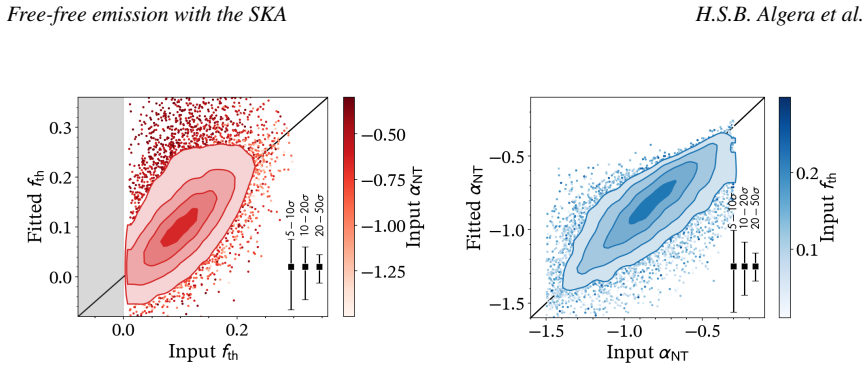
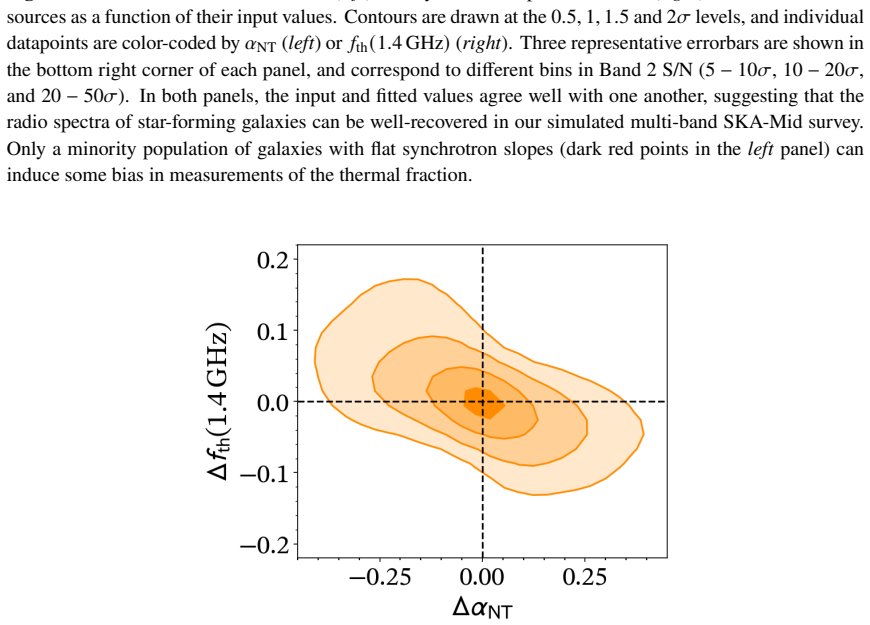
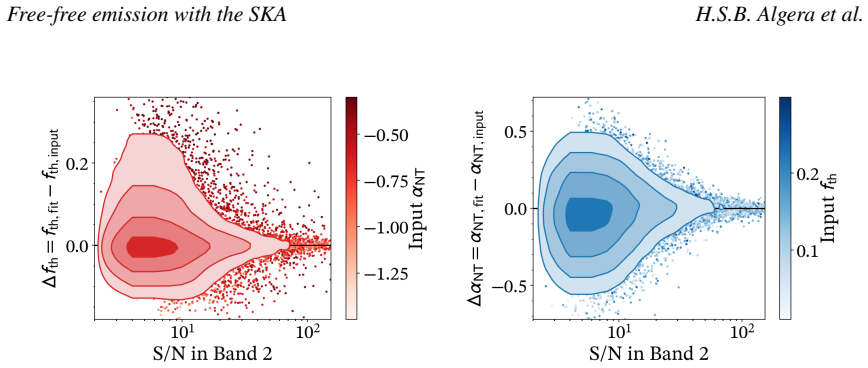
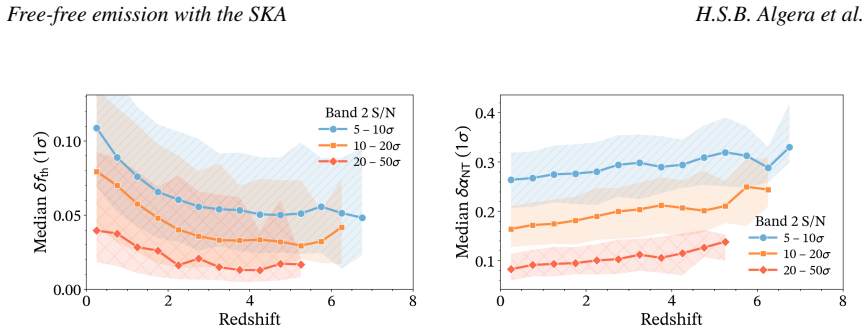
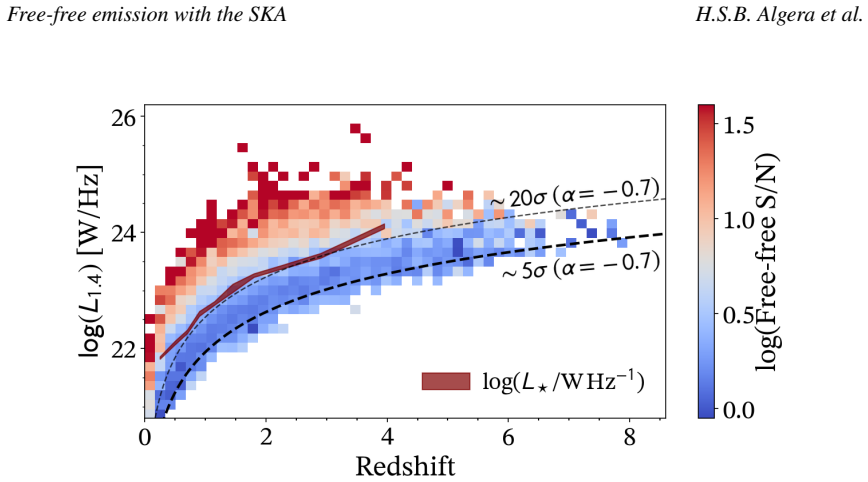
Using simulations of the faint radio sky, an ambitious matched-depth multi-band SKA-Mid survey covering 0.25 square degrees from 0.35 to 15.4 GHz is predicted to detect about 15000 star-forming galaxies in all bands out to redshift 7. Established fitting techniques applied to the data show that thermal fractions and synchrotron spectral indices can be constrained without bias, with uncertainties on the thermal star formation rates of 0.1 dex or less for galaxies at the knee of the radio luminosity function. This allows the inferred distribution of thermal fractions to be combined with wider low-frequency luminosity function measurements to obtain robust constraints on the cosmic star formati
Load-bearing premise
Simulations of the radio properties of star-forming galaxies at redshifts up to 7 accurately capture the real thermal free-free emission and synchrotron characteristics.
Editorial extensions
If this is right
- Uncertainties on thermal star formation rates remain below 0.1 dex for galaxies at the knee of the luminosity function at all redshifts.
- The thermal fraction distribution from the survey enables robust cosmic star formation rate density constraints when combined with low-frequency luminosity functions.
- Approximately 15000 star-forming galaxies are detectable across all bands out to redshift 7.
- Thermal fractions and synchrotron spectral indices can be recovered in an unbiased manner from the multi-band data.
Reading between the lines
- This method supplies a dust-unbiased measure of star formation that can test results from other wavelengths.
- The precision achieved may help clarify the evolution of star formation activity in the early universe.
- Applying similar fitting to future deeper surveys could extend the constraints beyond redshift 7.
Editorial analysis
A structured set of objections, weighed in public.
Referee Report
Summary. The paper forecasts the performance of a matched-depth multi-band AA4 SKA-Mid survey (Bands 1–5b over 0.25 deg², 0.35–15.4 GHz) using the T-RECS simulation suite. It predicts detection of ∼1.5×10^4 star-forming galaxies out to z≈7, unbiased recovery of thermal fractions f_th and synchrotron indices via established fitting, thermal SFR uncertainties ≲0.1 dex at the knee of the radio luminosity function, and, after convolution with low-frequency luminosity functions, robust constraints on the cosmic SFR density to z∼7.
Significance. If the underlying simulation inputs are reliable, the work supplies a concrete, quantitative forecast for how SKA-Mid multi-band data can separate thermal free-free emission and thereby improve measurements of the high-redshift star-formation history; the statistical sample size and quoted precision would be a useful planning benchmark for SKA early science.
major comments (2)
- [Methods (T-RECS and mock survey)] Methods section on T-RECS application and mock survey construction: the central predictions (detection numbers, ≲0.1 dex thermal SFR uncertainties, and subsequent SFRD constraints) are obtained by injecting T-RECS galaxies as both mock data and ground truth. No external high-z observational anchor (ALMA 100 GHz stacks, JVLA 30 GHz data, or similar) is cited to validate the joint distribution of thermal free-free luminosity, synchrotron spectral index, or any curvature/free-free absorption at rest-frame frequencies ≳25 GHz for z up to 7. This assumption is load-bearing for translating the simulated fitting results to real observations.
- [Results (uncertainty recovery)] Results section on recovered uncertainties: the quoted ≲0.1 dex thermal SFR precision at the knee is reported for galaxies across redshift, yet the text provides no explicit sensitivity test showing how these uncertainties degrade if the input synchrotron indices or thermal fractions in T-RECS are varied within plausible observational ranges at z>4.
minor comments (2)
- [Methods] The abstract and main text refer to “established fitting techniques” without naming the specific method (e.g., MCMC, least-squares with fixed priors) or providing the functional form used for the multi-band spectral decomposition; this should be stated explicitly for reproducibility.
- [Results] Figure captions and text should clarify whether the reported 1.5×10^4 detections refer to sources detected in all bands simultaneously or to the union across bands; the distinction affects the interpretation of the f_th recovery statistics.
Simulated Author's Rebuttal
We thank the referee for their constructive report and positive assessment of the work's significance for SKA planning. We address each major comment below. We agree that the simulation-based nature of the forecasts requires additional discussion of assumptions and robustness tests, which we will incorporate via partial revisions.
read point-by-point responses
-
Referee: Methods section on T-RECS application and mock survey construction: the central predictions (detection numbers, ≲0.1 dex thermal SFR uncertainties, and subsequent SFRD constraints) are obtained by injecting T-RECS galaxies as both mock data and ground truth. No external high-z observational anchor (ALMA 100 GHz stacks, JVLA 30 GHz data, or similar) is cited to validate the joint distribution of thermal free-free luminosity, synchrotron spectral index, or any curvature/free-free absorption at rest-frame frequencies ≳25 GHz for z up to 7. This assumption is load-bearing for translating the simulated fitting results to real observations.
Authors: We acknowledge that T-RECS provides the joint distributions used for both mock observations and truth, and that direct high-z anchors at rest-frame ≳25 GHz remain limited. T-RECS is calibrated on existing lower-z radio data with extrapolations for high-z evolution; we will add a new subsection in Methods explicitly discussing these assumptions, citing relevant high-z continuum constraints (e.g., JVLA 3 GHz and ALMA 100 GHz stacks where they overlap in frequency), and noting the extrapolation as a limitation of current knowledge rather than a validated input. The multi-band fitting methodology itself is drawn from established lower-z techniques. revision: partial
-
Referee: Results section on recovered uncertainties: the quoted ≲0.1 dex thermal SFR precision at the knee is reported for galaxies across redshift, yet the text provides no explicit sensitivity test showing how these uncertainties degrade if the input synchrotron indices or thermal fractions in T-RECS are varied within plausible observational ranges at z>4.
Authors: We agree an explicit sensitivity test is warranted. In the revised manuscript we will add a new subsection (and associated figure) that perturbs the input synchrotron index and thermal fraction distributions in T-RECS within ranges consistent with existing z>4 radio observations, then re-runs the fitting pipeline to quantify degradation in the recovered thermal SFR uncertainties. This will directly address robustness at z>4. revision: yes
- Direct external observational validation of the T-RECS joint distributions for thermal free-free luminosity and synchrotron properties at z≈7 and rest-frame frequencies ≳25 GHz, as suitable high-frequency, high-redshift data do not yet exist.
Circularity Check
No significant circularity; forecasts from external T-RECS mocks
full rationale
The paper's derivation begins with the external T-RECS simulation suite as input, applies standard multi-band fitting techniques to mock SKA-Mid observations, and reports resulting detection counts and uncertainty estimates as forecasts. No quoted step reduces a claimed prediction to a fitted parameter by construction, nor does any load-bearing premise rely on a self-citation chain whose authors overlap with the present work. The central results remain independent of quantities defined or tuned inside the paper itself.
Assumptions & free parameters
assumptions (1)
- domain assumption The T-RECS simulation suite accurately models the faint radio sky including thermal free-free emission components of star-forming galaxies at z up to 7.
Cite this review
Pith. "Pith review of Tracing the Star Formation History of the Universe through Thermal Free-Free Emission with the SKA." pith.science (2026). https://pith.science/paper/VPKWABMB
@misc{pith2026260625689,
  author       = {Pith},
  title        = {Pith review of: Tracing the Star Formation History of the Universe through Thermal Free-Free Emission with the SKA},
  year         = {2026},
  howpublished = {\url{https://pith.science/paper/VPKWABMB}},
  note         = {Machine review of arXiv:2606.25689}
}
abstract
One of the major scientific aims of the SKA is to trace the history of star formation across cosmic time. High-frequency radio surveys are indispensable in this regard, as these are capable of probing thermal free-free emission (FFE) -- the dominant component of the radio continuum of star-forming galaxies above rest-frame frequencies of $\gtrsim25\,$GHz. FFE is a powerful, direct star-formation rate (SFR) indicator, which robustly traces the number of ionizing photons produced by recently formed massive stars in a nearly dust-unbiased manner. In this chapter, we forecast the ability of the SKA to detect FFE in typical star-forming galaxies in the early Universe. Our starting point is the state-of-the-art T-RECS simulation suite of the faint radio sky, to which we apply an ambitious, matched-depth, multi-band AA4 SKA-Mid survey in Bands 1 through 5b, covering an area of $0.25\,\mathrm{deg}^2$ across $0.35 - 15.4\,\mathrm{GHz}$. We predict that such a survey will detect $\sim1.5\times10^4$ star-forming galaxies in all bands out to $z\approx7$, and perform simulations using established fitting techniques to investigate the accuracy with which their thermal FFE can be recovered. We find that thermal fractions ($f_\mathrm{th}$) and synchrotron spectral indices can be constrained in an unbiased manner, and predict uncertainties on the thermal SFRs of $\lesssim 0.1\,\mathrm{dex}$ for galaxies at the knee of the radio luminosity function across redshift. Convolving the distribution of $f_\mathrm{th}$ inferred from the multi-band SKA-Mid survey with wider luminosity function determinations at low radio frequencies will yield robust constraints on the total cosmic star formation rate density out to $z\sim7$.
Figures
Figures from the paper (5 more)
Reference graph
Works this paper leans on
-
[1]
H. S. B. Algera et al.ApJ, 903(2):138, Nov. 2020a. doi: 10.3847/1538-4357/abb77b. H. S. B. Algera et al.ApJ, 903(2):139, Nov. 2020b. doi: 10.3847/1538-4357/abb77a. H. S. B. Algera et al.ApJ, 912(1):73, May
-
[2]
doi: 10.3847/1538-4357/abe6a5. H. S. B. Algera et al.ApJ, 924(2):76, Jan
-
[3]
doi: 10.3847/1538-4357/ac34f5. H. S. B. Algera et al.MNRAS, 518(4):6142–6157, Feb
-
[4]
doi: 10.1093/mnras/stac3195. F. An et al.MNRAS, 507(2):2643–2658, Oct
-
[5]
2021, MNRAS, 507, 2643, doi: 10.1093/mnras/stab2290
doi: 10.1093/mnras/stab2290. F.X.Anetal. InAdvancingAstrophysicswiththeSKA–II(AASKAII).2026. arXivsearch: Report number AASKAII/FangxiaAn01. E. F. Bell.ApJ, 586(2):794–813, Apr
-
[6]
doi: 10.1086/367829. A. Bonaldi et al.MNRAS, 482(1):2–19, Jan
-
[7]
doi: 10.1093/mnras/sty2603. M. Bonzini et al.MNRAS, 436(4):3759–3771, Dec
-
[8]
15 Free-free emission with the SKA H.S.B
doi: 10.1093/mnras/stt1879. 15 Free-free emission with the SKA H.S.B. Algera et al. R. J. Bouwens et al.ApJ, 803(1):34, Apr
Show all 72 references
-
[9]
A.Bressan,L.Silva,andG.L.Granato.A&A,392:377–391,Sept.2002
doi: 10.1088/0004-637X/803/1/34. A.Bressan,L.Silva,andG.L.Granato.A&A,392:377–391,Sept.2002. doi: 10.1051/0004-6361: 20020960. G. Calistro Rivera et al.MNRAS, 469(3):3468–3488, Aug
2002 doi
-
[10]
doi: 10.1093/mnras/stx1040. C. M. Casey et al.ApJ, 862(1):77, July
-
[11]
doi: 10.3847/1538-4357/aac82d. C. M. Casey et al.ApJ, 954(1):31, Sept
-
[12]
doi: 10.3847/1538-4357/acc2bc. Q. Chen et al.ApJ, 972(2):147, Sept
-
[13]
doi: 10.3847/1538-4357/ad5ceb. M. Cirasuolo et al. In S. K. Ramsay, I. S. McLean, and H. Takami, editors,Ground-based and AirborneInstrumentationforAstronomyV,volume9147ofSocietyofPhoto-OpticalInstrumen- tation Engineers (SPIE) Conference Series, page 91470N, July
-
[14]
doi: 10.1117/12.2056012. R. K. Cochrane et al.MNRAS, 523(4):6082–6102, Aug
-
[15]
doi: 10.1093/mnras/stad1602. J. J. Condon.ARA&A, 30:575–611, Jan
-
[16]
doi: 10.1146/annurev.aa.30.090192.003043. J. J. Condon.PASP, 109:166–172, Feb
-
[17]
doi: 10.1086/133871. J. Conway et al.SKA Memos, SKA Memos:1, Feb
-
[18]
doi: 10.18727/0722-6691/5117. G. De Zotti et al.A&A, 689:A272, Sept
-
[19]
doi: 10.1051/0004-6361/202449313. A. Del Moro et al.A&A, 549:A59, Jan
-
[20]
doi: 10.1051/0004-6361/201219880. J. Delhaize et al.A&A, 602:A4, June
-
[21]
doi: 10.1051/0004-6361/201629430. I. Delvecchio et al.A&A, 602:A3, June
-
[22]
doi: 10.1051/0004-6361/201629367. I. Delvecchio et al.A&A, 647:A123, Mar
-
[23]
Euclid Collaboration et al.A&A, 662:A112, June
doi: 10.1051/0004-6361/202039647. Euclid Collaboration et al.A&A, 662:A112, June
-
[24]
doi: 10.1051/0004-6361/202141938. S. L. Finkelstein et al.ApJL, 946(1):L13, Mar
-
[25]
doi: 10.3847/2041-8213/acade4. D. Foreman-Mackey, D. W. Hogg, D. Lang, and J. Goodman.PASP, 125(925):306, Mar
-
[26]
doi: 10.1086/670067. Y. Fudamoto et al.Nature, 597(7877):489–492, Sept
-
[27]
doi: 10.1038/s41586-021-03846-z. T. J. Galvin et al.MNRAS, 474(1):779–799, Feb
-
[28]
doi: 10.1093/mnras/stx2613. M. Giavalisco et al.ApJL, 600(2):L93–L98, Jan
-
[29]
doi: 10.1086/379232. J. Glenn et al.Journal of Astronomical Telescopes, Instruments, and Systems, 11:031628, July
-
[30]
doi: 10.1117/1.JATIS.11.3.031628. C. Gruppioni et al.A&A, 643:A8, Nov
-
[31]
doi: 10.1051/0004-6361/202038487. T. Hashimoto et al.PASJ, 71(4):71, Aug
-
[32]
doi: 10.1093/pasj/psz049. N. Herrera Ruiz et al.A&A, 607:A132, Nov
-
[33]
doi: 10.1051/0004-6361/201731163. M. T. Huynh et al.MNRAS, 467(1):1222–1230, May
-
[34]
doi: 10.1093/mnras/stx156. H. Inami et al.MNRAS, 515(3):3126–3143, Sept
-
[35]
doi: 10.1093/mnras/stac1779. Y. Isobe et al.ApJ, 956(2):139, Oct
-
[36]
doi: 10.3847/1538-4357/acf376. E. F. Jiménez-Andrade et al.A&A, 625:A114, May
-
[37]
doi: 10.1051/0004-6361/201935178. E. F. Jiménez-Andrade et al.ApJ, 972(1):89, Sept
-
[38]
doi: 10.3847/1538-4357/ad5b5c. A. A. Khostovan et al.ApJSS, 282(1):6, Jan
-
[39]
doi: 10.3847/1538-4365/ae1cb9. U. Klein, U. Lisenfeld, and S. Verley.A&A, 611:A55, Mar
-
[40]
A.Lawrenceetal.MNRAS,379(4):1599–1617,Aug.2007
doi: 10.1051/0004-6361/ 201731673. A.Lawrenceetal.MNRAS,379(4):1599–1617,Aug.2007. doi: 10.1111/j.1365-2966.2007.12040. x. S. K. Leslie et al.ApJ, 899(1):58, Aug
2007 doi
-
[41]
16 Free-free emission with the SKA H.S.B
doi: 10.3847/1538-4357/aba044. 16 Free-free emission with the SKA H.S.B. Algera et al. S. T. Linden et al.ApJSS, 248(2):25, June
-
[42]
doi: 10.3847/1538-4365/ab8a4d. J. Lyu, S. Alberts, G. H. Rieke, and W. Rujopakarn.ApJ, 941(2):191, Dec
-
[43]
doi: 10.1146/ annurev-astro-081811-125615. V. Mainieri et al.arXiv e-prints, art. arXiv:2403.05398, Mar
-
[44]
doi: 10.48550/arXiv.2403. 05398. R. J. McLure et al.MNRAS, 432(4):2696–2716, July
-
[45]
doi: 10.1093/mnras/stt627. O. Miettinen et al.A&A, 602:A54, June
-
[46]
doi: 10.1051/0004-6361/201730443. J. Moldon et al. InAdvancing Astrophysics with the SKA – II (AASKAII)
-
[47]
doi: 10.1093/mnras/stab746. L. K. Morabito et al.MNRAS, 536(1):L32–L37, Jan
-
[48]
doi: 10.1093/mnrasl/slae104. E. J. Murphy.ApJ, 706(1):482–496, Nov
-
[49]
doi: 10.1088/0004-637X/706/1/482. E. J. Murphy et al.ApJL, 709(2):L108–L113, Feb
-
[50]
doi: 10.1088/2041-8205/709/2/L108. E. J. Murphy et al.ApJ, 737(2):67, Aug
-
[51]
doi: 10.1088/0004-637X/737/2/67. E. J. Murphy et al.ApJ, 839(1):35, Apr
-
[52]
doi: 10.3847/1538-4357/aa62fd. E. J. Murphy et al.ApJ, 862(1):20, July
-
[53]
doi: 10.3847/1538-4357/aac5f5. S. Niklas, U. Klein, and R. Wielebinski.A&A, 322:19–28, June
-
[54]
doi: 10.1051/0004-6361/201629436. P. A. Oesch et al.ApJ, 855(2):105, Mar
-
[55]
doi: 10.3847/1538-4357/aab03f. P. Padovani et al.ApJ, 740(1):20, Oct
-
[56]
G.Pelusoetal.arXive-prints,art.arXiv:2509.17536,Sept.2025.doi: 10.48550/arXiv.2509.17536
doi: 10.1088/0004-637X/740/1/20. G.Pelusoetal.arXive-prints,art.arXiv:2509.17536,Sept.2025.doi: 10.48550/arXiv.2509.17536. I. Prandoni and N. Seymour. InAdvancing Astrophysics with the Square Kilometre Array (AASKA14), page 67, Apr
2025 doi
-
[57]
doi: 10.22323/1.215.0067. I. Prandoni et al. InAdvancing Astrophysics with the SKA – II (AASKAII)
-
[58]
doi: 10.1051/0004-6361/201833399. J. F. Radcliffe et al.A&A, 649:L9, May
-
[59]
doi: 10.1051/0004-6361/202140791. M. T. Sargent et al.ApJSS, 186(2):341–377, Feb. 2010a. doi: 10.1088/0067-0049/186/2/341. M. T. Sargent et al.ApJL, 714(2):L190–L195, May 2010b. doi: 10.1088/2041-8205/714/2/L190. D.R.G.SchleicherandR.Beck.A&A,556:A142,Aug.2013.doi: 10.1051/000...
-
[60]
doi: 10.3847/1538-4357/ad9d0e. F. Tabatabaei et al.ApJ, 989(1):44, Aug
-
[61]
doi: 10.3847/1538-4357/ade233. F. S. Tabatabaei et al.ApJ, 836(2):185, Feb
-
[62]
doi: 10.3847/1538-4357/836/2/185. N. Tamura et al. In C. J. Evans, L. Simard, and H. Takami, editors,Ground-based and Airborne Instrumentation for Astronomy VI, volume 9908 ofSociety of Photo-Optical Instrumentation Engineers (SPIE) Conference Series, page 99081M, Aug
-
[63]
doi: 10.1117/12.2232103. A. P. Thomson et al.MNRAS, 425(3):2203–2211, Sept
-
[64]
17 Free-free emission with the SKA H.S.B
doi: 10.1111/j.1365-2966.2012. 17 Free-free emission with the SKA H.S.B. Algera et al. 21584.x. A. P. Thomson et al.ApJ, 883(2):204, Oct
2012 doi
-
[65]
doi: 10.3847/1538-4357/ab32e7. K. Tisanić et al.A&A, 621:A139, Jan
-
[66]
doi: 10.1051/0004-6361/201834002. D. van der Vlugt et al.ApJ, 941(1):10, Dec
-
[67]
doi: 10.3847/1538-4357/ac99db. A. van der Wel et al.ApJ, 788(1):28, June
-
[68]
doi: 10.1088/0004-637X/788/1/28. I. H. Whittam et al.MNRAS, 543(1):507–517, Oct
-
[69]
doi: 10.1093/mnras/staf1505. I. Yoon.ApJ, 975(1):15, Nov
-
[70]
M.S.Yun,N.A.Reddy,andJ.J.Condon.ApJ,554(2):803–822,June2001
doi: 10.3847/1538-4357/ad7385. M.S.Yun,N.A.Reddy,andJ.J.Condon.ApJ,554(2):803–822,June2001. doi: 10.1086/323145. J. A. Zavala et al.ApJ, 909(2):165, Mar
-
[71]
doi: 10.3847/1538-4357/abdb27. J. A. Zavala et al.ApJL, 998(2):L36, Feb
-
[72]
doi: 10.3847/2041-8213/ae382a. 18
Reviewed June 25, 2026 · model on record in the stance chip above.
Discussion (0). Continue with ORCID to comment.