REVIEW 4 major objections 5 minor 83 references
Stellar evolution along the AGB as revealed by the shape of Miras' visual light curves
T0 review · 4 major / 5 minor · reviewed 2026-08-12 · deepseek-v4-flash
Pith's one-line read The shape of a Mira's light curve reveals how far it has climbed the asymptotic giant branch.
desk verdict Solid empirical mapping of Mira light-curve shapes with new quantitative parameters, but the abstract oversells the evolutionary hump-climbing claim; the body is more careful and the descriptive correlations hold up. read the letter →
The pith
A machine-rendered reading of the paper's core claim, the machinery that carries it, and where it could break.
The reading
What carries the argument
The central object is the hump on the ascending branch of the normalised oscillation profile: each cycle is rescaled from maximum to maximum into phase bins, the mean profile is fitted with a sixth-degree polynomial, and the hump is located as the interval giving the best straight-line fit, with a normalised height $y_{\rm hump}$ measured from minimum to maximum. The paper also uses a single-parameter family of polynomials, $\eta = \mathrm{Sgn}\times \tfrac{1}{2}\xi(\xi^2-3)+\lambda[1-\xi^2(2-\xi^2)]$, to characterise each branch; the fit quality $p$ and the parameter $\lambda$ separate hump-free from humpy curves. A third device, the KMB index, places each star relative to the separator $K-[22]\sim 0.011(P-125)$ in the dust-colour versus period plane, linking curve shape to the dust mass-loss rate and to the presence of third dredge-up.
What would settle it
Measure the hump phase simultaneously in the visible and in a near-infrared band for a star with a well-characterised hump: if the hump appears at the same phase at both wavelengths, it is intrinsic to the pulsation; if it moves closer to maximum or disappears in the infrared, dust extinction is creating or displacing the feature and the evolutionary reading fails. A second check is to find a technetium-free M star with a hump high on the ascending branch (say yhump>0.6) and follow it over several cycles; the proposed sequence predicts no such star should exist.
Extended reading notes
Core claim
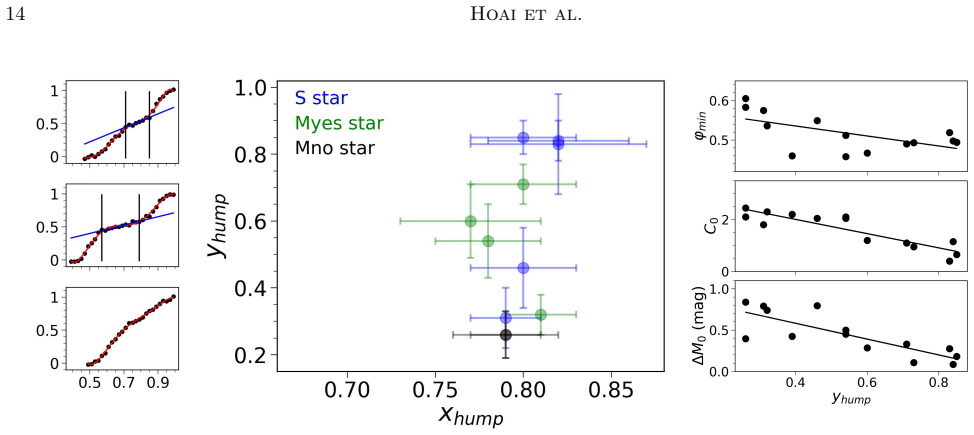
The paper's central claim is that the ascending branch of the Mira light curve carries a record of the star's progress through the thermally pulsing AGB. Stars that have just entered the TP-AGB, still of spectral type M and without technetium, form a family of nearly sinusoidal curves; once third dredge-up begins, the curve develops a slowing-down episode on the lower part of the ascending branch, seen as a broader minimum, and this hump climbs toward maximum light as the star advances through the Myes, S, and C spectral types. The authors measure the hump's normalised height yhump on the ascending branch and show that the phase at minimum, the dust colour index, and the curve's irregularity all decrease as yhump increases, tying the curve shape to the C/O ratio proxy for AGB evolution. They also identify two distinct families within the technetium-free M stars, one regular, symmetric, and short-period and one irregular, asymmetric, and longer-period, and present two scenarios for what the split means, one separating E-AGB from TP-AGB stars and one separating low-mass stars that will never become carbon-rich from higher-mass stars that will.
Load-bearing premise
The paper's interpretation rests on the premise that the hump's position on the ascending branch tracks the star's genuine evolutionary state along the AGB, rather than being created or shifted by dust in the star's own atmosphere; the paper itself notes that dust can change the visual light curve dramatically, and it does not model that effect.
Editorial extensions
If this is right
- A hump sitting near minimum light identifies a star that has recently entered the thermally pulsing AGB, while a hump near maximum marks a star approaching or inside the carbon-rich stage.
- The two Mno families give an observational way to separate stars that will soon show technetium and possibly turn into carbon stars from stars that will spend the rest of their AGB life as oxygen-rich, technetium-free Miras.
- Because the hump's slowing-down is compensated by speeding-up elsewhere on the ascending branch, the hump does not change the pulsation period; observed period changes in Miras must be generated by a different mechanism.
- The descending branch being uniformly hump-free across all samples means the physical event causing the hump acts only during the rise to maximum light, constraining future models of AGB pulsation and shock propagation.
- The correlations between regularity, symmetry, and dust colour allow a first estimate of a Mira's relative mass-loss rate directly from the shape of its visual light curve.
Reading between the lines
- If the hump phase is a true evolutionary clock, its scatter within a single spectral type should shrink when the hump phase is compared directly with abundance ratios such as 12C/13C or the technetium line strength for the same star; such a test is a natural next step beyond this paper.
- A decisive way to separate intrinsic pulsation shape from dust extinction is to measure the hump phase simultaneously in the visible and near-infrared for a few stars; a hump that persists at the same phase in the infrared would confirm the evolutionary interpretation, while one that moves or vanishes would point to dust.
- The same normalised-profile analysis could be applied to Miras in external galaxies once sufficient light-curve density exists, turning the hump phase into a distance-independent tracer of the AGB population's mean evolutionary stage.
Editorial analysis
A structured set of objections, weighed in public.
Referee Report
Summary. The paper analyzes visual light curves of Mira variables from the AAVSO database, using a large sample (A, 71 stars) and a high-quality subsample (B, 32 stars) to quantify light-curve shape. It identifies two families among M-type stars without technetium, characterizes a hump on the ascending branch of many Miras, and reports correlations between asymmetry, regularity, and dust-sensitive color indices. The central interpretive claim is that the hump appears near minimum light when a star enters the TP-AGB and progressively climbs the ascending branch as the star evolves through later spectral types (Mno, Myes, S, C). The paper is careful in defining parameters and cross-checking sample A against sample B, but the evolutionary progression is supported mainly by a cross-sectional comparison of 14 stars with substantial overlap between spectral types.
Significance. If the main correlations hold, the paper provides a useful quantitative description of Mira light-curve shapes and reinforces earlier connections between light-curve morphology, dust mass-loss proxies, and chemical/evolutionary state. The parameter definitions are mostly clear, and the use of two samples with a cross-calibration between less and more rigorous parameter extraction is a genuine strength. The claim that the hump position traces AGB evolution is potentially important, but the evidence presented for it is currently weak: the tabulated hump positions do not show a monotonic progression, no significance tests are given, and the most extreme excluded stars could influence the trend. The descriptive correlations and the identification of two Mno families are valuable independently of the speculative evolutionary interpretation.
major comments (4)
- [§7.2 and Table 3] The central claim that the hump 'progressively climbs the ascending branch' as stars evolve from Mno through Myes, S, and C is not supported by the quantitative data in Table 3. The 14 listed yhump values are: Mno 26, 26; Myes 71, 32, 54, 60; S 84, 46, 85, 83, 31; C 54, 39, 73. The median rises from Myes (57) to S (83) but falls to C (54), and the ranges overlap almost completely (Myes 32–71, S 31–85, C 39–73). Section 7.2 itself concedes that 'each spectral type is seen to cover the whole corresponding yhump range rather than clustering at its end.' No significance test, confidence interval, or regression is provided for the claimed progression. The abstract's statement that the trend is established 'with good confidence' therefore overstates what the body of the paper shows. The authors should either provide a quantitative test of monotonic progression (for example, a rank correlation with a continuous evolutionary indicator, with selection effects accounted for) or explicitly reframe the conclusion as a weak average tendency rather than a progressive sequence.
- [§2, Table A1] The selection excludes three Mno stars, X Oph, R Cen, and R Nor, described in §2 as having very broad minima or double-peaked oscillations that cannot be simply compared with the other curves. These are precisely the stars with the most extreme shapes at minimum light, and their exclusion removes cases that are potentially relevant to the hump-near-minimum sequence. Because the central evolutionary interpretation depends on the behavior of the ascending branch near minimum, the paper should justify these exclusions quantitatively or show that the main correlations are robust to their inclusion in some approximate form.
- [§3.2–§3.3, Table 4] The profile-type assignments and the humpy/hump-free classification rely on subjective visual inspection for sample A and on threshold choices (p < 0.1, single-parameter λ fits) for sample B. The text acknowledges that the assignment of profiles was difficult and that S Her, R Cam, and S UMa are classified as humpy despite having p < 0.1 because their humps appear near maximum light. Since the claimed evolutionary sequence is built on these categories and on the hump parameters derived from them, the paper should report the sensitivity of Tables 3 and 4 to alternative thresholds and to independent human classifications, or otherwise demonstrate that the central trend is robust to the subjective choices.
- [§1, §4.5, §7.2] The paper notes in §1 that dust 'dramatically affects the appearance of the visual light curve,' yet it does not model phase-dependent dust extinction. The observation in §4.5 that humps also appear in infrared bandpasses weakens a pure dust-extinction explanation, but it does not eliminate it: the I-band and visual humps are not compared quantitatively, and dust can affect both. To support the evolutionary interpretation, the authors should address more directly whether phase-dependent dust opacity can create or move the hump, for example by comparing phase-resolved color curves or by citing quantitative dust/pulsation models that predict hump phase as a function of mass-loss rate.
minor comments (5)
- [§3.1] The definition of the irregularity parameter contains an index typo: Δ′Mmax=|Mmax,i+i − Mmax,i| should read |Mmax,i+1 − Mmax,i|.
- [Table 4] The sample B column for Myes stars lists eight entries, which apparently includes the three recovered M-type stars assigned to Myes in §4.4; the table caption should state this explicitly to avoid confusion.
- [§3.3] In Figure 3 and the accompanying text, it would help to state explicitly that p is the rms deviation in normalized magnitude units and that λ is dimensionless; the current notation is understandable but the units are not stated.
- [Abstract and §8] The abstract uses 'with good confidence' for the average trend, while §8 emphasizes the 'speculative character' of many interpretations; the wording should be aligned so that the abstract does not promise more certainty than the body claims.
- [§4.3] The compensation factor k is estimated from the same curves used to test the absence of period lengthening; the paper should clarify whether the quoted uncertainty in k includes the covariance with the tested slope, or whether k should be treated as a fitted nuisance parameter in the correlation test.
Circularity Check
No significant circularity: the shape parameters and evolutionary indicators are measured independently; the hump-climbing narrative is an explicitly hedged interpretation, not a derived identity.
full rationale
None of the paper's quantitative results is obtained by fitting a parameter to the quantity it claims to predict. The shape parameters (φmin, ΔM0, A, yhump, profile type) are read or fitted from AAVSO visual light curves, while the evolutionary indicators (spectral type, technetium presence, K−[22], [3.4]−[22], 12C/13C) are inherited from Merchán Benítez et al. (2023) and Uttenthaler et al. (2019); the paper is explicit about this inheritance in Section 2. The only constructed index, KMB = 0.011(P−125) − (K−[22]) in Section 3.1, is built from an externally published separator line, and the two Mno families are not defined by KMB: Section 4.1 defines the first family by α > −15% and then notes the exceptional R Leo with positive KMB and the intermediate T UMa, showing the split is not forced by the index. The hump coordinate yhump is a measured midpoint of a fitted linear hump interval on the normalized ascending branch (Section 4.3); the correlations of yhump with C0, φmin, and ΔM0 are independent cross-correlations, not algebraic identities. The 'hump climbs the ascending branch as the star evolves' narrative is an evolutionary interpretation of a cross-sectional correlation, explicitly hedged in Section 7.2 ('each spectral type is seen to cover the whole corresponding yhump range rather than clustering at its end') and in Section 8 ('One must not underestimate the speculative character of many of the considerations that we have been proposing'). The weakness of the trend visible in Table 3 (Myes yhump 32–71, S 31–85, C 39–73) is a statistical and evidential concern, not circularity. Self-citations (Darriulat et al. 2024; Hoai et al. 2024) appear only as context for atmosphere and dust complexity and do not carry the central result; no self-citation chain or imported uniqueness theorem is used to make the interpretation forced. Therefore no circular step can be identified from the quoted equations or construction.
Assumptions & free parameters
free parameters (3)
- Hump slowdown compensation factor k =
0.88 +/- 0.04
- Mno family separation cuts =
alpha > -15%, P < 300 d, K-[22] < ~2.0
- Threshold p < 0.1 for hump-free classification =
0.1
assumptions (4)
- domain assumption The Merchan Benitez et al. (2023) sample provides trustworthy spectral types, technetium detections, 12C/13C ratios, and K-[22], [3.4]-[22] colors for all stars.
- domain assumption AAVSO visual observations, binned in ~2% period intervals and fit with parabolas, yield unbiased estimates of times and magnitudes of maxima and minima.
- domain assumption Visual light-curve morphology is governed by stellar pulsation rather than by phase-dependent dust extinction.
- ad hoc to paper The chosen polynomial form (eta = Sgn x 1/2 xi(xi^2 - 3) + lambda[1 - xi^2(2 - xi^2)]) is an adequate basis for comparing branch shapes.
Cite this review
Pith. "Pith review of Stellar evolution along the AGB as revealed by the shape of Miras' visual light curves." pith.science (2026). https://pith.science/paper/VT5KYWQB
@misc{pith2026241118044,
  author       = {Pith},
  title        = {Pith review of: Stellar evolution along the AGB as revealed by the shape of Miras' visual light curves},
  year         = {2026},
  howpublished = {\url{https://pith.science/paper/VT5KYWQB}},
  note         = {Machine review of arXiv:2411.18044}
}
read the original abstract
A new analysis of a sample of visual light curves of Mira variables is presented. The curves cover the past four decades and are selected from the AAVSO database as including a very large number of high-density and high-quality observations. The aim of the analysis is to offer a more precise, more quantitative and more systematic picture than available from earlier studies. The results corroborate earlier descriptions and reveal new correlations between the shapes of the light curves and the evolution of the star along the Asymptotic Giant Branch (AGB). A family of nearly sinusoidal curves associated with M spectral types and displaying no sign of having experienced third-dredge-up events, is identified with good confidence. A detailed study of its properties is presented and used to suggest possible interpretations. All other curves are clearly distinct from this family and usually start departing from it by displaying a broader luminosity minimum, progressively taking the form of a hump climbing the ascending branch as the star evolves along the AGB. The properties displayed by this hump are studied in some detail and possible interpretations are considered. New correlations between parameters defining the shape of the light curve and the state of the star are revealed; while the average trend is established with good confidence, deviations from it cause a significant scatter of the parameters defining the shapes of the curves. Comments aimed at shedding light on the underlying physics are presented together with speculative interpretations, in the hope that they could encourage and inspire new studies, in particular based on simulations using state-of-the-art models of the inner star dynamics.
Figures


Figures from the paper (20 more)




Reference graph
Works this paper leans on
-
[1]
2022, A&A, 664, A45, doi: 10.1051/0004-6361/202243595
Abia, C., de Laverny, P., Romero-G´ omez, M., & Figueras, F. 2022, A&A, 664, A45, doi: 10.1051/0004-6361/202243595
-
[2]
Abia, C., & Isern, J. 1997, MNRAS, 289, L11, doi: 10.1093/mnras/289.4.L11 Alonso-Hern´ andez, J., S´ anchez Contreras, C., & Sahai, R. 2024, A&A, 684, A77, doi: 10.1051/0004-6361/202347317
-
[3]
2022, A&A, 659, A193, doi: 10.1051/0004-6361/202142557
Andrassy, R., Higl, J., Mao, H., et al. 2022, A&A, 659, A193, doi: 10.1051/0004-6361/202142557
-
[4]
Andrievsky, S. M., Luck, R. E., & Kovtyukh, V. V. 2005, AJ, 130, 1880, doi: 10.1086/444541
-
[5]
1993, A&A, 279, 125
Antonello, E. 1993, A&A, 279, 125
1993
-
[6]
Asaki, Y., Maud, L. T., Francke, H., et al. 2023, ApJ, 958, 86, doi: 10.3847/1538-4357/acf619
-
[7]
Bono, G., Marconi, M., & Stellingwerf, R. F. 2000, A&A, 360, 245, doi: 10.48550/arXiv.astro-ph/0006229
work page Pith review arXiv doi:10.48550/arxiv.astro-ph/0006229 2000
-
[8]
Bowers, P. F. 1975, A&A, 39, 473
1975
Show all 83 references
-
[9]
F., & Kerr, F
Bowers, P. F., & Kerr, F. J. 1977, A&A, 57, 115
1977
-
[10]
2018, A&A, 617, A23, doi: 10.1051/0004-6361/201832724
Brunner, M., Danilovich, T., Ramstedt, S., et al. 2018, A&A, 617, A23, doi: 10.1051/0004-6361/201832724
2018 doi
-
[11]
2014, A&A, 569, A76, doi: 10.1051/0004-6361/201322807
Danilovich, T., Bergman, P., Justtanont, K., et al. 2014, A&A, 569, A76, doi: 10.1051/0004-6361/201322807
2014 doi
-
[12]
T., Nhung, P
Darriulat, P., Hoai, D. T., Nhung, P. T., et al. 2024, Comptes Rendus. Physique, 25, 219, doi: 10.5802/crphys.185 De Beck, E., & Olofsson, H. 2020, A&A, 642, A20, doi: 10.1051/0004-6361/202038335
2024 doi
-
[13]
Eddington, A. S. 1917, The Observatory, 40, 290
1917
-
[14]
Fernie, J. D. 1959, ApJ, 130, 611, doi: 10.1086/146750
1959 doi
-
[15]
2023, A&A, 669, A155, doi: 10.1051/0004-6361/202244992
Freytag, B., & H¨ ofner, S. 2023, A&A, 669, A155, doi: 10.1051/0004-6361/202244992
2023 doi
-
[16]
1995, A&A, 297, 461 Garc ´ ıa-Hern´ andez, D
Gal, J., & Szatmary, K. 1995, A&A, 297, 461 Garc ´ ıa-Hern´ andez, D. A., Zamora, O., Yag¨ ue, A., et al. 2013, A&A, 555, L3, doi: 10.1051/0004-6361/201321818
1995 doi
-
[17]
S., & Holland, W
Greaves, J. S., & Holland, W. S. 1997, A&A, 327, 342
1997
-
[18]
A., Jackiewicz, J., & Evans, N
Guzik, J. A., Jackiewicz, J., & Evans, N. R. 2023, in 42nd Annual Conference of the Society for Astronomical Sciences (SAS-2023), ed. J. C. Martin, R. K. Buchheim, R. M. Gill, W. Green, & J. Menke, 74–83
2023
-
[19]
A., & Foster, G
Hawkins, G., Mattei, J. A., & Foster, G. 2001, PASP, 113, 501, doi: 10.1086/319542
2001 doi
-
[20]
1926, BAN, 3, 115
Hertzsprung, E. 1926, BAN, 3, 115
1926
-
[21]
2005, ARA&A, 43, 435, doi: 10.1146/annurev.astro.43.072103.150600 28 Hoai et al
Herwig, F. 2005, ARA&A, 43, 435, doi: 10.1146/annurev.astro.43.072103.150600 28 Hoai et al
2005 arXiv
-
[22]
H., Hall, D
Hinkle, K. H., Hall, D. N. B., & Ridgway, S. T. 1982, ApJ, 252, 697, doi: 10.1086/159596
1982 doi
-
[23]
T., Winters, J
Hoai, D. T., Winters, J. M., Nhung, P. T., Darriulat, P., & Le Bertre, T. 2024, A&A, 692, A86, doi: 10.1051/0004-6361/202450983
2024 doi
-
[24]
1997, JAA VSO, 25, 115
Hoffleit, D. 1997, JAA VSO, 25, 115
1997
-
[25]
2021, A&A, 651, A82, doi: 10.1051/0004-6361/202140512
Homan, W., Pimpanuwat, B., Herpin, F., et al. 2021, A&A, 651, A82, doi: 10.1051/0004-6361/202140512
2021 doi
-
[26]
2024, ApJ, 971, 186, doi: 10.3847/1538-4357/ad534a
Joyce, M., Moln´ ar, L., Cinquegrana, G., et al. 2024, ApJ, 971, 186, doi: 10.3847/1538-4357/ad534a
2024 doi
-
[27]
2023, Galaxies, 11, 75, doi: 10.3390/galaxies11030075
Joyce, M., & Tayar, J. 2023, Galaxies, 11, 75, doi: 10.3390/galaxies11030075
2023 doi
-
[28]
L., & Szatm´ ary, K
Kiss, L. L., & Szatm´ ary, K. 2002, A&A, 390, 585, doi: 10.1051/0004-6361:20020744
2002 doi
-
[29]
S., & Rudnitskij, G
Kudashkina, L. S., & Rudnitskij, G. M. 1994, Odessa Astronomical Publications, 7, 66
1994
-
[30]
2009, ApJ, 707, 632, doi: 10.1088/0004-637X/707/1/632 Le Bertre, T
Lacour, S., Thi´ ebaut, E., Perrin, G., et al. 2009, ApJ, 707, 632, doi: 10.1088/0004-637X/707/1/632 Le Bertre, T. 1992, A&AS, 94, 377
2009 doi
-
[31]
Leavitt, H. S. 1907, Annals of Harvard College Observatory, 60, 87
1907
-
[32]
S., & Pickering, E
Leavitt, H. S., & Pickering, E. C. 1912, Harvard College Observatory Circular, 173, 1
1912
-
[33]
2011, Astronomische Nachrichten, 332, 140, doi: 10.1002/asna.201011469
Lebzelter, T. 2011, Astronomische Nachrichten, 332, 140, doi: 10.1002/asna.201011469
2011 doi
-
[34]
H., Straniero, O., et al
Lebzelter, T., Hinkle, K. H., Straniero, O., et al. 2019, ApJ, 886, 117, doi: 10.3847/1538-4357/ab4e9b
2019 doi
-
[35]
2016, A&A, 589, A130, doi: 10.1051/0004-6361/201527885
Liljegren, S., H¨ ofner, S., Nowotny, W., & Eriksson, K. 2016, A&A, 589, A130, doi: 10.1051/0004-6361/201527885
2016 doi
- [36]
-
[37]
Loidl, R., Lan¸ con, A., & Jørgensen, U. G. 2001, A&A, 371, 1065, doi: 10.1051/0004-6361:20010400
2001 doi
-
[38]
1928, Handbuch der Astrophysik, 6, 49
Ludendorff, H. 1928, Handbuch der Astrophysik, 6, 49
1928
-
[39]
2024, MNRAS, 529, 4210, doi: 10.1093/mnras/stae734
Marconi, M., De Somma, G., Molinaro, R., et al. 2024, MNRAS, 529, 4210, doi: 10.1093/mnras/stae734
2024 doi
-
[40]
Marigo, P., Bressan, A., Nanni, A., Girardi, L., & Pumo, M. L. 2013, MNRAS, 434, 488, doi: 10.1093/mnras/stt1034
2013 doi
-
[41]
I., & Andronov, I
Marsakova, V. I., & Andronov, I. L. 2007, Astrophysics, 50, 76, doi: 10.1007/s10511-007-0008-8
2007 doi
-
[42]
2013, A&A, 549, A69, doi: 10.1051/0004-6361/201219259
Mayer, A., Jorissen, A., Kerschbaum, F., et al. 2013, A&A, 549, A69, doi: 10.1051/0004-6361/201219259
2013 doi
-
[43]
A., & Lagadec, E
McDonald, I., De Beck, E., Zijlstra, A. A., & Lagadec, E. 2018, MNRAS, 481, 4984, doi: 10.1093/mnras/sty2607
2018 doi
-
[44]
McDonald, I., & Zijlstra, A. A. 2016, ApJL, 823, L38, doi: 10.3847/2041-8205/823/2/L38
2016 doi
-
[45]
O., Boughaleb, H., & Mattei, J
Mennessier, M. O., Boughaleb, H., & Mattei, J. A. 1997, A&AS, 124, 143, doi: 10.1051/aas:1997184 Merch´ an Ben ´ ıtez, P., & Jurado Vargas, M. 2000, A&A, 353, 264 —. 2002, A&A, 386, 244, doi: 10.1051/0004-6361:20020208 Merch´ an Ben ´ ıtez, P., Uttenthaler, S., & Jurado-Vargas...
1997 doi
-
[46]
1996, A&A, 310, 933
Ohnaka, K., & Tsuji, T. 1996, A&A, 310, 933
1996
-
[47]
Onaka, T., de Jong, T., & Willems, F. J. 1989, A&A, 218, 169
1989
-
[48]
2018, Nature, 553, 310, doi: 10.1038/nature25001
Paladini, C., Baron, F., Jorissen, A., et al. 2018, Nature, 553, 310, doi: 10.1038/nature25001
2018 doi
-
[49]
2020, A&A, 635, A66, doi: 10.1051/0004-6361/201936704
Prudil, Z., D´ ek´ any, I., Smolec, R., et al. 2020, A&A, 635, A66, doi: 10.1051/0004-6361/201936704
2020 doi
-
[50]
Ramstedt, S., Montez, R., Kastner, J., & Vlemmings, W. H. T. 2012, A&A, 543, A147, doi: 10.1051/0004-6361/201118516
2012 doi
-
[51]
2014, A&A, 566, A145, doi: 10.1051/0004-6361/201423721
Ramstedt, S., & Olofsson, H. 2014, A&A, 566, A145, doi: 10.1051/0004-6361/201423721
2014 doi
-
[52]
2017, A&A, 600, A92, doi: 10.1051/0004-6361/201629337
Rau, G., Hron, J., Paladini, C., et al. 2017, A&A, 600, A92, doi: 10.1051/0004-6361/201629337
2017 doi
- [53]
-
[54]
2024, MNRAS, 533, 687, doi: 10.1093/mnras/stae1778
Rizzuti, F., Hirschi, R., Varma, V., et al. 2024, MNRAS, 533, 687, doi: 10.1093/mnras/stae1778
2024 doi
-
[55]
2016, R Cygni, https://www.aavso.org/lpv-month-may-2020-RCyg Rosales-Guzm´ an, A., Sanchez-Bermudez, J., Paladini, C., et al
Roberts, R. 2016, R Cygni, https://www.aavso.org/lpv-month-may-2020-RCyg Rosales-Guzm´ an, A., Sanchez-Bermudez, J., Paladini, C., et al. 2024, A&A, 688, A124, doi: 10.1051/0004-6361/202349112 Sch¨ oier, F. L., & Olofsson, H. 2000, A&A, 359, 586, doi: 10.48550/arXiv.astro-ph/0005360
- [56]
-
[57]
2023, European Physical Journal A, 59, 17, doi: 10.1140/epja/s10050-023-00926-8
Straniero, O., Abia, C., & Dom ´ ınguez, I. 2023, European Physical Journal A, 59, 17, doi: 10.1140/epja/s10050-023-00926-8
2023 doi
-
[58]
R., Mattei, J
Templeton, M. R., Mattei, J. A., & Willson, L. A. 2005, AJ, 130, 776, doi: 10.1086/431740
2005 doi
-
[59]
R., & Willson, L
Templeton, M. R., & Willson, L. A. 2004, in American Astronomical Society Meeting Abstracts, Vol. 205, American Astronomical Society Meeting Abstracts, 54.07 29
2004
-
[60]
R., Montalb´ an, J., et al
Trabucchi, M., Wood, P. R., Montalb´ an, J., et al. 2017, ApJ, 847, 139, doi: 10.3847/1538-4357/aa8998
2017 doi
-
[61]
2016a, Astronomische Nachrichten, 337, 293, doi: 10.1002/asna.201512296
Uttenthaler, S., Greimel, R., & Templeton, M. 2016a, Astronomische Nachrichten, 337, 293, doi: 10.1002/asna.201512296
-
[62]
2010, A&A, 510, A62, doi: 10.1051/0004-6361/200912548
Uttenthaler, S., & Lebzelter, T. 2010, A&A, 510, A62, doi: 10.1051/0004-6361/200912548
2010 doi
- [63]
-
[64]
2019, A&A, 622, A120, doi: 10.1051/0004-6361/201833794
Uttenthaler, S., McDonald, I., Bernhard, K., Cristallo, S., & Gobrecht, D. 2019, A&A, 622, A120, doi: 10.1051/0004-6361/201833794
2019 doi
-
[65]
2016b, A&A, 585, A145, doi: 10.1051/0004-6361/201526619
Uttenthaler, S., Meingast, S., Lebzelter, T., et al. 2016b, A&A, 585, A145, doi: 10.1051/0004-6361/201526619
-
[66]
2011, A&A, 531, A88, doi: 10.1051/0004-6361/201116463
Uttenthaler, S., van Stiphout, K., Voet, K., et al. 2011, A&A, 531, A88, doi: 10.1051/0004-6361/201116463
2011 doi
-
[67]
2024, A&A, 690, A393, doi: 10.1051/0004-6361/202451708 van Belle, G
Uttenthaler, S., Shetye, S., Nanni, A., et al. 2024, A&A, 690, A393, doi: 10.1051/0004-6361/202451708 van Belle, G. T., Dyck, H. M., Benson, J. A., & Lacasse, M. G. 1996, AJ, 112, 2147, doi: 10.1086/118170 van Belle, G. T., Thompson, R. R., & Creech-Eakman, M. J. 2002, AJ, 124...
2024 doi
-
[68]
Vardya, M. S. 1987, A&A, 182, 75 —. 1988, A&AS, 73, 181
1987
-
[69]
S., de Jong, T., & Willems, F
Vardya, M. S., de Jong, T., & Willems, F. J. 1986, ApJL, 304, L29, doi: 10.1086/184664
1986 doi
-
[70]
Walker, W. S. G. 2009, JAA VSO, 37, 87
2009
-
[71]
H., Dominy, J
Wallerstein, G., Hinkle, K. H., Dominy, J. F., et al. 1985, MNRAS, 215, 67, doi: 10.1093/mnras/215.1.67
1985 doi
-
[72]
Whitelock, P. A. 1999, NewAR, 43, 437, doi: 10.1016/S1387-6473(99)00031-7
1999 doi
-
[73]
A., Feast, M
Whitelock, P. A., Feast, M. W., & Van Leeuwen, F. 2008, MNRAS, 386, 313, doi: 10.1111/j.1365-2966.2008.13032.x
2008
-
[74]
M., Fleischer, A
Winters, J. M., Fleischer, A. J., Gauger, A., & Sedlmayr, E. 1994, A&A, 290, 623
1994
-
[75]
R., & Sebo, K
Wood, P. R., & Sebo, K. M. 1996, MNRAS, 282, 958, doi: 10.1093/mnras/282.3.958
1996 doi
- [76]
-
[77]
C., Tuthill, P
Woodruff, H. C., Tuthill, P. G., Monnier, J. D., et al. 2008, ApJ, 673, 418, doi: 10.1086/523936
2008 doi
-
[78]
R., Stello, D., et al
Yu, J., Bedding, T. R., Stello, D., et al. 2020, MNRAS, 493, 1388, doi: 10.1093/mnras/staa300
2020 doi
-
[79]
2012, A&A, 545, A56, doi: 10.1051/0004-6361/201118150
Zhao-Geisler, R., Quirrenbach, A., K¨ ohler, R., & Lopez, B. 2012, A&A, 545, A56, doi: 10.1051/0004-6361/201118150
2012 doi
-
[80]
Zhevakin, S. A. 1953, Russian Astronom. Journal, 30, 161
1953
-
[81]
A., & Bedding, T
Zijlstra, A. A., & Bedding, T. R. 2002, JAA VSO, 31, 2
2002
-
[82]
A., Bedding, T
Zijlstra, A. A., Bedding, T. R., & Mattei, J. A. 2002, MNRAS, 334, 498, doi: 10.1046/j.1365-8711.2002.05467.x
2002
-
[83]
A., Bedding, T
Zijlstra, A. A., Bedding, T. R., Markwick, A. J., et al. 2004, MNRAS, 352, 325, doi: 10.1111/j.1365-2966.2004.07927.x 30 Hoai et al. APPENDIX Figure A1. 32 stars of sample B. From left to right: the mean normalised profile, the superimposed normalised profiles of the ascending...
2023
Reviewed August 12, 2026 · model on record in the stance chip above.
Discussion (0). Continue with ORCID to comment.