REVIEW 3 major objections 5 minor 36 references
Frustrated Random Walks: A Faster Algorithm to Evaluate Node Distances on Connected and Undirected Graphs
T0 review · 3 major / 5 minor · reviewed 2026-08-14 · deepseek-v4-flash
Pith's one-line read Frustrated random walks compute expected hitting times from a matrix power series and match DeepWalk rankings at 7–34 times the speed.
desk verdict The new transition matrix is a clean idea and the hitting-time derivation is correct, but the speed claim rests on an approximation the paper's own appendix contradicts, and the evaluation benchmarks against the algorithm it claims to beat. read the letter →
The pith
A machine-rendered reading of the paper's core claim, the machinery that carries it, and where it could break.
The reading
What carries the argument
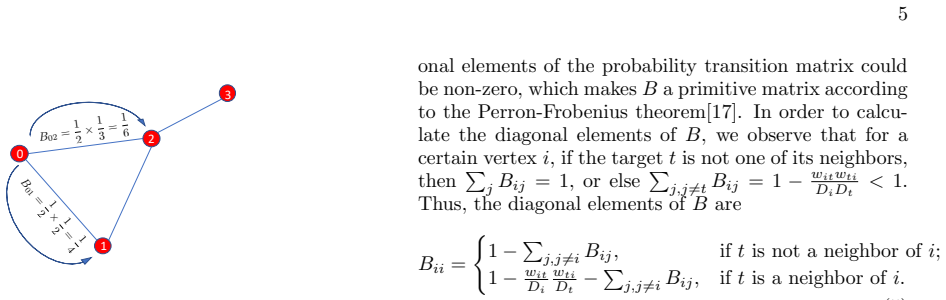
The load-bearing object is the target-dependent probability transition matrix $B$ of the frustrated random walk. Off-diagonal transition probabilities are products of a proposal probability $w_{ij}/D_i$ and an acceptance probability $w_{ji}/D_j$, so for undirected graphs $B$ is symmetric; diagonal entries correspond to staying in place when a proposal is rejected, which makes $B$ primitive. Because rows adjacent to the target sum to less than one, $B$ is not a Markov matrix and by Perron–Frobenius has spectral radius below one. That spectral-radius bound is what turns the hitting-time recurrence into the convergent matrix power series of Eq. (16), and it also sets the required number of terms: the paper estimates $N_{\max}\propto 1/(1-\lambda_{\max})\approx V$, giving $O((E+V)V)$ time overall, or $O(V^2)$ for sparse graphs.
What would settle it
Take a weighted co-occurrence or social graph with independently obtained human relevance ratings for a sample of node pairs (or a synthetic graph with planted node distances), rank nodes from each target by FRW and by DeepWalk, and compare both rankings to those labels; the central quality claim fails unless FRW matches or beats DeepWalk's agreement with the labels, not just with DeepWalk itself.
Extended reading notes
Core claim
The central discovery is that adding an acceptance probability to each random-walk transition produces a target-dependent transition matrix $B$ whose spectral radius is provably below one, and whose powers sum in closed form to all expected hitting times. For a fixed target $t$, the off-diagonal entries are $B_{ij}=\frac{w_{ij}}{D_i}\frac{w_{ji}}{D_j}$ for $j\ne t$, and the diagonal entries absorb rejected proposals so every row sums to one except rows adjacent to the target. Hitting probabilities satisfy $X_n=B X_{n-1}$, and summing this recurrence gives $\langle N_t\rangle=\sum_{n=0}^\infty B^n\mathbf{1}$, so expected hitting times are independent of the starting distribution. On the weighted Harry Potter, Dream of the Red Chamber, IMDB, and arXiv graphs, the authors use Spearman correlation with DeepWalk rankings as the quality measure; FRW has the highest correlations on the heavily weighted datasets and matches DeepWalk's top-neighbor lists, with a 7–34× running-time advantage. The paper therefore claims FRW is a practical distance oracle for huge undirected weighted graphs, with one untuned parameter.
Load-bearing premise
The load-bearing premise is that DeepWalk's cosine-distance rankings are a valid proxy for true node proximity—the paper states in Section IV A that without ground truth it can only benchmark against human judgement or DeepWalk and then defines quality as Spearman correlation with DeepWalk—so if DeepWalk is a poor measure of proximity, the tables show only that FRW approximates DeepWalk faster, not that FRW is the better distance.
Editorial extensions
If this is right
- Node proximity on weighted undirected graphs can be obtained by iterating sparse matrix-vector products, with no embedding training, random-walk corpus, or matrix inversion.
- On heavily weighted graphs that capture human interaction, FRW rankings track DeepWalk more closely than simple random walk rankings, which overrate low-degree neighbors of hubs, and personalized PageRank rankings, which overrate global hubs.
- The 7–34× speedup over DeepWalk grows with graph size, making the method suitable for graphs too large for embedding-based approaches.
- The single truncation parameter does not need tuning: ranking differences decay to zero as the expansion order grows, so the iteration can stop when the ranking stabilizes.
- The time complexity on sparse graphs is roughly $O(V^2)$, quadratic in the number of nodes, so the method remains practical where DeepWalk's memory and CPU cost do not scale.
Reading between the lines
- Because $B$ is symmetric for a fixed target, each target's hitting-time vector is a single matrix-power recurrence; one could reuse one target's solution to warm-start neighboring targets, an acceleration the paper does not explore.
- The FRW formula depends only on weighted adjacency, so it should transfer directly to link prediction or recommendation features on graphs where no node attributes exist; this is a testable extension the paper mentions only in passing.
- The observed exponential decay of ranking differences suggests a formal adaptive stopping rule based on the spectral gap, rather than a fixed threshold; on larger graphs this could be verified by comparing rankings at successive truncation orders.
- Since FRW does not require ground-truth labels, a natural stress test is to compare FRW distances with shortest-path distances on synthetic weighted graphs with planted community structure; the paper does not run this test.
Signed reviews
Editorial analysis
A structured set of objections, weighed in public.
Referee Report
Summary. The paper defines a "frustrated random walk" on an undirected weighted graph in which a step from i to j is proposed with probability w_ij/D_i and accepted with probability w_ij/D_j, giving off-diagonal transition probabilities w_ij^2/(D_iD_j). It derives an analytical expression for the vector of expected hitting times to a target t, ⟨N_t⟩ = Σ_{n≥0} B^n 1 (Eq. (16)), where B is the transition matrix with the target and its adherents removed. The authors propose to use the resulting asymmetric distances for node ranking, compare rankings against DeepWalk, SRW, and PPR via Spearman correlation, and report 7–34× speedups over DeepWalk. They claim O(V^2) time on sparse graphs, with Nmax (the power-series truncation order) as the only parameter and no tuning needed.
Significance. Equation (16) is a correct and useful closed form for expected hitting times; Appendix A.1 validates it on a small graph, and the authors provide code. If the ranking and speed claims held, FRW would be a practical parameter-free node-distance method for weighted graphs. However, the quality evaluation uses DeepWalk as its only quantitative benchmark while claiming to beat DeepWalk, and the complexity analysis is contradicted by the paper's own Appendix A.2. The contribution is therefore conditional: the analytic derivation is sound, but the two headline claims need substantial revision or re-scoping.
major comments (3)
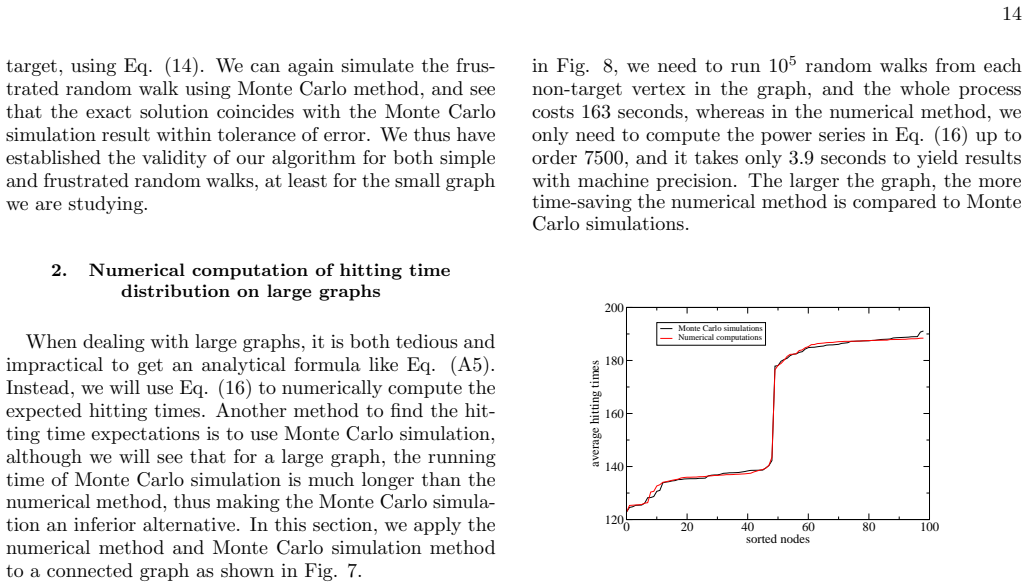
- [Section IV E, Eqs. (21)-(22), and Appendix A.2] The derivation of O(V^2) time rests on Eq. (21), which approximates the sum over target neighbors of w_it^2/(D_iD_t) by 1, leading to Nmax ≈ NB ≈ V in Eq. (22). The paper's own Appendix A.2 reports that a graph with only 100 vertices and 704 edges requires 7500 power-series terms to reach machine precision, i.e., Nmax ≈ 75V, not Nmax ≈ V. The number of terms needed is governed by the spectral gap of B, not by the average row-sum defect over target neighbors, and graphs with bottlenecks can make 1 - λmax much smaller than the value implied by Eq. (21). The advertised O(V^2) scaling is therefore not established; the authors should replace this heuristic with an empirical scaling study on larger graphs or with a bound explicitly involving 1/(1 - λmax).
- [Section IV D, Table X] The running-time comparison is apples-to-oranges. Table X reports FRW as the mean per-target time over 89, 82, and 99 targets, while the DeepWalk time is a one-time embedding cost. For tasks that require distances to many targets, such as recommendation or targeted ads, FRW must rebuild the target-specific matrix B and rerun the power series for each target, so the total cost scales with the number of targets. The 7–34× speedup is only demonstrated for the single-target ranking task, and the abstract's blanket 'more than ten times acceleration' claim is too broad.
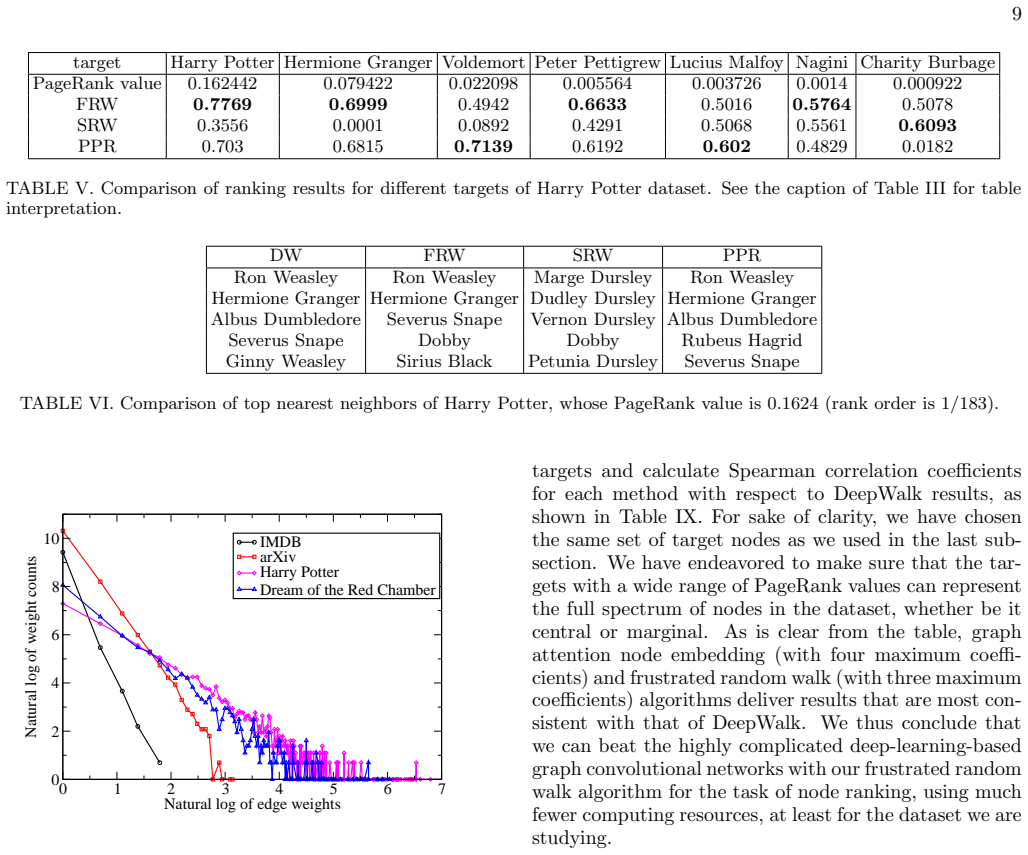
- [Section IV A, Section IV B, Tables III-V and VIII-IX] The quality evaluation is benchmark-circular. The manuscript explicitly states that 'we can only benchmark our computational results with human judgement or with DeepWalk results due to lack of ground truth' (Section IV A), and then uses Spearman correlation with DeepWalk as the quantitative quality measure. High correlation with DeepWalk shows similarity to DeepWalk, not superiority over it, so the repeated conclusion that FRW 'beats' or 'outperforms' DeepWalk is not supported by the tables. The informal top-neighbor checks in Tables VI and VII are anecdotal, and the Spearman coefficients are reported without confidence intervals or significance tests. The authors should either drop the claim of beating DeepWalk or evaluate on a task with external ground truth, such as link prediction or node classification.
minor comments (5)
- [Abstract and Section I] The phrase 'beat DeepWalk results with more than ten times acceleration' conflates quality and speed; the paper should distinguish 'produces rankings highly correlated with DeepWalk' from 'runs faster than DeepWalk'.
- [Section IV B] After Section IV A states that ground truth is lacking, Section IV B calls DeepWalk results 'our ground truth label'; this terminology is contradictory and should be aligned.
- [Section IV C, Fig. 5] The 'ranking difference' plotted in Fig. 5 is defined only in prose; please give the exact formula used to compute it from normalized similarity vectors.
- [Appendix A.2] The reported Nmax = 7500 is for machine precision; it would be informative to also report the Nmax required for the ranking-difference threshold 10^-4 used in Section IV D.
- [Tables III-V and VIII-IX] The Spearman coefficients are computed for only a handful of targets per dataset, with no confidence intervals or significance tests; reporting the number of targets and a measure of uncertainty would strengthen the comparison.
Circularity Check
No material circularity: the FRW expected-hitting-time derivation is self-contained, and the DeepWalk-benchmark evaluation does not feed back into the derivation.
full rationale
The paper's central derivation, Eq. (16), is obtained from the probability-generating-function recursion X_n = B X_{n-1}, giving <N_t> = sum_{n>=0} B^n 1. This is a standard Neumann-series identity for an absorbing Markov chain and does not invoke DeepWalk, PageRank, or any fitted quantity. The only parameter, Nmax, is a series truncation order, and the paper shows empirically (Fig. 5) that rankings stabilize as Nmax grows; this is robustness, not fitting. The transition matrix B in Eq. (4) is defined directly from graph weights and target exclusion, not from the expected hitting times it is used to predict, so there is no self-definitional reduction. The authors do use DeepWalk rankings as the quality benchmark (Section IV A: 'we can only benchmark our computational results with human judgement or with DeepWalk results due to lack of ground truth'), and then interpret high Spearman correlation with DeepWalk as evidence of quality; this is an evaluation-design limitation, not a circular derivation, because the FRW distances are computed without any reference to DeepWalk and the running-time comparison is independent of ranking quality. The speed analysis in Section IV E contains a genuine scaling concern: Eq. (22) assumes Nmax ≈ V via the 'naive approximation' in Eq. (21), while Appendix A.2 reports that a 100-vertex graph already requires 7500 power-series terms. That contradiction affects the credibility of the advertised O(V^2) complexity, but it is a correctness or complexity-analysis issue, not circularity. No load-bearing self-citation is present; the self-created GitHub datasets are data artifacts, not used to justify the mathematics. Overall, the derivation chain is self-contained against external math, and the reported circularity score is therefore 0.
Assumptions & free parameters
free parameters (1)
- Nmax (power expansion order) =
varies; e.g., ~7500 for a 100-node graph; threshold 1e-4 ranking difference
assumptions (4)
- domain assumption The graph is undirected, connected, simple (no self-loops)
- ad hoc to paper Acceptance probability w_ij/D_j models 'prestigious nodes accept higher-value proposals'
- ad hoc to paper Eq. (21): sum over neighbors of t of w_it^2/(D_i D_t) ≈ 1
- domain assumption DeepWalk embeddings are an acceptable proxy for node proximity (ground truth)
Cite this review
Pith. "Pith review of Frustrated Random Walks: A Faster Algorithm to Evaluate Node Distances on Connected and Undirected Graphs." pith.science (2026). https://pith.science/paper/VVM7RROT
@misc{pith2026190809644,
  author       = {Pith},
  title        = {Pith review of: Frustrated Random Walks: A Faster Algorithm to Evaluate Node Distances on Connected and Undirected Graphs},
  year         = {2026},
  howpublished = {\url{https://pith.science/paper/VVM7RROT}},
  note         = {Machine review of arXiv:1908.09644}
}
read the original abstract
Researchers have designed many algorithms to measure the distances between graph nodes, such as average hitting times of random walks, cosine distances from DeepWalk, personalized PageRank, etc. Successful although these algorithms are, still they are either underperforming or too time-consuming to be applicable to huge graphs that we encounter daily in this big data era. To address these issues, here we propose a faster algorithm based on an improved version of random walks that can beat DeepWalk results with more than ten times acceleration. The reason for this significant acceleration is that we can derive an analytical formula to calculate the expected hitting times of this random walk quickly. There is only one parameter (the power expansion order) in our algorithm, and the results are robust with respect to its changes. Therefore, we can directly find the optimal solution without fine-tuning of model parameters. Our method can be widely used for fraud detection, targeted ads, recommendation systems, topic-sensitive search, etc.
Figures
Figures from the paper (4 more)


Reference graph
Works this paper leans on
- [1]
-
[2]
Fouss, A
F. Fouss, A. Pirotte, J.-M. Renders, and M. Saerens, IEEE Transactions on knowledge and data engineering 19, 355 (2007)
2007
-
[3]
One is the outer loop whose number is determined by the power expansion order Nmax, and another is a hidden loop implied in the sparse matrix-vector product. From Eq. (16), we know that in order for the power series to converge, we need to compute the series at least up to order Nmax the value of which is dictated by the spectral radius λmax of transition...
- [4]
-
[5]
T. H. Haveliwala, in Proceedings of the 11th international conference on World Wide Web (ACM, 2002), pp. 517– 526
work page 2002
-
[6]
A. Grover and J. Leskovec, in Proceedings of the 22nd ACM SIGKDD international conference on Knowledge discovery and data mining (ACM, 2016), pp. 855–864
work page 2016
-
[7]
B. Perozzi, R. Al-Rfou, and S. Skiena, in Proceedings of the 20th ACM SIGKDD international conference on Knowledge discovery and data mining (ACM, 2014), pp. 701–710
work page 2014
-
[8]
D. J. Klein and M. Randi´ c, Journal of mathematical chemistry 12, 81 (1993)
1993
Show all 36 references
-
[9]
Lov´ asz, Combinatorics, Paul erdos is eighty 2, 1 (1993)
L. Lov´ asz, Combinatorics, Paul erdos is eighty 2, 1 (1993)
1993
-
[10]
Baesens, V
B. Baesens, V. Van Vlasselaer, and W. Verbeke, Fraud analytics using descriptive, predictive, and social network techniques: a guide to data science for fraud detection (John Wiley & Sons, 2015)
2015
-
[11]
L. Page, S. Brin, R. Motwani, and T. Winograd, Tech. Rep., Stanford InfoLab (1999)
1999
-
[12]
S. M. Ross, J. J. Kelly, R. J. Sullivan, W. J. Perry, D. Mercer, R. M. Davis, T. D. Washburn, E. V. Sager, J. B. Boyce, and V. L. Bristow, Stochastic processes , vol. 2 (Wiley New York, 1996)
1996
-
[13]
Mikolov, I
T. Mikolov, I. Sutskever, K. Chen, G. S. Corrado, and J. Dean, in Advances in neural information processing systems (2013), pp. 3111–3119
2013
-
[14]
X. Zhu, Z. Ghahramani, and J. D. Lafferty, inProceedings of the 20th International conference on Machine learning (ICML-03) (2003), pp. 912–919
2003
-
[15]
are the boundary conditions for a direct solution of the Laplacian equation to be feasible. However, if all the known labels are black, which is a common case in such real-world applications as fraud detection in a social net- work, then the only thing that a solution of the L...
2010
-
[16]
Chung and S.-T
F. Chung and S.-T. Yau, Journal of Combinatorial The- ory, Series A 91, 191 (2000)
2000
-
[17]
P. G. Doyle and J. L. Snell, Random walks and electric networks, vol. 22 (American Mathematical Soc., 1984)
1984
-
[18]
GitHub, https://github.com/suning-opensource/ frustrated-random-walk, [Programmatic implementa- tion of frustrated random walk algorithm]
-
[19]
C. D. Meyer, Matrix analysis and applied linear algebra , vol. 71 (SIAM, 2000)
2000
-
[20]
White and P
S. White and P. Smyth, in Proceedings of the ninth ACM SIGKDD international conference on Knowledge discov- ery and data mining (ACM, 2003), pp. 266–275
2003
-
[21]
Masuda, M
N. Masuda, M. A. Porter, and R. Lambiotte, Physics reports 716, 1 (2017)
2017
-
[22]
Kaggle, https://www.kaggle.com/carolzhangdc/ imdb-5000-movie-dataset , [IMDB 5000 Movie Dataset]
-
[23]
GitHub, https://github.com/PrimerLi/graph-data, [Harry Potter Data and arXiv Data created by Enzhi Li]
-
[24]
GitHub, https://github.com/PrimerLi/red_chamber_ dream_network, [Dream of Red Chamber Dataset cre- ated by Enzhi Li]
-
[25]
J. Tang, M. Qu, M. Wang, M. Zhang, J. Yan, and Q. Mei, in Proceedings of the 24th international conference on world wide web (2015), pp. 1067–1077
2015
-
[26]
D. Wang, P. Cui, and W. Zhu, in Proceedings of the 22nd ACM SIGKDD international conference on Knowledge discovery and data mining (2016), pp. 1225–1234
2016
-
[27]
Hamilton, Z
W. Hamilton, Z. Ying, and J. Leskovec, in Advances in neural information processing systems (2017), pp. 1024– 1034
2017
-
[28]
W. L. Hamilton, R. Ying, and J. Leskovec, arXiv preprint arXiv:1709.05584 (2017)
2017 arXiv
-
[29]
Abu-El-Haija, B
S. Abu-El-Haija, B. Perozzi, R. Al-Rfou, and A. A. Alemi, in Advances in Neural Information Processing Systems (2018), pp. 9180–9190
2018
-
[30]
ˇReh˚ uˇ rek and P
R. ˇReh˚ uˇ rek and P. Sojka, inProceedings of the LREC 2010 Workshop on New Challenges for NLP Frameworks (ELRA, Valletta, Malta, 2010), pp. 45–50, http://is. muni.cz/publication/884893/en
2010
-
[31]
Fortunato, Physics reports 486, 75 (2010)
S. Fortunato, Physics reports 486, 75 (2010)
2010
-
[32]
M. E. Newman, Proceedings of the national academy of sciences 103, 8577 (2006)
2006
-
[33]
Clauset, M
A. Clauset, M. E. J. Newman, and C. Moore, Phys. Rev. E 70, 066111 (2004), URL https://link.aps.org/doi/ 10.1103/PhysRevE.70.066111
2004 doi
-
[34]
M. E. J. Newman, Phys. Rev. E 74, 036104 (2006), URL https://link.aps.org/doi/10.1103/PhysRevE. 74.036104. Appendix A: Experimental evidence on artificial dataset
2006 doi
-
[35]
The graph we are going to study contains five nodes, as shown in Fig
An analytical calculation of hitting time distribution on a simple graph In this section, we will show how to calculate the hit- ting time distribution on a small graph using analytical methods. The graph we are going to study contains five nodes, as shown in Fig. 6. We take no...
-
[36]
Numerical computation of hitting time distribution on large graphs When dealing with large graphs, it is both tedious and impractical to get an analytical formula like Eq. (A5). Instead, we will use Eq. (16) to numerically compute the expected hitting times. Another method to ...
Reviewed August 14, 2026 · model on record in the stance chip above.
Discussion (0). Continue with ORCID to comment.