REVIEW 4 major objections 6 minor 44 references
Toward quantitative fractography using convolutional neural networks
T0 review · 4 major / 6 minor · reviewed 2026-08-14 · deepseek-v4-flash
Pith's one-line read A convolutional neural network trained only on MgAl2O4 SEM images labels intergranular and transgranular fracture pixels in ceramics, reaching 91.1% mean IoU on the same material and 94% on Al2O3 without retraining.
desk verdict Plausible, transparent proof of concept for CNN-based fracture-mode quantification, but the headline IoU numbers rest on one annotator's labels and 14 test images. read the letter →
The pith
A machine-rendered reading of the paper's core claim, the machinery that carries it, and where it could break.
The reading
What carries the argument
The central object is the U-net, a symmetric encoder-decoder convolutional network for semantic segmentation in which the decoder upsamples with transpose convolutions and concatenates features from the matching encoder stage at each level. The encoder is a deep classification backbone initialized with pre-trained weights and fine-tuned on the fracture dataset, allowing high accuracy with a relatively small annotated set. Training uses categorical cross-entropy loss with the Adam optimizer, and the unannotated background pixels form a void class that is excluded when computing per-class Intersection-over-Union and F-measure. These choices let the model output a class label for every pixel, which is exactly the topographic map fractography needs.
What would settle it
Have several independent fractography experts fully annotate the same SEM test images and compute pairwise expert-expert IoU: if expert agreement is close to the model's 91–94% IoU, the claim is supported, whereas large expert disagreement would show the reported numbers measure agreement with one annotator's subjective labels rather than objective fracture mode.
Extended reading notes
Core claim
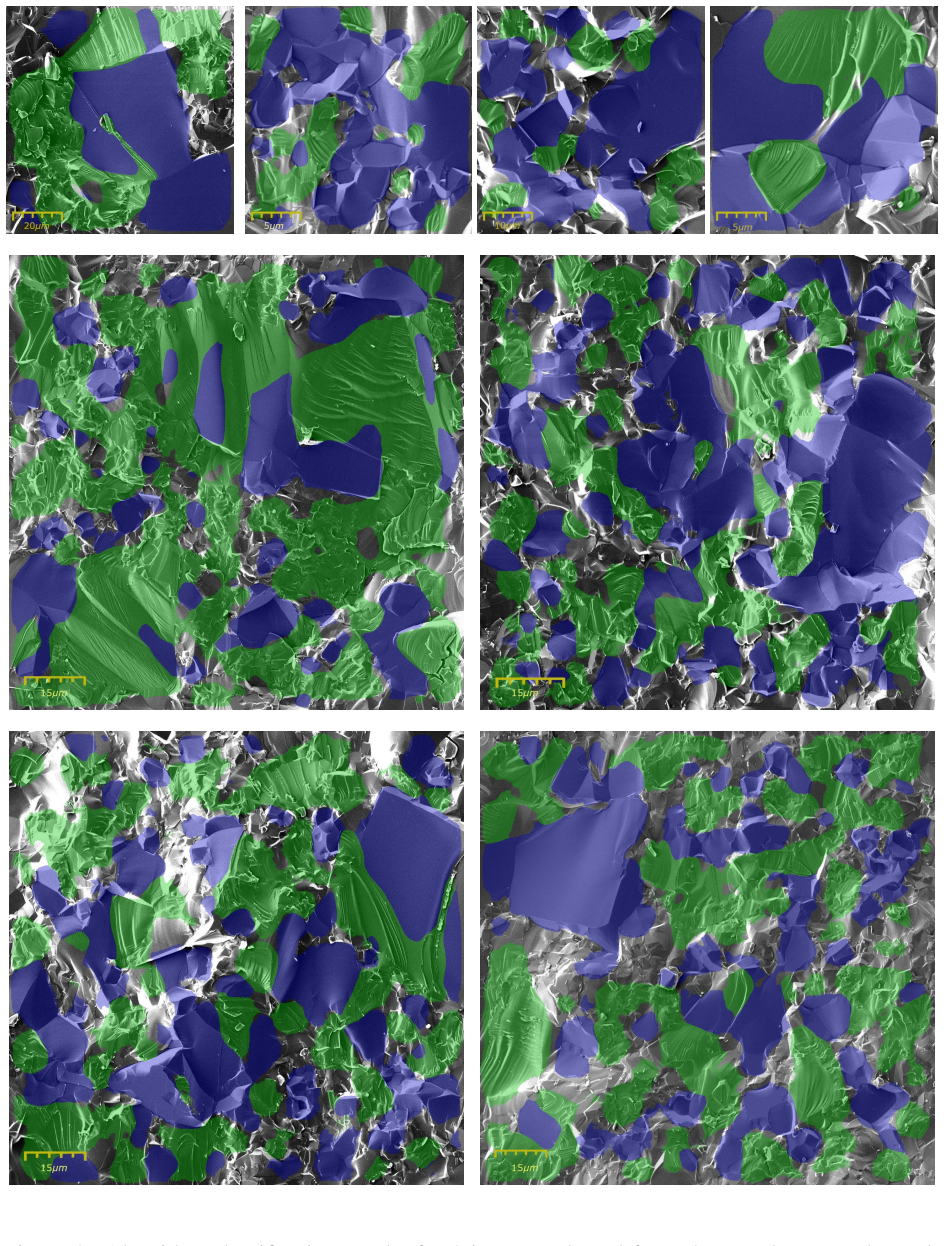
Using a U-net semantic segmentation network fine-tuned on manually annotated SEM images of MgAl2O4 fracture surfaces, the authors classify every pixel of a fracture image as intergranular, transgranular, or background. When the background class is treated as a void and excluded from evaluation, the network reaches a total mean IoU of 91.1% on the held-out MgAl2O4 test set and, without any retraining, 94% on SEM images of Al2O3. The discovery is that learned pixel-wise segmentation transfers across ceramic materials with different grain sizes and surface morphologies, so the relative fractions of the two fracture modes can be read automatically rather than estimated by a human.
Load-bearing premise
The load-bearing premise is that the authors' manual annotations are the correct ground truth for intergranular and transgranular fracture, since every reported IoU and F-measure is computed against those annotations and no independent expert labeling is supplied.
Editorial extensions
If this is right
- Failure analysis can measure the relative area of intergranular versus transgranular fracture directly from SEM images, replacing slow manual tracing with an automated pixel-level count.
- The same trained network can be used on a different ceramic material with different feature sizes and no retraining, with reported mean IoU of 94% on alumina.
- Automated fracture-mode fractions give computational fracture models a quantitative experimental target: simulation predictions of transgranular versus intergranular area can be compared with measured fractions.
- Adding new fracture morphologies such as dimples or fatigue striations is presented as a matter of annotating the new class and retraining the segmentation model.
Reading between the lines
- The reported cross-material transfer may be inflated by class imbalance, since the authors note that intergranular fracture dominates Al2O3 and is the better-classified class; a balanced dataset with per-class IoU would test this.
- The same segmentation approach could be applied to images from other microscopy modes, such as optical fractography or orientation maps, to link fracture path to crystallographic orientation, though the paper only demonstrates SEM secondary-electron images.
- An active-learning variant that asks an expert to annotate only low-confidence regions could cut the annotation bottleneck the paper identifies for new materials; the void/background scheme already makes partial annotation natural.
Signed reviews
Editorial analysis
A structured set of objections, weighed in public.
Referee Report
Summary. This manuscript proposes a U-net-based semantic segmentation method to classify SEM fracture surface images into intergranular and transgranular fracture regions, using a network trained on MgAl2O4 images and evaluated on held-out MgAl2O4 and Al2O3 images without additional training. The authors report a total mean IoU of 91.1% on the MgAl2O4 test set after excluding background pixels, a total mean IoU of 94% on Al2O3, and F-measures of 90.7% and 82.4%, respectively. The paper also makes the training data, annotations, and source code publicly available and suggests extensions to other fracture morphologies.
Significance. If the reported accuracies are reproducible, this work would be a useful step toward automated quantitative fractography, with potential applications in failure analysis and in validating computational fracture models. The open data and code, the honest reporting of metrics both with and without void-class exclusion, and the explicit test of cross-material transferability are clear strengths. The main limitation is that all quantitative claims rest on manual annotations from a single source, with no inter-annotator agreement study and only 8 fully annotated MgAl2O4 test images and 6 Al2O3 images behind the headline numbers; the claimed robustness and user independence are therefore not yet fully supported. The paper's contribution is nevertheless valuable as a proof-of-concept if the validation concerns are addressed.
major comments (4)
- [Results and discussion (training paragraph); Methods (SEM imaging and Training)] All reported accuracy values (71.2%, 91.1%, 94%, and the F-measures) are computed against manual annotations produced by the authors, but the manuscript provides no inter-annotator agreement study, no independent ground-truth validation, and no explicit annotation protocol beyond selecting 'the most characteristic features' of each fracture mode. The authors themselves state that the accuracy values are 'with respect to the partial annotations that we have manually created.' Because the central claim is a quantitative, user-independent fractography tool, the evaluation must demonstrate that the labels are reproducible across experts; otherwise the headline numbers measure agreement with one annotator's interpretation rather than with an objective standard. Please add an inter-annotator agreement analysis (e.g., pairwise IoU or Cohen's kappa on a subset of images) and report the resulting uncertainty in all headline metrics.
- [Results and discussion (fully annotated test images); Transferability] The fully annotated MgAl2O4 evaluation uses only 8 test images, and the Al2O3 transfer evaluation uses only 6 images, with no standard deviations, confidence intervals, or per-image results reported. The manuscript describes the method as 'extensively tested,' but with n=8 and n=6 the reported mean IoU values are highly sensitive to individual images. Please report per-image IoU values, per-class breakdowns, and measures of dispersion for both datasets; if additional test images are not available, this should be explicitly stated as a limit on the strength of the quantitative claims.
- [Results and discussion (void-class paragraph); Transferability] The headline evaluation excludes background pixels and pixels with intensity greater than 220 from the ground truth before computing IoU. The network, however, was trained with background as a real class, so false predictions on background areas are not penalized in the reported 91.1% and 94% figures. The paper is transparent in also reporting 71.2% for the same MgAl2O4 images, but the Summary emphasizes the excluded-background number. Please report end-to-end metrics on the fully annotated images, including the background class as part of the evaluation, as the primary accuracy measure, and provide a sensitivity analysis for the high-brightness threshold of 220.
- [Transferability] For the Al2O3 transfer test, only total IoU values (78% and 94%) are reported, without per-class IoU for intergranular and transgranular regions. The Summary itself suggests that the high score is 'possibly due to the large dominance of the intergranular fracture which is better classified in our training set,' which implies that a total IoU dominated by one class can mask poor performance on the minority class. Please report per-class IoU values, class area fractions, and the annotation procedure used for the Al2O3 test images.
minor comments (6)
- [Methods (Materials)] The word 'transperent' should be 'transparent' in the description of the Spinel specimens.
- [Results and discussion (F-measure paragraph); Transferability] There are minor typographical errors: 'intergranural' should be 'intergranular' in the sentence before Eq. (1), and 'asses' should be 'assess' in the Transferability section.
- [Introduction (related work paragraph)] The statement that this is 'the only published work using exclusively machine learning methods for classification of fracture surfaces' appears inconsistent with the immediately preceding citation to ref. 21, which uses convolutional neural networks on SEM fracture images; please rephrase to avoid overclaiming.
- [Figure 3 and Figure 5 captions] Please specify whether the displayed images are the complete test sets or representative examples; currently the reader cannot tell if Figures 3 and 5 show all 8 MgAl2O4 and 6 Al2O3 test images or only a subset.
- [Results and discussion (IoU evaluation)] The high-brightness filter threshold (pixel intensity > 220) is introduced without motivation or a reference; a brief justification or sensitivity check would improve reproducibility.
- [Methods (Network Architecture)] The phrase 'transpose convolution (or deconvolution) layer' is imprecise; the operation implemented is a transposed convolution, and 'deconvolution' is ambiguous in the deep learning literature.
Circularity Check
No circularity found: the IoU and F-measure results are held-out test evaluations against manual annotations, not restatements of the training inputs.
full rationale
The paper's derivation chain is empirical rather than definitional. A U-net/VGG16 encoder-decoder is trained on MgAl2O4 SEM images with manual partial annotations, using categorical cross-entropy loss; validation accuracy is monitored during training; then held-out MgAl2O4 test images and untrained Al2O3 images are predicted with the fixed trained weights and scored by IoU and F-measure. No reported quantity is defined in terms of the quantity it is said to predict: the test images were not used for weight updates, so the 91.1% and 94% IoU values are conditional measurements of agreement between the network and manual labels, not forced identities. The paper explicitly limits its own accuracy claim by stating that 'these accuracy values are with respect to the partial annotations that we have manually created,' and it explains that ambiguous or bright pixels were filtered or assigned to the void class; these are evaluation-validity choices, not circular reductions. The reliance on a single annotator's labels is a real data-quality and reproducibility concern, but that concern is about measurement validity, not about the derivation being equivalent to its inputs. The only self-citations ([10], [30], and the data source [41]) provide context, a fracture-surface-roughness correlation, and the MgAl2O4 specimens respectively; none is used to justify the segmentation accuracy or to forbid alternative models. No equation restates a fitted parameter as a prediction, no uniqueness theorem is imported from the authors' prior work, and no ansatz is smuggled in via self-citation. Consequently there is no circular step to exhibit under the requirement that circularity be shown by explicit reduction.
Assumptions & free parameters
free parameters (1)
- High-brightness pixel intensity threshold =
220 (0-255)
assumptions (4)
- domain assumption SEM secondary-electron image texture reliably distinguishes intergranular from transgranular fracture modes at the pixel level.
- domain assumption The authors' manual annotations are a correct ground truth for the fracture modes.
- domain assumption ImageNet-pretrained VGG16 features transfer to SEM fracture images.
- domain assumption The U-net architecture is suitable for training with small datasets.
Cite this review
Pith. "Pith review of Toward quantitative fractography using convolutional neural networks." pith.science (2026). https://pith.science/paper/VWEBMPDF
@misc{pith2026190802242,
  author       = {Pith},
  title        = {Pith review of: Toward quantitative fractography using convolutional neural networks},
  year         = {2026},
  howpublished = {\url{https://pith.science/paper/VWEBMPDF}},
  note         = {Machine review of arXiv:1908.02242}
}
abstract
The science of fractography revolves around the correlation between topographic characteristics of the fracture surface and the mechanisms and external conditions leading to their creation. While being a topic of investigation for centuries, it has remained mostly qualitative to date. A quantitative analysis of fracture surfaces is of prime interest for both the scientific community and the industrial sector, bearing the potential for improved understanding on the mechanisms controlling the fracture process and at the same time assessing the reliability of computational models currently being used for material design. With new advances in the field of image analysis, and specifically with machine learning tools becoming more accessible and reliable, it is now feasible to automate the process of extracting meaningful information from fracture surface images. Here, we propose a method of identifying and quantifying the relative appearance of intergranular and transgranular fracture events from scanning electron microscope images. The newly proposed method is based on a convolutional neural network algorithm for semantic segmentation. The proposed method is extensively tested and evaluated against two ceramic material systems ($Al_2O_3$,$MgAl_2O_4$) and shows high prediction accuracy, despite being trained on only one material system ($MgAl_2O_4$). While here attention is focused on brittle fracture characteristics, the method can be easily extended to account for other fracture morphologies, such as dimples, fatigue striations, etc.
Figures


Figures from the paper (2 more)


Reference graph
Works this paper leans on
-
[1]
Mills, K., Davis, J. R., Destefani, J. & Dieterich, D. ASM Handbook, Volume 12-Fractography (Asm International Materials Park, OH, 1987)
work page 1987
-
[2]
Tipper, C. The fracture of metals. Metallurgia 39, 133–137 (1949)
work page 1949
-
[3]
Pineau, A., Benzerga, A. A. & Pardoen, T. Failure of metals i: Brittle and ductile fracture. Acta Materialia 107, 424–483 (2016)
work page 2016
-
[4]
Pineau, A., McDowell, D. L., Busso, E. P. & Antolovich, S. D. Failure of metals ii: Fatigue. Acta Materialia 107, 484–507 (2016)
work page 2016
-
[5]
Zhang, Q. B. & Zhao, J. Effect of loading rate on fracture toughness and failure micromecha- nisms in marble. Engineering Fracture Mechanics 102, 288–309 (2013)
work page 2013
-
[6]
Hu, G., Chen, C., Ramesh, K. & McCauley, J. Mechanisms of dynamic deformation and dynamic failure in aluminum nitride. Acta materialia 60, 3480–3490 (2012)
work page 2012
-
[7]
Shemtov-Yona, K., ¨Ozcan, M. & Rittel, D. Fractographic characterization of fatigued zirconia dental implants tested in room air and saline solution. Engineering Failure Analysis 96, 298– 310 (2019)
work page 2019
-
[8]
Biezma, M. V ., Berlanga, C. & Argandona, G. Relationship between microstructure and frac- ture types in a uns s32205 duplex stainless steel. Materials Research 16, 965–969 (2013)
work page 2013
Show all 44 references
-
[9]
& Molinari, J
Kraft, R. & Molinari, J. A statistical investigation of the effects of grain boundary properties on transgranular fracture. Acta Materialia 56, 4739–4749 (2008). 23
2008
-
[10]
& Srivastava, A
Osovski, S., Needleman, A. & Srivastava, A. Intergranular fracture prediction and microstruc- ture design. International Journal of Fracture216, 135–148 (2019)
2019
-
[11]
& Liu, L
Hu, W., Wiliem, A., Lovell, B., Barter, S. & Liu, L. Automation of Quantitative Fractog- raphy for Determination of Fatigue Crack Growth Rates with Marker Loads. In 29th ICAF Symposium Nagoya , June (2017)
2017
-
[12]
Y ., Student, O
Kosarevych, R. Y ., Student, O. Z., Svirs’Ka, L. M., Rusyn, B. P. & Nykyforchyn, H. M. Computer analysis of characteristic elements of fractographic images. Materials Science 48, 474–481 (2013)
2013
-
[13]
& Shoich, I
Kenjiro, K., Minoshima, K. & Shoich, I. Recognition of Different Fracture Surface Mor- phologies using Computer Image Processing Technique. JSME international journal. Ser. A, Mechanics and material engineering 36, 220–227 (1993)
1993
-
[14]
Measurement: Journal of the International Measurement Confedera- tion 47, 130–144 (2014)
Characterization of micrographs and fractographs of Cu-strengthened HSLA steel using im- age texture analysis. Measurement: Journal of the International Measurement Confedera- tion 47, 130–144 (2014). URL http://dx.doi.org/10.1016/j.measurement. 2013.08.030
2014 doi
-
[15]
& Kobayashi, A
Yang, W.-J., Yu, C.-T. & Kobayashi, A. S. Sem quantification of transgranular vs intergranular fracture. Journal of the American Ceramic Society 74, 290–295 (1991)
1991
-
[16]
& Lewis, D
Chowdhury, A., Kautz, E., Yener, B. & Lewis, D. Image driven machine learning methods for microstructure recognition. Computational Materials Science 123, 176–187 (2016). URL http://dx.doi.org/10.1016/j.commatsci.2016.05.034. 24
2016 doi
-
[18]
Li, W., Field, K. G. & Morgan, D. Automated defect analysis in electron microscopic im- ages. npj Computational Materials 4, 1–9 (2018). URL http://dx.doi.org/10. 1038/s41524-018-0093-8
2018
-
[19]
Gola, J. et al. Advanced microstructure classification by data mining methods. Computa- tional Materials Science 148, 324–335 (2018). URL https://doi.org/10.1016/j. commatsci.2018.03.004
2018 doi
-
[20]
X., Prieto-Ortiz, F
Bastidas-Rodriguez, M. X., Prieto-Ortiz, F. A. & Espejo, E. Fractographic classification in metallic materials by using computer vision. Engineering Failure Analysis 59, 237–252 (2016). URL http://dx.doi.org/10.1016/j.engfailanal.2015.10.008
2016 doi
-
[21]
& Juneviˇcius, R
Konovalenko, I., Maruschak, P., Prentkovskis, O. & Juneviˇcius, R. Investigation of the Rupture Surface of the Titanium Alloy Using Convolutional Neural Networks. Materials 11, 2467 (2018)
2018
-
[22]
& Yuille, A
Chen, L.-C., Papandreou, G., Kokkinos, I., Murphy, K. & Yuille, A. L. Semantic im- age segmentation with deep convolutional nets and fully connected crfs. arXiv preprint arXiv:1412.7062 (2014). 25
2014 arXiv
-
[23]
& Zisserman, A
Simonyan, K. & Zisserman, A. Very Deep Convolutional Networks for Large-Scale Image Recognition. CoRR 1–14 (2014). URL http://arxiv.org/abs/1409.1556. 1409. 1556
2014 arXiv
-
[24]
& Sun, J
He, K., Zhang, X., Ren, S. & Sun, J. Deep residual learning for image recognition. InProceed- ings of the IEEE Computer Society Conference on Computer Vision and Pattern Recognition, vol. 2016-Decem, 770–778 (2016). arXiv:1512.03385v1
2016 arXiv
-
[25]
Szegedy, C. et al. Going deeper with convolutions.Proceedings of the IEEE Computer Society Conference on Computer Vision and Pattern Recognition 07-12-June, 1–9 (2015). arXiv: 1409.4842v1
2015 arXiv
-
[26]
Donahue, J. et al. DeCAF: A Deep Convolutional Activation Feature for Generic Visual Recognition. CoRR abs/1310.1 (2013). URL http://arxiv.org/abs/1310.1531. 1310.1531
2013 arXiv
-
[27]
Zeiler, M. D. & Fergus, R. Visualizing and Understanding Convolutional Networks. CoRR abs/1311.2 (2013). URL http://arxiv.org/abs/1311.2901. 1311.2901
2013 arXiv
-
[28]
Lin, T.-Y . et al. Microsoft COCO: Common Objects in Context. In Fleet, D., Pajdla, T., Schiele, B. & Tuytelaars, T. (eds.) Computer Vision – ECCV 2014, 740–755 (Springer Inter- national Publishing, Cham, 2014)
2014
-
[29]
Russakovsky, O. et al. ImageNet Large Scale Visual Recognition Challenge. International Journal of Computer Vision 115, 211–252 (2015). arXiv:1409.0575v3. 26
2015 arXiv
-
[30]
& Osovski, S
Barak, Y ., Srivastava, A. & Osovski, S. Correlating fracture toughness and fracture surface roughness via correlation length scale. International Journal of Fracture1–12 (2019)
2019
-
[31]
A Survey of Semantic Segmentation
Thoma, M. A Survey of Semantic Segmentation. CoRR abs/1602.0, 1–16 (2016). URL http://arxiv.org/abs/1602.06541. 1602.06541
2016 arXiv
-
[32]
& Koller, D
Gould, S., Rodgers, J., Cohen, D., Elidan, G. & Koller, D. Multi-class segmentation with relative location prior. International Journal of Computer Vision 80, 300–316 (2008)
2008
-
[33]
& Criminisi, A
Shotton, J., Winn, J., Rother, C. & Criminisi, A. TextonBoost: Joint appearance, shape and context modeling for multi-class object recognition and segmentation. In Lecture Notes in Computer Science (including subseries Lecture Notes in Artificial Intelligence and Lecture Notes ...
2006
-
[34]
& Hinton, G
Nair, V . & Hinton, G. E. Rectified Linear Units Improve Restricted Boltzmann Machines. In Proceedings of the 27th International Conference on International Conference on Machine Learning, 3 (2010). URL https://www.cs.toronto.edu/{˜}hinton/absps/ reluICML.pdf. 1111.6189v1
2010 arXiv
-
[35]
& Darrell, T
Long, J., Shelhamer, E. & Darrell, T. Fully Convolutional Networks for Semantic Segmenta- tion. In The IEEE Conference on Computer Vision and Pattern Recognition (CVPR)(2015)
2015
-
[36]
& Cipolla, R
Badrinarayanan, V ., Kendall, A. & Cipolla, R. SegNet: A Deep Convolutional Encoder- Decoder Architecture for Image Segmentation. IEEE transactions on pattern analysis and machine intelligence 39, 2481–2495 (2017). URL http://www.ncbi.nlm.nih.gov/ pubmed/28060704. arXiv:1511.0...
2017
-
[37]
& Brox, T
Ronneberger, O., Fischer, P. & Brox, T. U-net: Convolutional networks for biomedi- cal image segmentation. Lecture Notes in Computer Science (including subseries Lecture Notes in Artificial Intelligence and Lecture Notes in Bioinformatics) 9351, 234–241 (2015). arXiv:1505.04597v1
2015 arXiv
-
[38]
& Others
Chollet, F. & Others. Keras. \url{https://keras.io} (2015)
2015
-
[39]
Abadi, M. et al. TensorFlow: Large-Scale Machine Learning on Heterogeneous Distributed Systems. vol. abs/1603.0 (2016). URL http://arxiv.org/abs/1603.04467. 1603.04467
2016 arXiv
-
[40]
Martin, A. et al. {TensorFlow}: Large-Scale Machine Learning on Heterogeneous Systems (2015). URL https://www.tensorflow.org/
2015
-
[41]
& Rittel, D
Blumer, D. & Rittel, D. The influence of microstructure on the static and dynamic strength of transparent magnesium aluminate spinel (mgal2o4). Journal of the European Ceramic Society 38, 3618–3634 (2018)
2018
-
[42]
Quinn, G. D. Fractography of ceramics and glasses (National Institute of Standards and Technology Washington, DC, 2016)
2016
-
[43]
& Zisserman, A
Dutta, A. & Zisserman, A. The {VIA} Annotation Software for Images, Audio and Video. arXiv preprint arXiv:1904.10699 (2019)
2019 arXiv
-
[44]
& Zissermann, A
Dutta, A., Gupta, A. & Zissermann, A. {VGG} Image Annotator ( {VIA}). http://www.robots.ox.ac.uk/˜vgg/software/via/ (2016). 28
2016
-
[45]
Kingma, D. P. & Ba, J. Adam: A Method for Stochastic Optimization. CoRR 1–15 (2014). URL http://arxiv.org/abs/1412.6980. 1412.6980. 29
2014 arXiv
Reviewed August 14, 2026 · model on record in the stance chip above.
Discussion (0). Continue with ORCID to comment.