REVIEW 3 major objections 5 minor 55 references
Dynamic quantum sensing of paramagnetic species using nitrogen-vacancy centers in diamond
T0 review · 3 major / 5 minor · reviewed 2026-08-14 · deepseek-v4-flash
Pith's one-line read This paper demonstrates that comparing nitrogen-vacancy photoluminescence with microwaves on and off can detect paramagnetic species in solution and in cell models at attomole levels in tens of milliseconds.
desk verdict MW-on/off NV sensing on bulk diamond is a useful, accessible protocol, but the headline LOD and reaction-conversion numbers rest on an unmeasured sensing depth and a calibration transfer that need better support. read the letter →
The pith
A machine-rendered reading of the paper's core claim, the machinery that carries it, and where it could break.
The reading
What carries the argument
The load-bearing quantity is the normalized PL contrast ratio $$R = \frac{(\mathrm{PL}_{\mathrm{on}}/\mathrm{PL}_{\mathrm{off}})_{\mathrm{sample}}}{(\mathrm{PL}_{\mathrm{on}}/\mathrm{PL}_{\mathrm{off}})_{\mathrm{water}}},$$ measured from 100 µm by 100 µm fields of view on an ensemble of shallow NV$^-$ centers created by ion implantation in electronic-grade diamond. The paper uses this ratio as a concentration and paramagnetic-strength readout, validated by ODMR spectra showing that the depth of the 2.87 GHz resonance dip, rather than its width or position, changes with paramagnetic species. The proposed physical channel is magnetic spin noise from the unpaired electrons increasing the NV spin relaxation rate, with charge-state ionization considered as a possible secondary contributor.
What would settle it
One decisive experiment is to titrate a paramagnetic species while spectrally resolving the NV$^-$ and neutral NV$^0$ emission bands together with the microwaves-on/microwaves-off contrast: if the contrast change disappears whenever the NV$^-$/NV$^0$ population is held fixed by adjusting illumination intensity, the attributed paramagnetic-spin-noise mechanism is falsified. A complementary control is to compare ferricyanide with its diamagnetic reduced form ferrocyanide at matched concentration under the same protocol.
Extended reading notes
Core claim
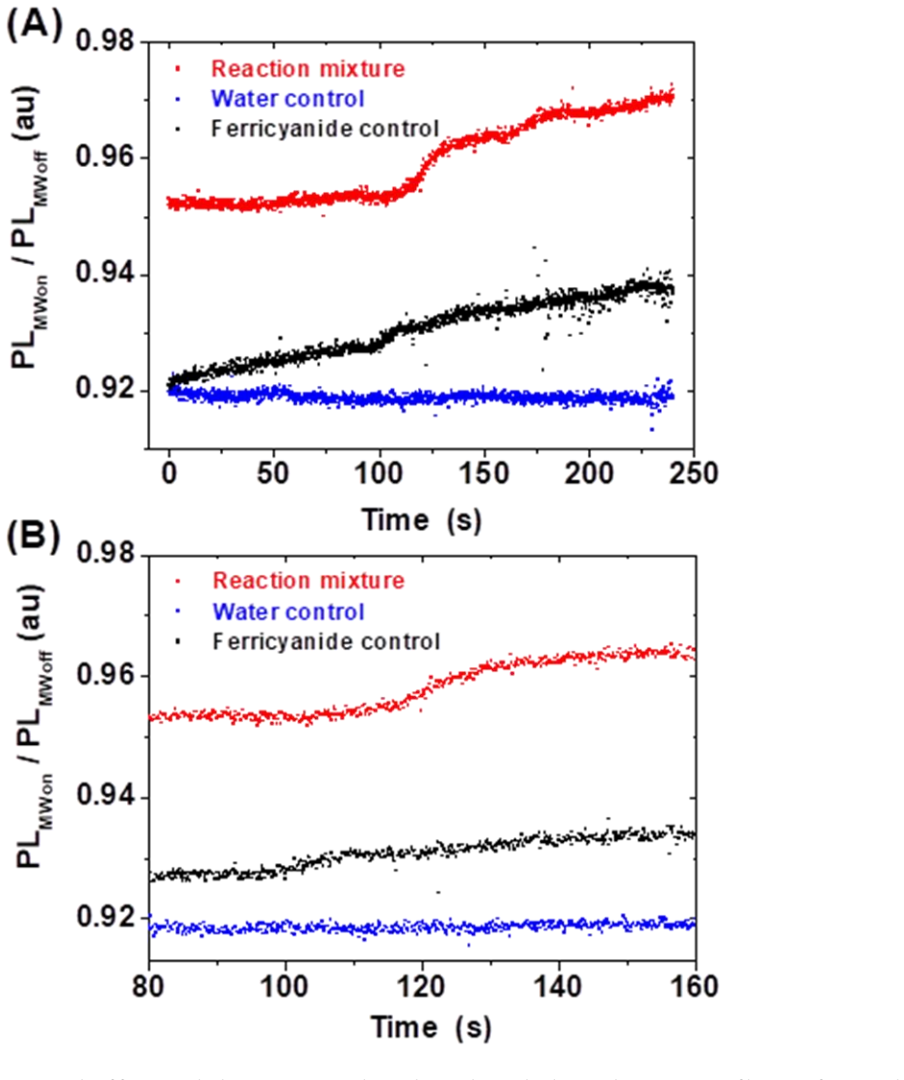
The paper's central discovery is that the normalized contrast ratio between NV photoluminescence with microwaves at 2.868 GHz and with microwaves off depends monotonically on the concentration and paramagnetic strength of solutes, while the ODMR resonance position and linewidth stay essentially unchanged. For Gd(NO$_3$)$_3$, FeCl$_3$, and Gadobutrol the contrast increases with concentration; for LaCl$_3$, a diamagnetic analogue of Gd$^{3+}$, it does not. This enables quantification of paramagnetic salts down to less than 10 attomol over a 100 µm by 100 µm field of view, real-time tracking of changing Gd$^{3+}$ concentrations at about 5.7 samples per second, monitoring of the acid-driven conversion of ferricyanide to hexaaquairon(III) at an estimated 60% conversion efficiency, and widefield imaging of Gd$^{3+}$-labelled phospholipids in synthetic liposomes. The authors state that the underlying mechanism is not yet fully established, proposing that freely diffusing paramagnetic species generate magnetic spin noise that shortens NV spin relaxation and possibly that NV charge-state dynamics contribute; the protocol is presented as an empirical sensing readout rather than a mechanistic measurement.
Load-bearing premise
The quantitative and biological conclusions assume that the microwaves-on/microwaves-off contrast changes are caused specifically by the paramagnetic strength of the dissolved species in a concentration-dependent way; the paper states this mechanism is not yet understood, so non-magnetic surface effects or NV charge-state dynamics could in principle produce the same readout.
Editorial extensions
If this is right
- Free radicals and paramagnetic metalloproteins could be imaged in living cells at sub-cellular resolution under ambient conditions in minutes, using equipment already present in many biology laboratories.
- Concentration changes can be sampled at roughly 5.7 Hz with the current hardware, and the authors estimate that faster cameras could push this toward 250 Hz, which would match the timescales of short-lived nitric-oxide bursts.
- The protocol is non-destructive and requires only about 100 fL of sample volume, so repeated measurements can follow reaction kinetics or dynamic biological processes.
- The contrast responds differently to free Gd$^{3+}$, chelated Gadobutrol, and Fe$^{3+}$, indicating sensitivity to the coordination environment as well as to the total electron spin.
- Because the readout is a simple two-image ratio, it can be applied to widefield imaging of membrane-bound or targeted paramagnetic probes in cell models without microwave pulse engineering.
Reading between the lines
- If the contrast is dominated by T1-like magnetic spin noise, the same two-image ratio could be extended to quantify the density of spin-labelled biomolecules in fixed or live cells, giving a widefield alternative to EPR imaging.
- The claimed attomole limit of detection relies on an assumed detection volume extending about 10 nm above the diamond surface; independently varying the NV depth or surface chemistry would convert the current 'less than 10 attomol' figure into a firmer volumetric concentration.
- A natural testable extension is to spectrally separate NV$^-$ and neutral NV$^0$ emission during the same microwaves-on/microwaves-off protocol, which would show whether the readout is purely magnetic or partly driven by charge-state dynamics.
- The fast differential readout could be combined with spin traps or targeted paramagnetic probes to watch short-lived radical production from mitochondria or immune cells, a use the paper points toward but does not demonstrate.
Signed reviews
Editorial analysis
A structured set of objections, weighed in public.
Referee Report
Summary. The paper reports a sensing protocol in which the photoluminescence (PL) of near-surface nitrogen-vacancy (NV) centers in diamond is recorded with microwaves on resonance and off resonance, and the ratio is used to detect paramagnetic species in aqueous solution. The authors calibrate this normalized contrast against concentration for Gd(NO3)3, FeCl3, and the MRI contrast agent Gadobutrol, with LaCl3 as a non-paramagnetic control. They demonstrate time-resolved tracking of Gd3+ additions, monitor the acid-catalyzed conversion of ferricyanide to hexaaquairon(III), and image Gd3+-labeled liposomes attached to the diamond surface. The abstract and conclusions claim a limit of detection less than 10 attomol over a 100 µm x 100 µm field of view with 20 ms image exposure times.
Significance. If the quantitative claims are fully supported, the protocol would be a valuable addition to NV-based sensing because it is implemented on a standard fluorescence microscope with a simple MW-on/MW-off acquisition, in contrast to more demanding relaxometry pulse sequences. The paper has several concrete strengths: the LaCl3 control supports a paramagnetic origin of the contrast; the 20 ms exposure time and 87 ms per data point demonstrate fast temporal response; the liposome experiments show sub-cellular spatial mapping; and the use of a standard microscope setup is a practical advantage. However, the two headline quantitative claims — the attomole limit of detection and the 60% ferricyanide-to-FeCl3 conversion efficiency — rest on assumptions about the sensing volume and on a calibration transfer that are not validated in the manuscript. The paper explicitly states that the underlying mechanism is not yet understood, so the empirical calibration is the main evidence; that calibration needs to be more rigorously connected to the quantitative conclusions.
major comments (3)
- [Abstract, Conclusions, and Results and Discussion (Figures 3 and 5)] The claimed limit of detection of less than 10 attomol is not computed from a formal LOD procedure (e.g., 3 sigma of blank noise divided by calibration slope). The only basis given is an assumed detection volume 'extending approximately 10 nm above the surface of the diamond chip' mentioned in the Results and Discussion. This sensing depth is not measured, and because magnetic dipolar coupling drops as 1/r^3 while diffusion continually refreshes the probed volume, the effective volume cannot be taken as a fixed 10 nm slab without justification. The attomole figure depends linearly on this volume, so the manuscript must provide a measured or independently estimated sensing depth and a blank-noise-based LOD, or the claim should be revised to a concentration LOD that does not rely on an unverified volume.
- [Results and Discussion, Figure 5A] The 'conversion efficiency of 60% ferricyanide to FeCl3' is derived by reading the observed contrast change off the FeCl3 calibration curve. The reacting mixture, however, contains ferricyanide, ferrocyanide, hexaaquairon(III), and HCN in concentrated HCl at 95 deg C, with ionic strength, pH, chloride complexation, and optical absorption all different from the calibration solutions. The LaCl3 control rules out a purely ionic-strength explanation for the contrast, but it does not establish that the FeCl3 calibration is transferable to the reaction matrix. An independent assay of the conversion (e.g., UV-vis quantification of ferricyanide/ferrocyanide or iron determination) is needed to support the 60% figure; without it, the kinetic study should be presented as qualitative evidence of increased paramagnetic strength rather than as a quantitative conversion efficiency.
- [Conclusions] The authors themselves state that 'Future work is aimed at elucidation of the mechanism underlying the presented concentration dependent contrast' and that charge-state dynamics 'may also factor in the contrast observed.' This mechanistic uncertainty is not by itself fatal for an empirical calibration paper, but it strengthens the need for the calibration to be shown to be specific to paramagnetic concentration rather than to any concentration-dependent surface or charge-state effect. In particular, the paper should demonstrate that the contrast is reversible upon washing, show that the calibration is stable over time, and report whether the same calibration holds for different ionic strengths or pH values; otherwise the extrapolation from the three exemplar salts to 'paramagnetic species in living systems' is premature.
minor comments (5)
- [Results and Discussion, Figure 5 paragraph] The phrase 'This result is consummate with' should read 'This result is commensurate with'.
- [Abstract and Results and Discussion (Figure 4)] The paper states '20 ms exposure times' for each image, but the temporal resolution per data point is 87 ms (two 20 ms images plus a 23.5 ms switching time). The abstract should clarify whether '20 ms' refers to the camera exposure per frame or to the achievable sampling interval, to avoid overstating the temporal resolution.
- [Materials and Methods, NV based sensing] The calibration procedure is described only as 'datasets consisting of 100 pairs of images', but no details are given about whether the 100 pairs are acquired from the same field of view, how many independent replicate spots are used, or how errors are propagated to the normalized contrast. Error bars should be shown in Figures 3 and 5, and the number of independent replicates should be stated.
- [Figure 6 caption] The caption labels panels (A) and (B) as PL contrast images and (C) and (D) as DIC images; however, the text in the Results refers to 'Figure 6a and 6c' for the Gd-labelled liposome pair. Please verify that the panel labels in the text and caption are consistent.
- [Conclusions] The statement that the method is demonstrated 'in living systems' is stronger than what is shown: the experiments use liposomes as cell models, not living cells. The wording should be adjusted to 'cell models' or 'synthetic lipid membranes'.
Circularity Check
No significant circularity found.
full rationale
I walked the claimed derivation chain: PL contrast (MW-on/MW-off ratio, normalized to deionized water) is measured as a function of concentration for Gd(NO3)3, FeCl3, LaCl3, and Gadobutrol to produce calibration curves (Figure 3). The paper then uses these curves to interpret the ferricyanide decomposition kinetics and to quote an attomole limit of detection for Gadobutrol. No step here is circular by construction. The 60% ferricyanide-to-FeCl3 conversion figure is read off the FeCl3 calibration curve, which is ordinary interpolation from a measured standard, not a fitted parameter masquerading as a prediction. The attomole LOD does rely on an assumed detection volume extending approximately 10 nm above the diamond surface, but this is an unverified physical assumption with stated uncertainty, not a parameter fitted from the same data and then renamed as a prediction. The paper explicitly defers mechanistic understanding ('Future work is aimed at elucidation of the mechanism underlying the presented concentration dependent contrast'), and it discusses charge-state dynamics as an alternative contributor; acknowledging an unknown mechanism is the opposite of hiding a definitional identity. The LaCl3 control provides an external check that the effect tracks paramagnetism rather than ionic strength, and the cited prior NV-sensing work (including T1 relaxometry and coupled charge/spin dynamics studies) is used as context and mechanism hypothesis, not as a load-bearing self-citation chain. I found no self-definitional reduction, no fitted input called a prediction, no uniqueness theorem imported from the authors' own prior work, and no ansatz smuggled in via citation. The central claims are empirical demonstrations with calibration-based quantification; any concerns about the 10 nm sensing-depth assumption or the absence of an independent chemical assay for the conversion efficiency are correctness/validity risks, not circularity.
Assumptions & free parameters
assumptions (4)
- domain assumption NV ensemble PL response to paramagnetic species is dominated by paramagnetic spin and charge effects rather than non-magnetic solution properties.
- domain assumption The detection volume for quantitative sensitivity is approximately the volume within 10 nm of the diamond surface over the field of view.
- domain assumption The FeCl3 calibration curve can be applied to infer conversion efficiency in the ferricyanide decomposition reaction mixture.
- standard math Standard physics of NV centers including spin-dependent photoluminescence and optically detected magnetic resonance is assumed.
Cite this review
Pith. "Pith review of Dynamic quantum sensing of paramagnetic species using nitrogen-vacancy centers in diamond." pith.science (2026). https://pith.science/paper/W3HWD33D
@misc{pith2026190808108,
  author       = {Pith},
  title        = {Pith review of: Dynamic quantum sensing of paramagnetic species using nitrogen-vacancy centers in diamond},
  year         = {2026},
  howpublished = {\url{https://pith.science/paper/W3HWD33D}},
  note         = {Machine review of arXiv:1908.08108}
}
read the original abstract
Naturally occurring paramagnetic species (PS), such as free radicals and paramagnetic metalloproteins, play an essential role in a multitude of critical physiological processes including metabolism, cell signaling and immune response. These highly dynamic species can also act as intrinsic biomarkers for a variety of disease states whilst synthetic para-magnetic probes targeted to specific sites on biomolecules enable the study of functional information such as tissue oxygenation and redox status in living systems. The work presented herein describes a new sensing method that exploits the spin dependent emission of photoluminescence (PL) from an ensemble of nitrogen vacancy centers in diamond for rapid, non-destructive detection of PS in living systems. Uniquely this approach involves simple measurement protocols that assess PL contrast with and without the application of microwaves. The method is demonstrated to detect concentrations of paramagnetic salts in solution and the widely used magnetic resonance imaging contrast agent Gadobutrol with a limit of detection of less than 10 attomol over a 100 micron x 100 micron field of view. Real time monitoring of changes in the concentration of paramagnetic salts is demonstrated with image exposure times of 20 ms. Further, dynamic tracking of chemical reactions is demonstrated via the conversion of low spin cyanide coordinated Fe3+ to hexaaqua Fe3+ under acidic conditions. Finally, the capability to map paramagnetic species in model cells with sub-cellular resolution is demonstrated using lipid membranes containing gadolinium labelled phospholipids under ambient conditions in the order of minutes. Overall, this work introduces a new sensing approach for the realization of fast, sensitive imaging of PS in a widefield format that is readily deployable in biomedical settings.
Figures


Figures from the paper (3 more)


Reference graph
Works this paper leans on
-
[1]
Ahmad, W., Ijaz, B., Shabbiri, K., Ahmed, F. & Rehman, S. Oxidative toxicity in diabetes and Alzheimer’s disease: Mechanisms behind ROS/ RNS generation. J. Biomed. Sci. 24, 1–10 (2017)
work page 2017
-
[2]
Umeno, A., Biju, V. & Yoshida, Y. In vivo ROS production and use of oxidative stress -derived biomarkers to detect the onset of diseases such as Alzheimer’s disease, Parkinson’s disease, and diabetes. Free Radic. Res. 51, 413–427 (2017)
work page 2017
-
[3]
Thomas, D. D. Br eathing new life into nitric oxide signaling: A brief overview of the interplay between oxygen and nitric oxide. Redox Biol. 5, 225–233 (2015)
work page 2015
-
[4]
Griendling, K. K. et al. Measurement of Reactive Oxygen Species, Reactive Nitrogen Species, and Redox-Dependent Signaling in the Cardiovascular System: A Scientific Statement from the American Heart Association . Circulation Research 119, (2016)
work page 2016
-
[5]
Nitric oxide synthase in innate and adaptive immunity: An update
Bogdan, C. Nitric oxide synthase in innate and adaptive immunity: An update. Trends Immunol. 36, 161–178 (2015)
work page 2015
-
[6]
Diebold, L. & Chandel, N. S. Mitochondrial ROS regulation of proliferating cells. Free Radic. Biol. Med. 100, 86–93 (2016)
work page 2016
- [7]
-
[8]
Crossgrove, J. & Zheng, W. Manganese toxicity upon overexposure. NMR Biomed. 17, 544 –553 (2004)
work page 2004
Show all 55 references
-
[9]
Erikson, K. M. & Aschner, M. Manganese neurotoxicity and glutamate -GABA interaction. Neurochem. Int. 43, 475–480 (2003)
2003
-
[10]
R., Schneider, J
Aschner, M., Guilarte, T. R., Schneider, J. S. & Zheng, W. Manganese: Recent Advances in Understanding its Transport and Neurotoxicity. Toxicol Appl Pharmacol. 221, 131–147 (2007)
2007
-
[11]
Carpenter, A. W. & Schoenfisch, M. H. Nitric oxide release: Part II. Therapeutic applications. Chem. Soc. Rev. 41, 3742–3752 (2012)
2012
-
[12]
M., Lovett, J
Haugland, M. M., Lovett, J. E. & Anderson, E. A. Advances in the synthesis of nitroxide radicals for use in biomolecule spin labelling. Chem. Soc. Rev. 47, 668–680 (2018)
2018
-
[13]
Sahu, I. D. et al. DEER EPR measurements for membrane protein structures via bifunctional spin labels and lipodisq nanoparticles. Biochemistry 52, 6627–6632 (2013)
2013
-
[14]
A., MacKinnon, R
Endeward, B., Butterwick, J. A., MacKinnon, R. & Prisner, T. F. Pulsed electron-electron double- resonance determination of spin-label distances and orientations on the tetrameric potassium ion channel KcsA. J. Am. Chem. Soc. 131, 15246– 15250 (2009)
2009
-
[15]
& Bleicken, S
Bordignon, E. & Bleicken, S. New limits of sensitivity of site-directed spin labeling electron paramagnetic resonance for membrane proteins. Biochim. Biophys. Acta - Biomembr. 1860, 841–853 (2018)
2018
-
[16]
Klare, J. P. Biomedical applications of electron paramagnetic resonance (EPR) spectroscopy. Biomed. Spectrosc. Imaging 1, 101–124 (2012)
2012
-
[17]
Gomez-Mejiba, S. E. et al. Immuno-spin trapping from biochemistry to medicine: Advances, challenges, and pitfalls. Focus on protein-centered radicals. Biochim. Biophys. Acta - Gen. Subj. 1840, 722–729 (2014)
2014
-
[18]
Towner, R. A. & Smith, N. In Vivo and In Si tu Detection of Macromolecular Free Radicals Using Immuno -Spin Trapping and Molecular Magnetic Resonance Imaging . Antioxid. Redox Signal. 28, 1404–1415 (2017)
2017
-
[19]
Hayyan, M., Hashim, M. A. & Alnashef, I. M. Superoxide Ion: Generation and Chemical Implications. Chem. Rev. 116, 3029–3085 (2016)
2016
-
[20]
& Wan, A
Li, H. & Wan, A. Fluorescent probes for real - time measurement of nitric oxide in living cells. Analyst 140, 7129–7141 (2015)
2015
-
[21]
Coneski, P. N. & Schoenfisch, M. H. Nitric oxide release: Part III. Measurement a nd reporting. Chem. Soc. Rev. 41, 3753–3758 (2012)
2012
-
[22]
Rugar, D., Budakian, R., Mamin, H. J. & Chui, B. W. Single spin detection by magnetic resonance force microscopy. Nature 430, (2004)
2004
-
[23]
Greenberg, Y. S. Application of superconducting quantum interf erence devices to nuclear magnetic resonance. Rev. Mod. Phys. 70, 175–222 (1998)
1998
-
[24]
Winterbourn, C. C. The challenges of using fluorescent probes to detect and quantify specific reactive oxygen species in living cells. Biochim. Biophys. Acta - Gen. Subj. 1840, 730–738 (2014)
2014
-
[25]
Subramanian, S. et al. Reporting of quantitative oxygen mapping in EPR imaging. J. Magn. Reson. 214, 244–251 (2012)
2012
-
[26]
J., Zweier, J
Ellis, S. J., Zweier, J. L., Kuppusamy, P., Spencer, R. G. S. & Petersen, E. F. EPR oxygen mapping (EPROM) o f engineered cartilage grown in a hollow-fiber bioreactor. Magn. Reson. Med. 46, 819–826 (2001)
2001
-
[27]
Balasubramanian, G., Lazariev, A., Arumugam, S. R. & Duan, D. wen. Nitrogen -Vacancy color center in diamond -emerging nanoscale applications in bioimaging and biosensing. Curr. Opin. Chem. Biol. 20, 69–77 (2014)
2014
-
[28]
Chang, B. M. et al. Highly fluorescent nanodiamonds protein -functionalized for cell labeling and targeting. Adv. Funct. Mater. 23, 5737–5745 (2013)
2013
-
[29]
Liu, W. et al. Fluorescent Nanodiamond -Gold Hybrid Particles for Multimodal Optical and Electron Microscopy Cellular Imaging. Nano Lett. 16, 6236–6244 (2016)
2016
-
[30]
Yu, S., Kang, M., Chang, H., Chen, K. & Yu, Y. Bright Fluorescent Nanodiamonds: No Photobleaching and Low Cytotoxicity. J. AM. CHEM. SOC. 127, 17604–17605 (2005)
2005
-
[31]
Müller, C. et al. Nuclear magnetic resonance spectroscopy with single spin sensitivity. Nat. Commun. 5, 1–2 (2014)
2014
-
[32]
Maze, J. R. et al. Nanoscale magnetic sensing with an individual electronic spin in diamond. Nature 455, 644–647 (2008)
2008
-
[33]
Balasubramanian, G. et al. Nanoscale imaging magnetometry with diamond spins under ambient conditions. Nature 455, 648–651 (2008)
2008
-
[34]
Le Sage, D. et al. Optical magnetic imaging of living cells. Nature 496, 486–489 (2013)
2013
-
[35]
Glenn, D. R. et al. Single-cell magnetic imaging using a quantum diamond microscope. Nat. Methods 12, 736–738 (2015)
2015
-
[36]
Dolde, F. et al. Electric-field sensing using single diamond spins. Nat. Phys. 7, 459–463 (2011)
2011
-
[37]
Hsiao, W. W. W., Hui, Y. Y., Tsai, P. C. & Chang, H. C. Fluorescent Nanodiamond: A Versatile Tool for Long -Term Cell Tracking, Super - Resolution Imaging, and Nanoscale Temperature Sensing. Acc. Chem. Res. 49, 400– 407 (2016)
2016
-
[38]
Kucsko, G. et al. Nanometre-scale thermometry in a living cell. Nature 500, 54–58 (2013)
2013
-
[39]
Levchenko, A. O. et al. Inhomogeneous broadening of optically detected magnetic resonance of the ensembles of nitrogen-vacancy centers in diamond by interstitial carbon atoms. Appl. Phys. Lett. 106, (2015)
2015
-
[40]
Meesala, S. et al. Enhanced Strain Coupling of Nitrogen-Vacancy Spins to Nanoscale Diamond Cantilevers. Phys. Rev. Appl. 5, 1–8 (2016)
2016
-
[41]
Rendler, T. et al. Optical imaging of localized chemical events using programmable diamond quantum nanosensors. Nat. Commun. 8, (2017)
2017
-
[42]
Steinert, S. et al. Magnetic spin imaging under ambient conditions with sub-cellular resolution. Nat. Commun. 4, (2013)
2013
-
[43]
Ermakova, A. et al. Detection of a few metallo - protein molecules using color centers in nanodiamonds. Nano Lett. 13, 3305–3309 (2013)
2013
-
[44]
C., Götz, N
Ziem, F. C., Götz, N. S., Zappe, A., Steinert, S. & Wrachtrup, J. Highly sensitive detection of physiological spins in a microfluidic device. Nano Lett. 13, 4093–4098 (2013)
2013
-
[45]
Chu, Y. et al. Coherent optical transitions in implanted nitrogen vacancy centers. Nano Lett. 14, 1982–1986 (2014)
2014
-
[46]
Kosman, D. J. Redox cycling in iron uptake, efflux, and trafficking. J. Biol. Chem. 285, 26729– 26735 (2010)
2010
-
[47]
Tamarat, P. et al. Spin-flip and spin -conserving optical transitions of the ni trogen-vacancy centre in diamond. New J. Phys. 10, (2008)
2008
-
[48]
Sherry, A. D. & Wu, Y. The importance of water exchange rates in the design of responsive agents for MRI. Curr. Opin. Chem. Biol. 17, 167– 174 (2013)
2013
-
[49]
Yazyev, O. V. & Helm, L. Gadolinium (III) ion in liquid water: Structure, dynamics, and magnetic interactions from first principles. J. Chem. Phys. 127, (2007)
2007
-
[50]
V., Helm, L., Malkin, V
Yazyev, O. V., Helm, L., Malkin, V. G. & Malkina, O. L. Quantum chemical investigation of hyperfine coupling constants on first coordination sphere water molecule of gadolinium(III) aqua complexes. J. Phys. Chem. A 109, 10997–11005 (2005)
2005
-
[51]
ChemInform Abstract: Second Coordination Sphere Water Molecules and Relaxivity of Gadolinium(III) Complexes: Implications for MRI Co ntrast Agents
Botta, M. ChemInform Abstract: Second Coordination Sphere Water Molecules and Relaxivity of Gadolinium(III) Complexes: Implications for MRI Co ntrast Agents. ChemInform 31, no-no (2010)
2010
-
[52]
L., García, B
Domingo, P. L., García, B. & Leal, J. M. Acid–base behaviour of the ferricyanide ion in perchloric acid media. Spectrophotometric and kinetic study. Can. J. Chem. 68, 228–235 (2006)
2006
-
[53]
Gorrini, F. et al. Fast and Sensitive Detection of Paramagnetic Species Using Coupled Charge and Spin Dynamics in Strongly Fluorescent Nanodiamonds. ACS Appl. Mater. Interfaces 11, 24412–24422 (2019)
2019
-
[54]
& Bifone, A
Giri, R., Dorigoni, C., Tambalo, S., Gorrini, F. & Bifone, A. Selecti ve measurement of charge dynamics in an ensemble of nitrogen -vacancy centers in nanodiamond and bulk diamond. Phys. Rev. B 99, 155426 (2019)
2019
-
[55]
Giri, R. et al. Coupled charge and spin dynamics in high -density ensembles of nitrogen -vacancy centers in diamond. Phys. Rev. B 98, 1–7 (2018). 9 FIGURES Figure 1: Schematic of experimental set up showing diamond plate on microscope coverslip within custom made PCB with wire...
2018
Reviewed August 14, 2026 · model on record in the stance chip above.
Discussion (0). Continue with ORCID to comment.