REVIEW 3 major objections 3 minor 33 references
Solar H-alpha features with hot onsets. IV. Network fibrils
T0 review · 3 major / 3 minor · reviewed 2026-08-14 · deepseek-v4-flash
Pith's one-line read Many dark H-alpha fibrils spreading from network regions are cooling contrails left by rapid type II spicule heating events, according to statistical time-delay analysis of the H-alpha chromosphere.
desk verdict A serious, data-rich case for the contrail-fibril idea that stops short of proof because the statistics lack any null control for recurrent co-location. read the letter →
The pith
A machine-rendered reading of the paper's core claim, the machinery that carries it, and where it could break.
The reading
What carries the argument
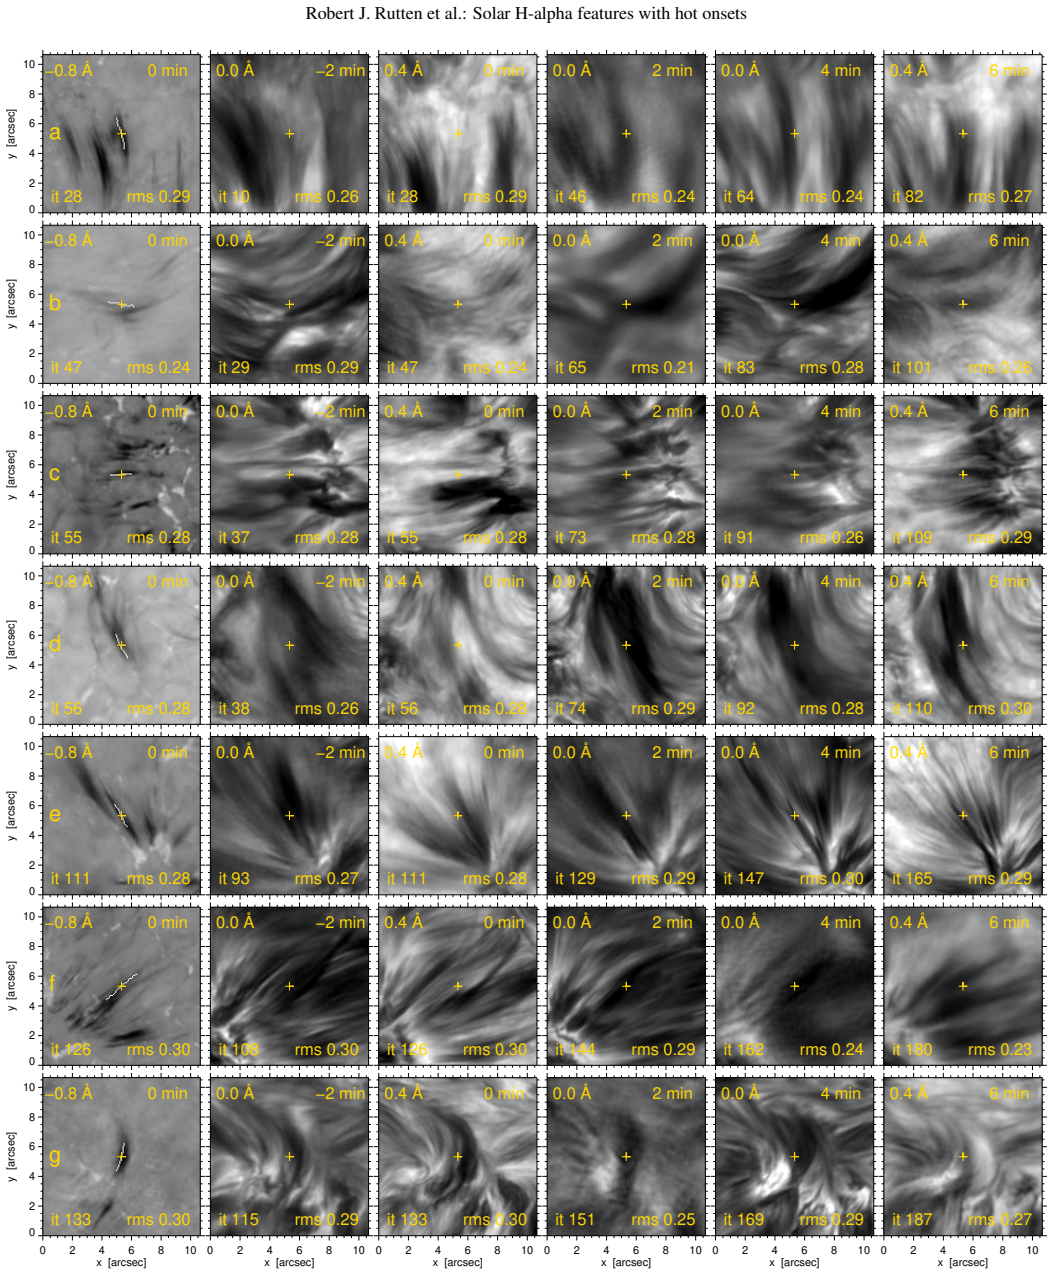
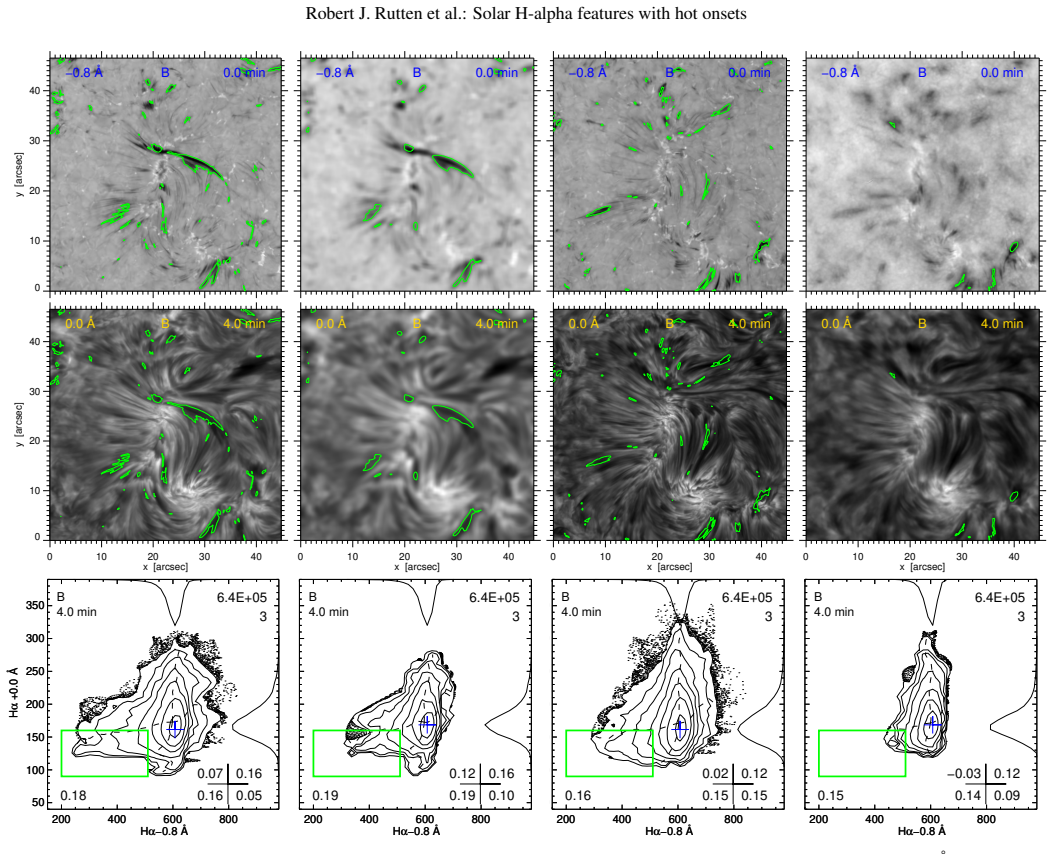
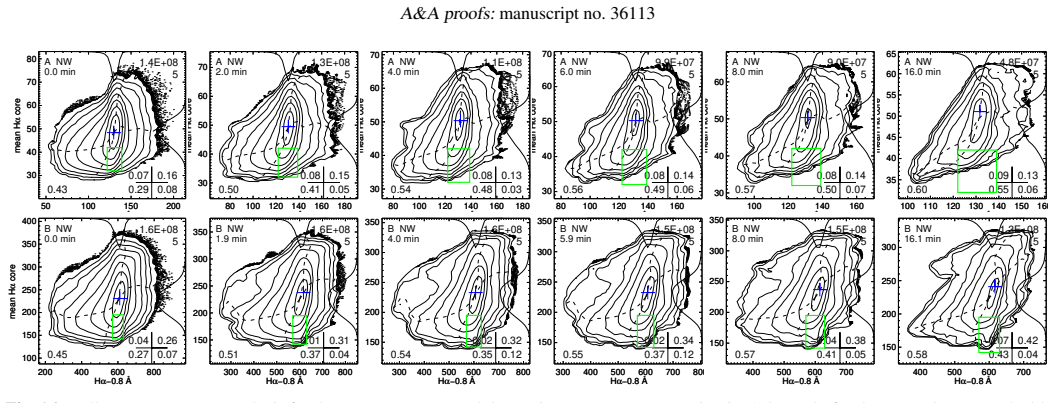
The load-bearing mechanism is intermittent hydrogen ionization followed by delayed non-equilibrium H-alpha overopacity: a brief heating event, such as an RBE or RRE type II spicule or a smaller unresolved agent, ionizes hydrogen along a thin track, and as the gas cools the $n=2$ population controlling H-alpha extinction decays slowly because collisional detailed balance in Ly-alpha is slow at low temperature, so the track stays dark for minutes. The statistical instrument is the time-delay scatter analysis in Strous format, which compares blue-wing RBE darkening with line-core and red-core darkening at delays from 0 to 12 minutes; it is supplemented by darkest-pixel composite images and per-pixel delay histograms that isolate the 2 to 5 minute positive-delay peak and the recurrence of darkest RBE instances in 3 to 5 minute groups.
What would settle it
Take the darkest-pixel delay maps and shuffle the RBE occurrence times per pixel while keeping the same spatial mask; if the 2 to 5 minute positive-delay peak survives the shuffle at the same strength, the dark-dark association is not causal. A direct spatial test is also decisive: the delayed dark fibrils should lie along the continuation of the RBE track and retract toward the network root, so darkening at RBE pixels with no track-aligned extension, or appearing simultaneously with the RBE, would argue against the contrail interpretation.
Extended reading notes
Core claim
The central discovery claim is that the dark H-alpha fibrils around network are, to a large extent, the cooling aftermath of type II spicules, rapid, short-lived chromospheric jets seen on the disk as rapid blue-shifted and red-shifted excursions (RBEs and RREs), and of similar but smaller unresolved heating agents. Along a spicule track, hydrogen is heated and partially or fully ionized; when the gas cools, recombination together with slow collisional settling in the Ly-alpha line leaves the $n=2$ level of hydrogen overpopulated for minutes, producing a strong non-equilibrium increase in H-alpha extinction. That opacity excess makes the cooling track appear as a dark fibril, the chromospheric analogue of an airplane contrail. The evidence is statistical: in time-delay scatter diagrams, darkest-pixel maps, and delay histograms from two high-resolution H-alpha sequences, the darkest blue-wing RBE moments at a pixel are preferentially followed within 2 to 5 minutes by the darkest line-core or red-core darkening at that pixel, and the same locations build up dark-dark association in time-averaged images. On this basis the paper concludes that type II spicules represent a major agent in the production of dark fibrils around network.
Load-bearing premise
The delayed 2 to 5 minute darkening at RBE locations is caused by the RBE heating event itself, rather than by independent recurrent events that happen to occupy the same network pixels.
Editorial extensions
If this is right
- If the claim is right, a large share of the slender dark fibrils around network are chronologically ordered traces of recent heating: a spicule launch first, a dark fibril minutes later, often retracting toward the network root.
- Because RBEs live only about half a minute while their dark aftermaths persist for minutes, many more dark fibrils than spicules will be visible at any instant, resolving the apparent mismatch between sparse RBE detections and dense fibril scenes.
- H-alpha fibril darkness becomes a history diagnostic rather than a temperature diagnostic: it records gas that was recently hot enough to ionize hydrogen, so modeling network fibrils requires time-dependent non-equilibrium hydrogen opacity and the local Ly-alpha radiation environment.
- The chromosphere around network would have to be understood as a three-dimensional, time-dependent, intermittently heated domain rather than a slowly varying plane-parallel layer, with much of the heating occurring below current resolution.
- The same delayed-opacity argument could extend to other H-alpha features such as Ellerman bombs, surges, filaments, and prominences, as the paper suggests.
Reading between the lines
- If the causal chain holds, the dark fibril itself could be used as a high-cadence detector of prior heating history, with its darkness and decay time constraining the peak temperature and ionization fraction of the spicule that produced it.
- A forward-modeling test would close the loop: simulate a single RBE track with time-dependent hydrogen kinetics, synthesize the H-alpha spectrum, and check whether a dark fibril appears 2 to 5 minutes later with the observed orientation and retraction.
- The same time-delay statistics applied to diagnostics without Ly-alpha-controlled opacity, such as Ca ii 8542 Å or millimeter continua, could test whether the delayed darkening is specific to H-alpha's non-equilibrium mechanism or shared by other lines.
- If the contrail interpretation survives, tracking the apparent motion and decay of dark fibrils could map the full trajectories and recurrence statistics of type II spicules more completely than the short-lived blue-wing detections, potentially informing coronal mass and energy budgets.
Signed reviews
Editorial analysis
A structured set of objections, weighed in public.
Referee Report
Summary. The paper analyzes two high-resolution SST/CRISP H-alpha image sequences of quiet-Sun network bordering a coronal hole, building on the earlier RBE/RRE catalogs of Rouppe van der Voort et al. (2009) and the single-event case of Rutten & Rouppe van der Voort (2017). It uses time-delay scatter diagrams, RBE-aligned stacked cutouts, darkest-pixel maps, delay histograms, and time-averaged comparisons to search for statistical associations between blue-wing RBE/RRE darkenings and dark H-alpha core or red-core features appearing a few minutes later. The authors interpret the resulting 2–5 min dark-dark associations as cooling, recombining gas outlining the tracks of intermittent type II spicule heating events, and conclude that type II spicules are a major agent in producing dark fibrils around network. The analysis is purely observational and correlation-based; no model is fitted and no machine-checked proofs or code are claimed, though the IDL tools and SHOWEX browser are referenced.
Significance. If the causal association is established, the paper would significantly change the standard picture of H-alpha network fibrils by identifying them as classifiable aftermaths of small-scale heating events, and it would strengthen the case that nonequilibrium hydrogen opacity, rather than static temperature structure, controls H-alpha fibril visibility. The paper has notable strengths: it reuses an independently defined RBE skeleton list, presents two complementary datasets, includes a resolution-degradation control (Fig. 7), separates network from internetwork areas (Fig. 10), and makes a specific, falsifiable prediction about the delay between wing and core darkening. However, the central claim currently rests on visual inspection of scatter contours and histograms without a statistical null model, so the significance of the result is conditional on additional controls.
major comments (3)
- [Section 5; Figs. 12–14] The central claim that the 2–5 min delayed H-alpha core darkening at RBE locations is caused by the preceding RBE heating event is not yet established because the delay statistics are never compared with a null model. Section 4 itself notes that RBEs recur every ~84 s at fixed network locations and that dynamic fibrils and RREs occupy the same pixels; under an independence-with-co-location null, a pixel with several recurrent events will have its deepest wing and deepest core events separated by an interval drawn from the event-rate distribution, and the [−2,+2] min exclusion gap biases the nearest allowed separation toward exactly the +2–5 min range emphasized in Fig. 14. The 26%/19% fill fractions and the 43%/27% "directly associated" percentages in Sect. 5 therefore do not demonstrate an excess over chance. I request a permutation or time-shift control, for example randomizing event times at fixed pixels or correlating darkest core maps with darkest wing maps shifted by a large fixed offset, with the resulting null distributions reported.
- [Figs. 9, 10, 12; Sect. 3] The "darkest value per pixel" constructs are affected by a common-seeing selection that is not controlled. The authors state that selecting the darkest value sequence-wide implies selecting moments of good seeing for both the wing and the core samples; because seeing quality varies on timescales comparable to the delays, two independent darkenings at the same pixel could both be selected preferentially on good-seeing frames and produce a spurious 2–5 min association even in the absence of a physical link. The resolution-degradation test in Fig. 7 addresses instantaneous scatter spurs, but not the sequence-wide extremal selection used in Figs. 9–12. Please add a control using seeing-matched random time pairs or restrict the extremal analysis to a fixed good-seeing subset.
- [Sect. 5; Figs. 8–11] The term "highly significant" is used repeatedly for the dark-dark spurs, but the paper provides no statistical significance measure. The Pearson and quadrant correlation coefficients are descriptive, and the Strous-format contours are binned densities without uncertainties. Given the strong spatial and temporal autocorrelation of the data, the apparent significance of the spurs cannot be judged visually. At minimum, the authors should report bootstrap confidence intervals on the quadrant coefficients or compare the spur strengths against the same quantities computed from time-shifted image pairs.
minor comments (3)
- [Abstract and throughout] The word "fibrilar" appears throughout; the standard spelling is "fibrillar." This should be corrected in the abstract, text, and figure captions.
- [Fig. 14] The y-axis label "px/bin" in the lower histograms is ambiguous; the caption defines the axis as a fraction of the network area, so the label should read "pixels per bin as fraction of network area" or similar.
- [Sect. 5] The sentence containing "mean RBE recurrence time of of 84 s" contains a duplicated "of" and should be corrected.
Circularity Check
The 2–5 min delay peak used to prove RBE-to-fibril causality is partly an artifact of the extreme-value selection and the ±2 min exclusion gap.
-
other
[Section 3, Figs. 12–14 (delay-histogram construction and interpretation)]
"We excluded delays within the [−2, +2] min range because Fig. 13 shows that many RBEs have dark cores that would contribute same-feature sampling with self-correlation. The histograms show systematic patterns that differ strongly from a horizontal distribution for no association. Both panels show a peak to the right of the gap that implies a high probability that the core reached its darkest value a few minutes after the darkest RBE."
The histogram peak is produced by the operational definition, not measured as a causal delay. The delay is the difference between each pixel's sequence-wide darkest blue-wing time and its darkest core time, with all delays inside [−2,+2] min discarded. Under the appropriate no-association null of independent occurrence times, the two extreme times are each approximately uniform over the observing window, so the conditional density of D = T_core − T_wing given |D|>2 is proportional to T−|D|, with its maximum exactly at |D| = 2 min and a symmetric linear decay. That is precisely the 'peak to the right of the gap' and 'decays reach symmetry beyond six minutes' reported by the paper.
full rationale
This is not a globally circular paper: RBE identification comes from the independent Pub A skeleton list, the nonequilibrium-overopacity interpretation is imported from external simulations (Carlsson & Stein 2002; Leenaarts et al. 2007), and no model parameters are fitted to the data. The central causal claim, however, leans heavily on the delay histograms in Fig. 14, which are built by selecting per-pixel sequence-wide extremes and then discarding delays within ±2 min. The resulting histogram shape—peaks immediately outside the gap and symmetric decay beyond ~6 min—is the shape imposed by the extreme-value-plus-gap construction under a null of independent event times. The paper compares this against a 'horizontal' no-association distribution and reads the gap-adjacent peak as evidence that the darkest core follows the darkest RBE by 2–5 min. That inference is partially circular: the peak location is forced by the selection procedure. Fixed-lag scatter spurs, case examples, and time-averaged maps retain some independent evidentiary content, so the circularity is partial rather than total; the score is 6.
Assumptions & free parameters
free parameters (3)
- Seeing quality thresholds =
25% (data A), 33% (data B) worst images discarded
- Delay window for aftermath sampling =
2 to 5 min positive delay
- Network versus internetwork mask thresholds =
Brightness threshold on a 200-pixel boxcar-smoothed time-averaged image at +0.4 Å
assumptions (3)
- domain assumption RBEs in the outer blue wing of H-alpha are on-disk manifestations of type II spicules.
- domain assumption H-alpha extinction is set by the n=2 population with strong temperature dependence and nonequilibrium overopacity in cooling gas, as in the simulations of Carlsson & Stein (2002) and Leenaarts et al. (2007).
- domain assumption The temporal correlation between darkest wing and darkest core pixels reflects causal links rather than spatial co-location of recurrent independent features.
Cite this review
Pith. "Pith review of Solar H-alpha features with hot onsets. IV. Network fibrils." pith.science (2026). https://pith.science/paper/W7PWFHDE
@misc{pith2026190809315,
  author       = {Pith},
  title        = {Pith review of: Solar H-alpha features with hot onsets. IV. Network fibrils},
  year         = {2026},
  howpublished = {\url{https://pith.science/paper/W7PWFHDE}},
  note         = {Machine review of arXiv:1908.09315}
}
read the original abstract
Even in quiet areas underneath coronal holes the solar chromosphere contains ubiquitous heating events. They tend to be small scale and short lived, hence difficult to identify. Here we do not address their much-debated contribution to outer-atmosphere heating, but their aftermaths. We performed a statistical analysis of high-resolution observations in the Balmer H-alpha line to suggest that many slender dark H-alpha fibrils spreading out from network represent cooling gas that outlines tracks of preceding rapid type II spicule events or smaller similar but as yet unresolved heating agents in which the main gas constituent, hydrogen, ionizes at least partially. Subsequent recombination then causes dark H-alpha fibrils enhanced by nonequilibrium overopacity. We suggest that the extraordinary fibrilar appearance of the H-alpha chromosphere around network results from intermittent, frequent small-scale prior heating.
Figures


Figures from the paper (11 more)




Reference graph
Works this paper leans on
-
[1]
Antolin, P., Schmit, D., Pereira, T. M. D., De Pontieu, B., & De Moortel, I. 2018, ApJ, 856, 44 ADS
work page 2018
-
[2]
Avrett, E. H. & Loeser, R. 2008, ApJS, 175, 229 ADS
work page 2008
-
[3]
Bray, R. J. & Loughhead, R. E. 1974, The solar chromosphere, ed. R. J. Bray & R. E. Loughhead ADS
work page 1974
-
[4]
Carlsson, M., Hansteen, V . H., Gudiksen, B. V ., Leenaarts, J., & De Pontieu, B. 2016, A&A, 585, A4 ADS
work page 2016
- [5]
- [6]
-
[7]
2018, ApJ, 857, 73 ADS De Pontieu, B., De Moortel, I., Martínez-Sykora, J., & McIntosh, S
Chintzoglou, G., De Pontieu, B., Martínez-Sykora, J., et al. 2018, ApJ, 857, 73 ADS De Pontieu, B., De Moortel, I., Martínez-Sykora, J., & McIntosh, S. W. 2017, ApJL, 845, L18 ADS De Pontieu, B., Hansteen, V . H., Rouppe van der V oort, L., van Noort, M., &
work page 2018
-
[8]
2007a, ApJ, 655, 624 ADS De Pontieu, B., McIntosh, S., Hansteen, V
Carlsson, M. 2007a, ApJ, 655, 624 ADS De Pontieu, B., McIntosh, S., Hansteen, V . H., et al. 2007b, PASJ, 59, S655 ADS De Pontieu, B., McIntosh, S. W., Carlsson, M., et al. 2011, Science, 331, 55 ADS
work page 2011
Show all 33 references
-
[9]
2006, ApJL, 647, L73 ADS
Carlsson, M. 2006, ApJL, 647, L73 ADS
2006
-
[10]
Henriques, V . M. J., Kuridze, D., Mathioudakis, M., & Keenan, F. P. 2016, ApJ, 820, 124 ADS
2016
-
[11]
J., Solanki, S
Jafarzadeh, S., Rutten, R. J., Solanki, S. K., et al. 2017, ApJS, 229, 11 ADS Jefferies, J. T. & Thomas, R. N. 1959, ApJ, 129, 401 ADS Langangen, Ø., De Pontieu, B., Carlsson, M., et al. 2008, ApJL, 679, L167 ADS
2017
-
[12]
Leenaarts, J., Carlsson, M., Hansteen, V ., & Rutten, R. J. 2007, A&A, 473, 625 ADS
2007
-
[13]
2012, ApJ, 749, 136 ADS
Leenaarts, J., Carlsson, M., & Rouppe van der V oort, L. 2012, ApJ, 749, 136 ADS
2012
-
[14]
2015, ApJ, 802, 136 ADS
Leenaarts, J., Carlsson, M., & Rouppe van der V oort, L. 2015, ApJ, 802, 136 ADS
2015
-
[15]
J., Reardon, K., Carlsson, M., & Hansteen, V
Leenaarts, J., Rutten, R. J., Reardon, K., Carlsson, M., & Hansteen, V . 2010, ApJ, 709, 1362 ADS
2010
-
[16]
J., Sütterlin, P., Carlsson, M., & Uitenbroek, H
Leenaarts, J., Rutten, R. J., Sütterlin, P., Carlsson, M., & Uitenbroek, H. 2006, A&A, 449, 1209 ADS
2006
-
[17]
Lockyer, J. N. 1868, Proceedings of the Royal Society of London Series I, 17, 131 ADS Martínez-Sykora, J., De Pontieu, B., De Moortel, I., Hansteen, V . H., & Carlsson, M. 2018, ApJ, 860, 116 ADS
2018
-
[18]
Pereira, T. M. D. 2019, Advances in Space Research, 63, 1434 ADS
2019
-
[19]
Pietarila, A., Hirzberger, J., Zakharov, V ., & Solanki, S. K. 2009, A&A, 502, 647 ADS Rouppe van der V oort, L., Leenaarts, J., De Pontieu, B., Carlsson, M., & Vissers, G. 2009, ApJ, 705, 272 ADS (Pub A) Rouppe van der V oort, L. H. M., De Pontieu, B., Hansteen, V . H., Carls...
2009
-
[20]
Rutten, R. J. 2006, in Astron. Soc. Pacific Conf. Series, V ol. 354, Solar MHD Theory and Observations: A High Spatial Resolution Perspective, ed. J. Leibacher, R. F. Stein, & H. Uitenbroek, 276 ADS
2006
-
[21]
Rutten, R. J. 2016, A&A, 590, A124 ADS
2016
-
[22]
Rutten, R. J. & Rouppe van der V oort, L. H. M. 2017, A&A, 597, A138 ADS (Pub B)
2017
-
[23]
Rutten, R. J. & Uitenbroek, H. 1991, SoPh, 134, 15 ADS
1991
-
[24]
Rutten, R. J. & Uitenbroek, H. 2012, A&A, 540, A86 ADS
2012
-
[25]
B., Bjelksjo, K., Korhonen, T
Scharmer, G. B., Bjelksjo, K., Korhonen, T. K., Lindberg, B., & Petterson, B. 2003, in Proc. SPIE, V ol. 4853, Innovative Telescopes and Instrumentation for Solar Astrophysics, ed. S. L. Keil & S. V . Avakyan, 341–350 ADS
2003
-
[26]
B., Narayan, G., Hillberg, T., et al
Scharmer, G. B., Narayan, G., Hillberg, T., et al. 2008, ApJL, 689, L69 ADS
2008
-
[27]
Schoolman, S. A. 1972, SoPh, 22, 344 ADS
1972
-
[28]
H., Rouppe van der V oort, L., & De Pontieu, B
Sekse, D. H., Rouppe van der V oort, L., & De Pontieu, B. 2012, ApJ, 752, 108 ADS
2012
-
[29]
2016, ApJ, 817, 124 ADS
Skogsrud, H., Rouppe van der V oort, L., & De Pontieu, B. 2016, ApJ, 817, 124 ADS
2016
-
[30]
Strous, L. H. 1994, PhD thesis, PhD Thesis, Utrecht University, (1994) ADS
1994
-
[31]
Thomas, R. N. 1957, ApJ, 125, 260 ADS
1957
-
[32]
& Rouppe van der V oort, L
Vissers, G. & Rouppe van der V oort, L. 2012, ApJ, 750, 22 ADS
2012
-
[33]
2013, ApJ, 767, 17 ADS Article number, page 19 of 19
Yurchyshyn, V ., Abramenko, V ., & Goode, P. 2013, ApJ, 767, 17 ADS Article number, page 19 of 19
2013
Reviewed August 14, 2026 · model on record in the stance chip above.
Discussion (0). Continue with ORCID to comment.