REVIEW 3 major objections 5 minor 80 references
Evidence for Inside-Out Galaxy Growth and Quenching of a z~2 Compact Galaxy from High-Resolution Molecular Gas Imaging
T0 review · 3 major / 5 minor · reviewed 2026-08-14 · deepseek-v4-flash
Pith's one-line read A massive z~2 galaxy is losing its molecular gas from the center outward, pointing to inside-out quenching.
desk verdict First resolved ground-state CO(1-0) view of a central gas deficit in a compact z~2 star-forming galaxy — a solid single-object result whose inside-out quenching narrative is plausible but still needs an AGN-contamination check in the stellar-mass map. read the letter →
The pith
A machine-rendered reading of the paper's core claim, the machinery that carries it, and where it could break.
The reading
What carries the argument
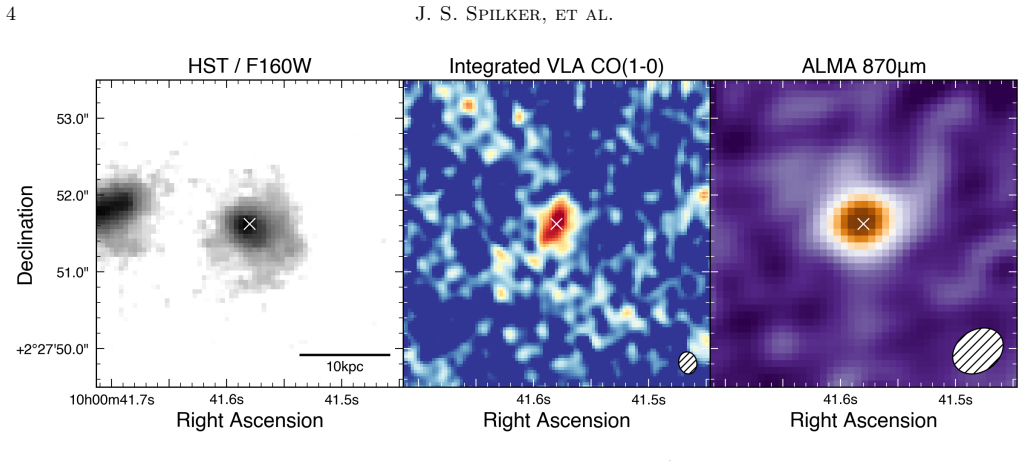
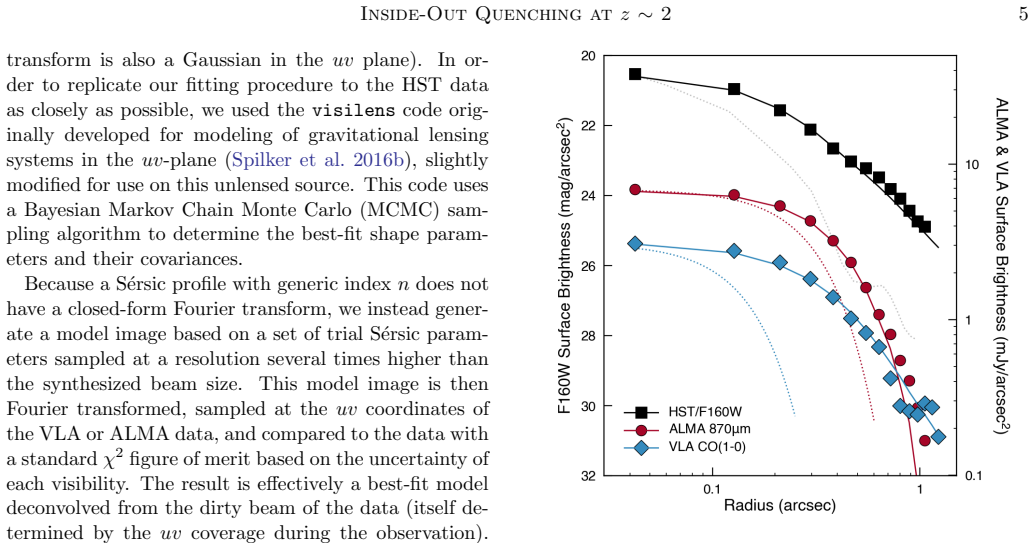
The load-bearing object is the resolved map of the CO(1–0) ground-state transition, observed with the VLA at ~0.25 arcsecond (~2 kpc) resolution and combined with lower-resolution C-array data to capture all the flux. From this map, plus HST F160W and ALMA 343 GHz imaging, the authors construct deconvolved radial surface brightness profiles of molecular gas, stellar mass, and obscured star formation, then form the ratios $f_{\mathrm{H_2}}$ and $t_{\mathrm{dep}}$. The argument's mechanism is a comparison of the shapes of these profiles: because the stellar mass is more centrally concentrated than the molecular gas, the gas fraction and depletion time are suppressed in the center, which is interpreted as imminent inside-out quenching. The analysis relies on a visibility-based Sérsic fitting method that avoids correlated uncertainties in sparsely resolved interferometric data, and on the galaxy's nearly face-on orientation, which makes the radial profiles relatively insensitive to inclination.
What would settle it
A resolved map of a second molecular gas tracer, such as CO(2–1) or [CI], together with multi-band far-infrared data to measure the dust temperature gradient, could test the conversion-factor assumptions directly; if the radial profile of the depletion time becomes flat or rises toward the center after these corrections, the inside-out quenching claim would collapse. Alternatively, detecting gas inflow or a central concentration of dense gas on the ~10–15 Myr timescale would overturn the imminence of central quenching.
Extended reading notes
Core claim
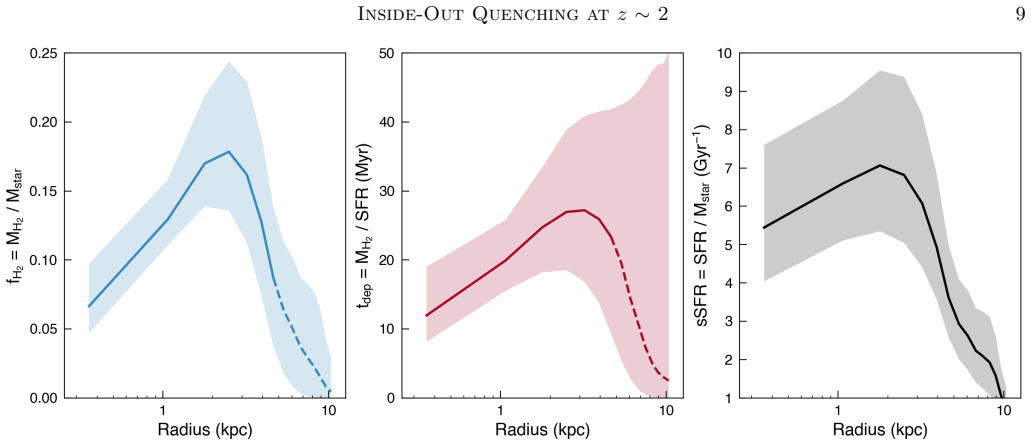
The central discovery is that the radial distribution of molecular gas in COSMOS 27289 is not a scaled copy of the stellar mass distribution. Deconvolved radial profiles of CO(1–0) emission, HST F160W light, and ALMA 343 GHz continuum show that the molecular gas is the least centrally concentrated of the three tracers: the gas fraction rises from ~0.07 in the inner 1–2 kpc to roughly twice that value at 2–4 kpc before declining, and the depletion time rises from 10–15 Myr in the center by about a factor of two at 3 kpc. The authors argue that, given the galaxy's nearly face-on orientation and the likely radial trends in dust temperature, CO-to-$\mathrm{H_2}$ conversion, and stellar mass-to-light ratio (which would all exaggerate the central suppression), this pattern implies that star formation will cease in the center before the outskirts—inside-out quenching. They further show good qualitative and reasonable quantitative agreement with a hydrodynamical simulation of a quenching galaxy, supporting the interpretation that rapid central gas consumption and outflows evacuate the core.
Load-bearing premise
The inside-out quenching forecast stands or falls on the assumptions that the conversion factors from observed light to stellar mass, molecular gas mass, and SFR do not vary radially in the opposite sense to the assumed constant values, and that no substantial gas flows into the center within the ~10–15 Myr depletion clock.
Editorial extensions
If this is right
- The galaxy's central kiloparsecs will exhaust their molecular fuel in ~10–15 Myr, so the central starburst should fade before the outer disk, producing a galaxy that looks quiescent in the center and still active outside.
- Compact star-forming galaxies like COSMOS 27289 are plausible immediate progenitors of z~2 quiescent galaxies, consistent with their low gas fractions and short depletion times.
- Radial variations in the physical conversion factors—lower central CO-to-$\mathrm{H_2}$ conversion, warmer central dust, and a centrally concentrated stellar mass-to-light ratio—would only strengthen the observed central suppression, so the inside-out signal is a conservative lower limit.
- The agreement with a hydrodynamical simulation of quenching suggests that central gas evacuation by rapid consumption and feedback is a generic feature at the end of a starburst, not an artifact unique to this object.
- Ground-state CO(1–0) imaging, rather than higher-J CO transitions, is needed to trace the full molecular reservoir; higher-J lines would emphasize dense star-forming gas and could mask the central depletion.
Reading between the lines
- If the inside-out pattern is generic among compact star-forming galaxies, then integrated depletion times measured in unresolved surveys understate how quickly their centers are already running out of fuel; resolved gas imaging may be needed to locate the true quenching front.
- The same visibility-based radial profile technique could be applied to a small sample of face-on compact SFGs at z~2 to test whether the central suppression of $t_{\mathrm{dep}}$ is universal and whether the peak radius of the gas fraction tracks galaxy size or mass.
- A direct observational test could come from a second epoch: after a rest-frame interval of ~10 Myr, a redshifted CO(1–0) or dust continuum observation might show the central surface brightness fading relative to the outskirts—a demanding but conceivable experiment.
- The face-on orientation that makes COSMOS 27289 favorable also limits the sample; for inclined systems, kinematic deprojection of CO line maps would be needed to recover radial profiles, a natural extension of the method.
Signed reviews
Editorial analysis
A structured set of objections, weighed in public.
Referee Report
Summary. The paper presents new VLA B-array CO(1-0) imaging of the z=2.234 compact star-forming galaxy COSMOS27289, combined with previously published C-array data and archival HST/WFC3 F160W and ALMA 343 GHz images. The authors extract elliptical Sersic radial profiles (GALFIT for HST, a visibility-based MCMC fitter for VLA and ALMA), deconvolve the PSF or synthesized beams, and apply a first-order residual correction following Szomoru et al. (2010). Under assumptions of a global F160W mass-to-light ratio, a single alpha_CO = 1, and a linear 270 micron-to-SFR conversion, they derive radial profiles of the molecular gas fraction f_H2 and depletion time t_dep. These profiles are lower in the central 1-2 kpc and rise at radii ~2-4 kpc, which the authors interpret as evidence for imminent inside-out quenching, the first such claim from resolved molecular gas observations at high redshift. They compare the observed f_H2 profile to the Tacchella et al. (2016) simulations and report good qualitative and semi-quantitative agreement.
Significance. If the central suppression is real, this is an important and rare direct measurement of the molecular gas distribution during the quenching of a compact high-redshift galaxy. The choice of ground-state CO(1-0) is well motivated: it is less affected by dust extinction and AGN than rest-UV or H-alpha tracers, and the difference with the higher-J CO observations of Barro et al. (2017) is clearly discussed. The technical approach is appropriate: visibility-based Sersic fitting is well suited to marginally resolved interferometric data, and the MCMC uncertainties are propagated through to the derived profiles. The central result is not circular: the radial trend is directly observed in ratioed imaging under stated conversion assumptions, and the simulation comparison is not used to calibrate the observations. The paper also systematically argues that likely radial variations in the stellar M/L, alpha_CO, and dust temperature would accentuate, not erase, the central suppression. The main caveats are the simple conversion factors, the marginal resolution of the ALMA data, and the lack of any test for a central AGN point-source contribution to the F160W light.
major comments (3)
- [Section 2.4 and Section 3.2] The F160W profile is used as the stellar mass map, but the paper does not test whether a central AGN contributes to the rest-frame ~500 nm light. COSMOS27289 is a compact SFG, a population with a high AGN incidence (Barro et al. 2013; Kocevski et al. 2017), and the X-ray nondetection does not exclude a Compton-thick AGN. If a faint unresolved source contributes to the central F160W flux, the stellar mass profile is artificially more centrally peaked, which would lower the central f_H2 and could produce or enhance the observed inside-out gradient. Because this concern directly targets the paper's main observational claim, please add a point-source + Sersic decomposition test or an equivalent color/AGN test, and quantify the allowed AGN fraction as a function of radius.
- [Section 2.3 and Figure 4] The paper does not report the best-fit Sersic parameters (index n, effective radius, axis ratio) for the CO(1-0) and ALMA fits, even though the central result is that the molecular gas and SFR profiles are less centrally concentrated than the stellar profile. The F160W fit is quoted as n = 3.1 +/- 0.1 and Re = 2.6 +/- 0.1 kpc, but no analogous constraints are given for the lower-resolution data. This matters because the relative concentrations of the three components are load-bearing for the f_H2 and t_dep profiles. Please provide the fitted parameters and covariances (or a table or posterior summary) for all three components, and state explicitly whether the VLA CO source is resolved at a statistically significant level.
- [Section 3.1 and Figure 5] The t_dep radial gradient is presented in the abstract as a primary result, but the ALMA 343 GHz data are described in Section 2.3 as only 'marginally spatially resolved' and Section 3.1 concedes that the depletion-time trend has 'significantly larger uncertainties.' The text also concludes that the t_dep gradient is weaker evidence than the f_H2 gradient. Please either report a quantitative significance (for example, the posterior probability that the central t_dep is lower than the value at 2-4 kpc) or soften the abstract and conclusions to match the actual weight of evidence provided by the data.
minor comments (5)
- [Section 3.2] The statement about M/L gradients ('galaxies that are redder in their centers than the outskirts show falling M/L') is ambiguous; please specify whether M/L falls with increasing radius and clarify how that maps to the sign convention used in the text.
- [Section 3.1] The claim that 'the peak and subsequent decline at larger radii is real' should be backed by a quantitative significance estimate or by a statement of the signal-to-noise level of the CO detection at the radii of the f_H2 peak and decline.
- [Figure 3] The color scale or color bar for the f_H2 map is not described in the text; consider adding a description of the color mapping and the masking threshold so that the figure is interpretable on its own.
- [Abstract and Section 4] The phrase 'the first time this phenomenon has been seen via observations of molecular gas in the high-redshift universe' could be softened to 'first resolved ground-state CO evidence' to avoid overclaiming, given the single-object nature of the study and the conversion-factor caveats discussed later in the paper.
- [Section 2.1] The statement that 'This binning in velocity contains approximately 99% of the emission' would be clearer if the exact velocity width and the central velocity used for the binning were restated here, since the 125 km/s width is mentioned earlier but the verification of the 99% figure is not described.
Circularity Check
No circularity: the resolved f_H2 and t_dep profiles are direct observational ratios under stated global conversion assumptions, not outputs of any fitted model or prior self-citation.
full rationale
The paper's central claim is a resolved radial trend in f_H2 = M_H2/M_star and t_dep = M_H2/SFR, built by dividing independently measured CO(1-0), F160W, and ALMA 270 micron surface-brightness profiles after applying single global conversion factors stated in Section 2.4. No parameter is fitted to force the gas fraction or depletion time to rise at ~2-4 kpc; the trend emerges from the imaging data themselves. The prior S16 measurement is used for context, source selection, and combination of the C-array and new B-array data, but the resolved central suppression is not an output of S16 and does not reduce to that earlier integrated measurement. The comparison to Tacchella et al. (2016) is external and is not used to calibrate or derive the observed profiles. Concerns about AGN contamination or radial conversion-factor gradients are physical robustness or correctness risks, not circularity, because the paper does not define its result in terms of those assumptions. No equation in the paper reduces by construction to its own input, and no fitted parameter is renamed as a prediction. The derivation is self-contained.
Assumptions & free parameters
free parameters (5)
- F160W mass-to-light ratio (global, single value) =
Normalized so total F160W flux gives Mstar = 1.3e11 Msun
- alpha_CO (CO-to-H2 conversion factor) =
1 Msun (K km/s pc2)^-1
- 270 micron-to-SFR conversion =
Linear conversion normalized to SFR = 400 Msun/yr from LIR
- F160W Sersic parameters (n, Re, ellipticity, PA) =
n = 3.1 +/- 0.1, Re = 2.6 +/- 0.1 kpc, ellipticity/PA used for all apertures
- CO and ALMA Sersic profile parameters =
MCMC posterior values (not quoted in text)
assumptions (7)
- standard math Flat LambdaCDM cosmology with H0 = 67.7 km/s/Mpc and Omega_m = 0.307 (Planck 2016)
- domain assumption CO(1-0) luminosity traces the full molecular gas reservoir with a constant alpha_CO = 1
- domain assumption WFC3/F160W light traces the stellar mass distribution with a single M/L
- domain assumption ALMA 343 GHz (rest-frame 270 micron) emission traces obscured SFR linearly
- domain assumption The galaxy is nearly face-on based on very narrow CO(1-0) and H-alpha line widths
- domain assumption Szomoru et al. (2010) residual profile correction and visibility-based Sersic fitting are reliable for marginally resolved sources
- domain assumption Krumholz (2013) molecular fraction prescription approximates the molecular gas fraction in Tacchella et al. (2016) simulations
Cite this review
Pith. "Pith review of Evidence for Inside-Out Galaxy Growth and Quenching of a z~2 Compact Galaxy from High-Resolution Molecular Gas Imaging." pith.science (2026). https://pith.science/paper/WCKFUJTL
@misc{pith2026190802294,
  author       = {Pith},
  title        = {Pith review of: Evidence for Inside-Out Galaxy Growth and Quenching of a z~2 Compact Galaxy from High-Resolution Molecular Gas Imaging},
  year         = {2026},
  howpublished = {\url{https://pith.science/paper/WCKFUJTL}},
  note         = {Machine review of arXiv:1908.02294}
}
read the original abstract
We present high spatial resolution imaging of the CO(1-0) line from the Karl G. Jansky Very Large Array (VLA) of COSMOS27289, a massive, compact star forming galaxy at z=2.234. This galaxy was selected to be structurally similar to z~2 passive galaxies. Our previous observations showed that it is very gas-poor with respect to typical star-forming galaxies at these redshifts, consistent with a rapid transition to quiescence as the molecular gas is depleted. The new data show that both the molecular gas fraction f_H2 = M_H2/M_star and the molecular gas depletion time t_dep = M_H2/SFR are lower in the central 1-2kpc of the galaxy and rise at larger radii ~2-4kpc. These observations are consistent with a scenario in which COSMOS27289 will imminently cease star formation in the inner regions before the outskirts, i.e. inside-out quenching, the first time this phenomenon has been seen via observations of molecular gas in the high-redshift universe. We find good qualitative and quantitative agreement with a hydrodynamical simulation of galaxy quenching, in which the central suppression of molecular gas arises due to rapid gas consumption and outflows that evacuate the central regions of gas. Our results provide independent evidence for inside-out quenching of star formation as a plausible formation mechanism for z~2 quiescent galaxies.
Figures

Figures from the paper (3 more)


Reference graph
Works this paper leans on
-
[1]
Aravena, M., Spilker, J. S., Bethermin, M., et al. 2016, MNRAS, 457, 4406
work page 2016
-
[2]
Barro, G., Faber, S. M., P´ erez-Gonz´ alez, P. G., et al. 2013, ApJ, 765, 104
work page 2013
- [3]
- [4]
- [5]
-
[6]
Belli, S., Newman, A. B., & Ellis, R. S. 2014, ApJ, 783, 117 —. 2019, ApJ, 874, 17
work page 2014
- [7]
-
[8]
G., Tal, T., et al
Bezanson, R., van Dokkum, P. G., Tal, T., et al. 2009, ApJ, 697, 1290
2009
Show all 80 references
-
[9]
G., van de Sand e, J., et al
Bezanson, R., van Dokkum, P. G., van de Sand e, J., et al. 2013, ApJ, 779, L21
2013
-
[10]
B., van Dokkum, P
Brammer, G. B., van Dokkum, P. G., Franx, M., et al. 2012, ApJS, 200, 13
2012
-
[11]
L., & Walter, F
Carilli, C. L., & Walter, F. 2013, ARA&A, 51, 105 Inside-Out Quenching at z ∼ 2 13
2013
-
[12]
P., Bianchi, S., et al
Casasola, V., Cassar` a, L. P., Bianchi, S., et al. 2017, A&A, 605, A18
2017
-
[13]
M., Narayanan, D., & Cooray, A
Casey, C. M., Narayanan, D., & Cooray, A. 2014, PhR, 541, 45
2014
-
[14]
C., et al
Cassata, P., Giavalisco, M., Williams, C. C., et al. 2013, ApJ, 775, 106
2013
-
[15]
2015, MNRAS, 447, 3291
Ceverino, D., Dekel, A., Tweed, D., & Primack, J. 2015, MNRAS, 447, 3291
2015
-
[16]
A., van de Voort, F., Rowlands, K., et al
Davis, T. A., van de Voort, F., Rowlands, K., et al. 2019, MNRAS, 484, 2447
2019
-
[17]
W., Hunt, L
Engelbracht, C. W., Hunt, L. K., Skibba, R. A., et al. 2010, A&A, 518, L56
2010
-
[18]
2015, MNRAS, 446, 1939
Feldmann, R., & Mayer, L. 2015, MNRAS, 446, 1939
2015
-
[19]
D., Yang, Y., Zabludoff, A., et al
French, K. D., Yang, Y., Zabludoff, A., et al. 2015, ApJ, 801, 1
2015
-
[20]
R., Leonidaki, I., Xilouris, E
Greve, T. R., Leonidaki, I., Xilouris, E. M., et al. 2014, ApJ, 794, 142
2014
-
[21]
2018, ApJ, 856, 118
Hayashi, M., Tadaki, K.-i., Kodama, T., et al. 2018, ApJ, 856, 118
2018
-
[22]
C., Wardlow, J
Hickox, R. C., Wardlow, J. L., Smail, I., et al. 2012, MNRAS, 421, 284 H¨ ogbom, J. A. 1974, A&AS, 15, 417
2012
-
[23]
J., Papadopoulos, P
Ivison, R. J., Papadopoulos, P. P., Smail, I., et al. 2011, MNRAS, 412, 1913
2011
-
[24]
J., Smail, I., Le Borgne, J.-F., et al
Ivison, R. J., Smail, I., Le Borgne, J.-F., et al. 1998, MNRAS, 298, 583
1998
-
[25]
J., Swinbank, A
Ivison, R. J., Swinbank, A. M., Smail, I., et al. 2013, ApJ, 772, 137
2013
-
[26]
C., & Evans, N
Kennicutt, R. C., & Evans, N. J. 2012, ARA&A, 50, 531
2012
-
[27]
D., Barro, G., Faber, S
Kocevski, D. D., Barro, G., Faber, S. M., et al. 2017, ApJ, 846, 112
2017
-
[28]
M., Faber, S
Koekemoer, A. M., Faber, S. M., Ferguson, H. C., et al. 2011, ApJS, 197, 36
2011
-
[29]
G., Franx, M., et al
Kriek, M., van Dokkum, P. G., Franx, M., et al. 2006, ApJL, 649, L71
2006
-
[30]
Krumholz, M. R. 2013, MNRAS, 436, 2747
2013
-
[31]
Lagos, C. d. P., Crain, R. A., Schaye, J., et al. 2015, MNRAS, 452, 3815
2015
-
[32]
2018, ApJ, 853, 131
Lee, B., Giavalisco, M., Whitaker, K., et al. 2018, ApJ, 853, 131
2018
-
[33]
K., Walter, F., Brinks, E., et al
Leroy, A. K., Walter, F., Brinks, E., et al. 2008, AJ, 136, 2782
2008
-
[34]
D., Zabludoff, A
Li, Z., French, K. D., Zabludoff, A. I., & Ho, L. C. 2019, arXiv e-prints, arXiv:1906.01890
2019 arXiv
-
[35]
2019, arXiv e-prints, arXiv:1902.10727
Liang, L., Feldmann, R., Kereˇ s, D., et al. 2019, arXiv e-prints, arXiv:1902.10727
2019 arXiv
-
[36]
F., Feldmann, R., et al
Ma, X., Hopkins, P. F., Feldmann, R., et al. 2017, MNRAS, 466, 4780
2017
-
[37]
2007, in Astronomical Society of the Pacific Conference Series, Vol
Golap, K. 2007, in Astronomical Society of the Pacific Conference Series, Vol. 376, Astronomical Data Analysis Software and Systems XVI, ed. R. A. Shaw, F. Hill, & D. J. Bell, 127
2007
-
[38]
G., Brammer, G
Momcheva, I. G., Brammer, G. B., van Dokkum, P. G., et al. 2016, ApJS, 225, 27
2016
-
[39]
H., & Ostriker, J
Naab, T., Johansson, P. H., & Ostriker, J. P. 2009, ApJL, 699, L178
2009
-
[40]
J., van Dokkum, P
Nelson, E. J., van Dokkum, P. G., F¨ orster Schreiber, N. M., et al. 2016, ApJ, 828, 27
2016
-
[41]
B., Ellis, R
Newman, A. B., Ellis, R. S., Bundy, K., & Treu, T. 2012, ApJ, 746, 162
2012
-
[42]
S., et al
Pandya, V., Brennan, R., Somerville, R. S., et al. 2017, MNRAS, 472, 2054
2017
-
[43]
Y., Ho, L
Peng, C. Y., Ho, L. C., Impey, C. D., & Rix, H.-W. 2010, AJ, 139, 2097 Planck Collaboration, Ade, P. A. R., Aghanim, N., et al. 2016, A&A, 594, A13
2010
-
[44]
Popping, G., Decarli, R., Man, A. W. S., et al. 2017, A&A, 602, A11
2017
-
[45]
2017, ApJ, 849, 27
Rudnick, G., Hodge, J., Walter, F., et al. 2017, ApJ, 849, 27
2017
-
[46]
M., Leroy, A
Sandstrom, K. M., Leroy, A. K., Walter, F., et al. 2013, ApJ, 777, 5
2013
-
[47]
T., Daddi, E., Bournaud, F., et al
Sargent, M. T., Daddi, E., Bournaud, F., et al. 2015, ApJL, 806, L20
2015
-
[48]
K., Walter, F., et al
Schruba, A., Leroy, A. K., Walter, F., et al. 2011, AJ, 142, 37
2011
-
[49]
2007, ApJS, 172, 1
Scoville, N., Aussel, H., Brusa, M., et al. 2007, ApJS, 172, 1
2007
-
[50]
2016, ApJ, 820, 83
Scoville, N., Sheth, K., Aussel, H., et al. 2016, ApJ, 820, 83
2016
-
[51]
E., Whitaker, K
Skelton, R. E., Whitaker, K. E., Momcheva, I. G., et al. 2014, ApJS, 214, 24
2014
-
[52]
S., Aravena, M., Marrone, D
Spilker, J. S., Aravena, M., Marrone, D. P., et al. 2015, ApJ, 811, 124
2015
-
[53]
H., Brammer, G
Stefanon, M., Marchesini, D., Rudnick, G. H., Brammer, G. B., & Whitaker, K. E. 2013, ApJ, 768, 92
2013
-
[54]
Straatman, C. M. S., Labb´ e, I., Spitler, L. R., et al. 2014, ApJL, 783, L14
2014
-
[55]
A., Bezanson, R., Spilker, J
Suess, K. A., Bezanson, R., Spilker, J. S., et al. 2017, ApJL, 846, L14
2017
-
[56]
A., Kriek, M., Price, S
Suess, K. A., Kriek, M., Price, S. H., & Barro, G. 2019, arXiv e-prints, arXiv:1904.10992 14 J. S. Spilker, et al
2019 arXiv
-
[57]
Szomoru, D., Franx, M., & van Dokkum, P. G. 2012, ApJ, 749, 121
2012
-
[58]
G., et al
Szomoru, D., Franx, M., van Dokkum, P. G., et al. 2010, ApJ, 714, L244
2010
-
[59]
M., et al
Tacchella, S., Dekel, A., Carollo, C. M., et al. 2016, MNRAS, 458, 242
2016
-
[60]
M., Renzini, A., et al
Tacchella, S., Carollo, C. M., Renzini, A., et al. 2015, Science, 348, 314
2015
-
[61]
M., F¨ orster Schreiber, N
Tacchella, S., Carollo, C. M., F¨ orster Schreiber, N. M., et al. 2018, ApJ, 859, 56
2018
-
[62]
J., Genzel, R., Saintonge, A., et al
Tacconi, L. J., Genzel, R., Saintonge, A., et al. 2018, ApJ, 853, 179
2018
-
[63]
J., et al
Tadaki, K.-i., Kodama, T., Nelson, E. J., et al. 2017, ApJ, 841, L25
2017
-
[64]
2018, MNRAS, 476, 3956
Talia, M., Pozzi, F., Vallini, L., et al. 2018, MNRAS, 476, 3956
2018
-
[65]
2014, ApJ, 782, 68
Toft, S., Smolˇ ci´ c, V., Magnelli, B., et al. 2014, ApJ, 782, 68
2014
-
[66]
Trujillo, I., Ferreras, I., & de La Rosa, I. G. 2011, MNRAS, 415, 3903 van der Wel, A., Franx, M., van Dokkum, P. G., et al. 2014, ApJ, 788, 28 van Dokkum, P. G., Nelson, E. J., Franx, M., et al. 2015, ApJ, 813, 23
2011
-
[67]
2015, MNRAS, 449, 361
Wellons, S., Torrey, P., Ma, C.-P., et al. 2015, MNRAS, 449, 361
2015
-
[68]
E., Pope, A., Cybulski, R., et al
Whitaker, K. E., Pope, A., Cybulski, R., et al. 2017, ApJ, 850, 208
2017
-
[69]
E., van Dokkum, P
Whitaker, K. E., van Dokkum, P. G., Brammer, G., et al. 2010, ApJ, 719, 1715
2010
-
[70]
2016, MNRAS, 463, 832
Wild, V., Almaini, O., Dunlop, J., et al. 2016, MNRAS, 463, 832
2016
-
[71]
C., Giavalisco, M., Porciani, C., et al
Williams, C. C., Giavalisco, M., Porciani, C., et al. 2011, ApJ, 733, 92
2011
-
[72]
C., Giavalisco, M., Cassata, P., et al
Williams, C. C., Giavalisco, M., Cassata, P., et al. 2014, ApJ, 780, 1
2014
-
[73]
C., Giavalisco, M., Bezanson, R., et al
Williams, C. C., Giavalisco, M., Bezanson, R., et al. 2017, ApJ, 838, 94
2017
-
[74]
T., F¨ orster Schreiber, N
Wisnioski, E., Mendel, J. T., F¨ orster Schreiber, N. M., et al. 2018, ApJ, 855, 97
2018
-
[75]
2018, ApJ, 868, 37
Wu, P.-F., van der Wel, A., Bezanson, R., et al. 2018, ApJ, 868, 37
2018
-
[76]
M., Genzel, R., et al
Wuyts, S., F¨ orster Schreiber, N. M., Genzel, R., et al. 2012, ApJ, 753, 114
2012
-
[77]
M., Nelson, E
Wuyts, S., F¨ orster Schreiber, N. M., Nelson, E. J., et al. 2013, ApJ, 779, 135
2013
-
[78]
M., Bureau, M., Davis, T
Young, L. M., Bureau, M., Davis, T. A., et al. 2011, MNRAS, 414, 940
2011
-
[79]
2009, MNRAS, 400, 1181
Zibetti, S., Charlot, S., & Rix, H.-W. 2009, MNRAS, 400, 1181
2009
-
[80]
2015, MNRAS, 450, 2327
Zolotov, A., Dekel, A., Mandelker, N., et al. 2015, MNRAS, 450, 2327
2015
Reviewed August 14, 2026 · model on record in the stance chip above.
Discussion (0). Continue with ORCID to comment.