REVIEW 1 major objections 4 minor 32 references
Laboratory Calibrations of Fe XII-XIV Line-Intensity Ratios for Electron Density Diagnostics
T0 review · 1 major / 4 minor · reviewed 2026-08-14 · deepseek-v4-flash
Pith's one-line read Laboratory spectra show the Fe XII density diagnostic, not Fe XIII, is the unreliable one.
desk verdict Careful EBIT calibration that isolates Fe XII atomic data as the likely culprit in a well-known solar density diagnostic discrepancy, though an unrecognized blend in the 186 Å feature remains a credible alternative. read the letter →
The pith
A machine-rendered reading of the paper's core claim, the machinery that carries it, and where it could break.
The reading
What carries the argument
The central objects are density-sensitive line-intensity ratios: pairs of allowed extreme-ultraviolet lines from the same ion in which one upper level is fed by a metastable lower level whose population changes with electron density, while the other line is density-insensitive. The experiment uses an electron beam ion trap to create the ions, and the key calibration step is converting the measured electron-beam width and the imaged ion-cloud size into the spatially and time-averaged effective density $n_{\rm eff}$ that the ions experience along their orbits. The theoretical side of the comparison is carried out with the Flexible Atomic Code (FAC), a fully relativistic atomic-structure and collision package, and is cross-checked against the CHIANTI database tabulations that are standard for solar spectroscopy.
What would settle it
Measure the Fe XII ion-cloud diameter directly at the same beam conditions, for example by detecting a visible metastable Fe XII transition, and recompute the (186.85 + 186.88)/195.12 ratio against $n_{\rm eff}$; if the curve still lies above the FAC and CHIANTI predictions, the atomic calculations for Fe XII are the culprit.
Extended reading notes
Core claim
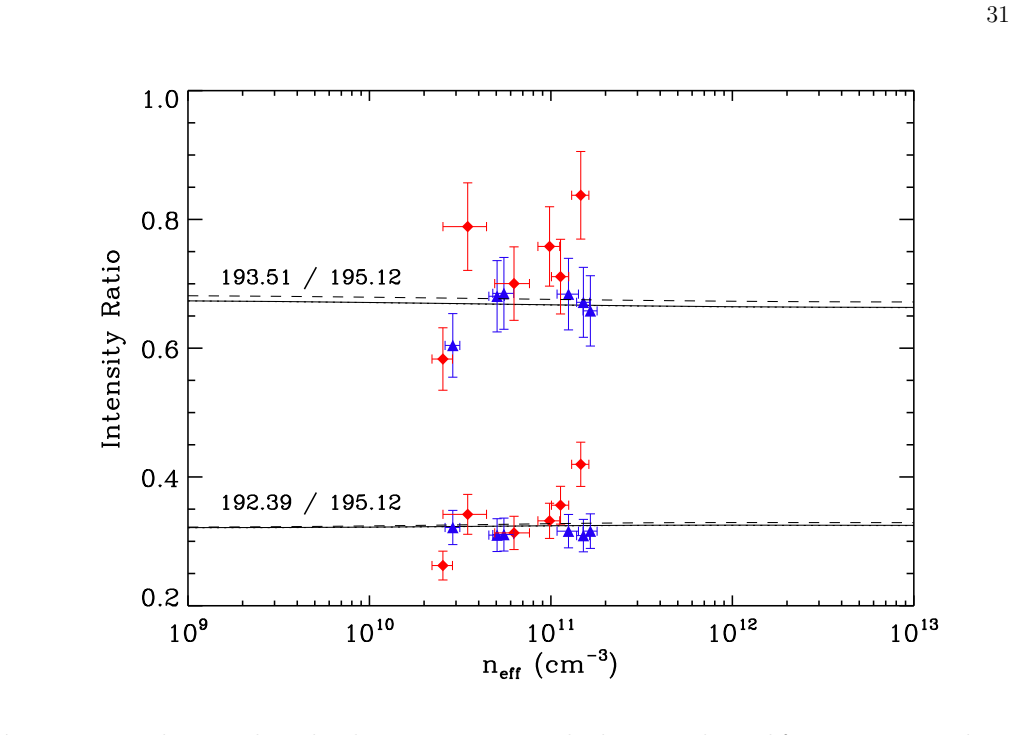
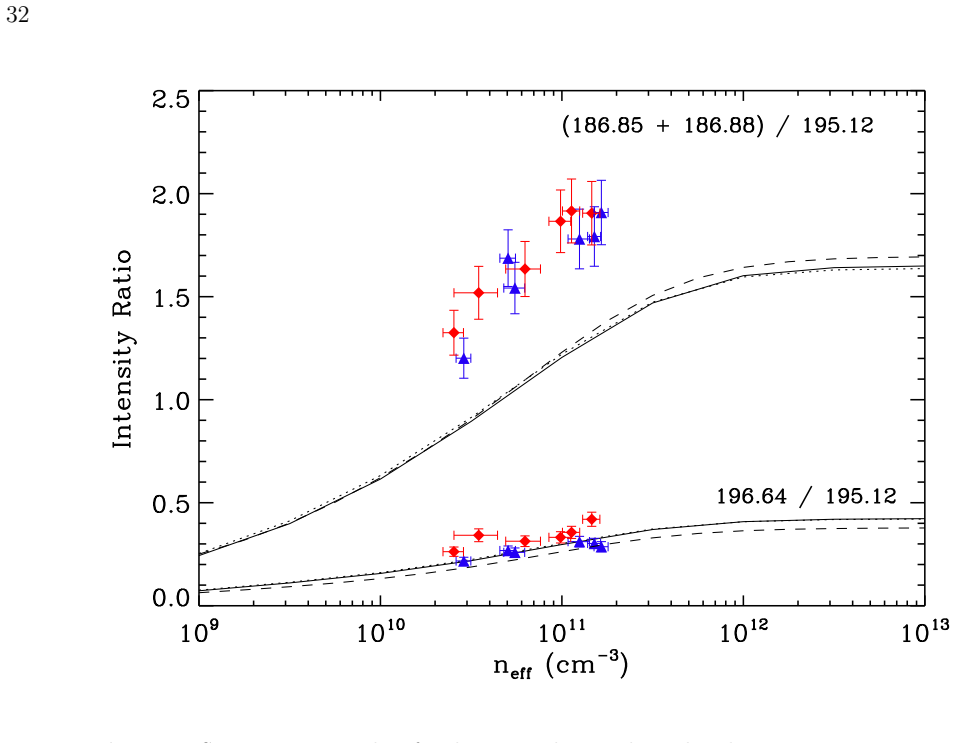
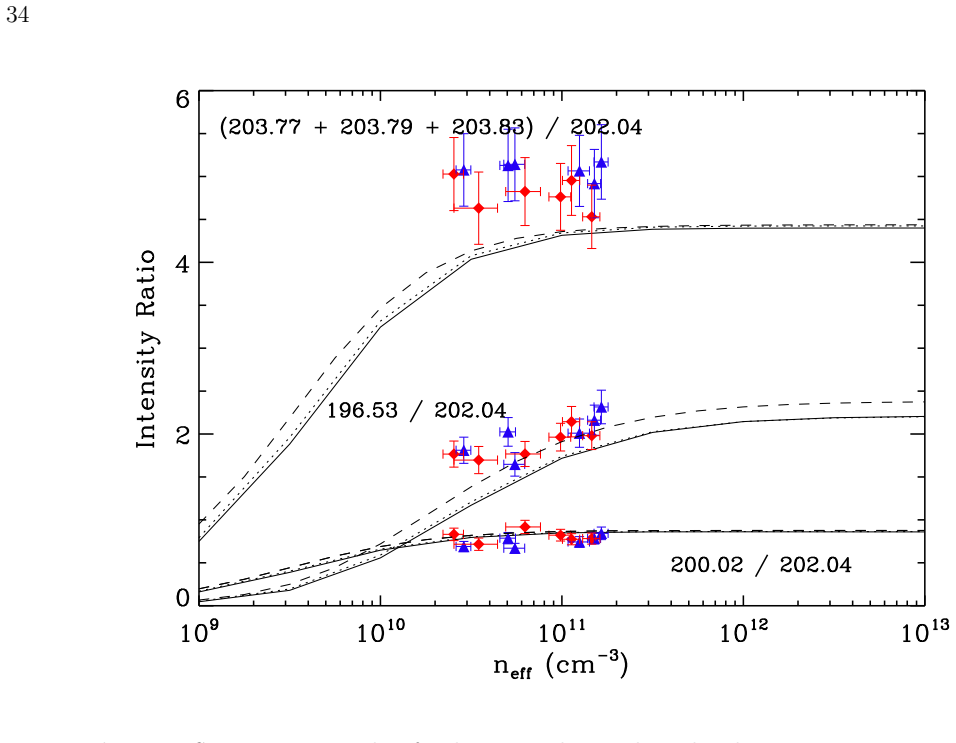
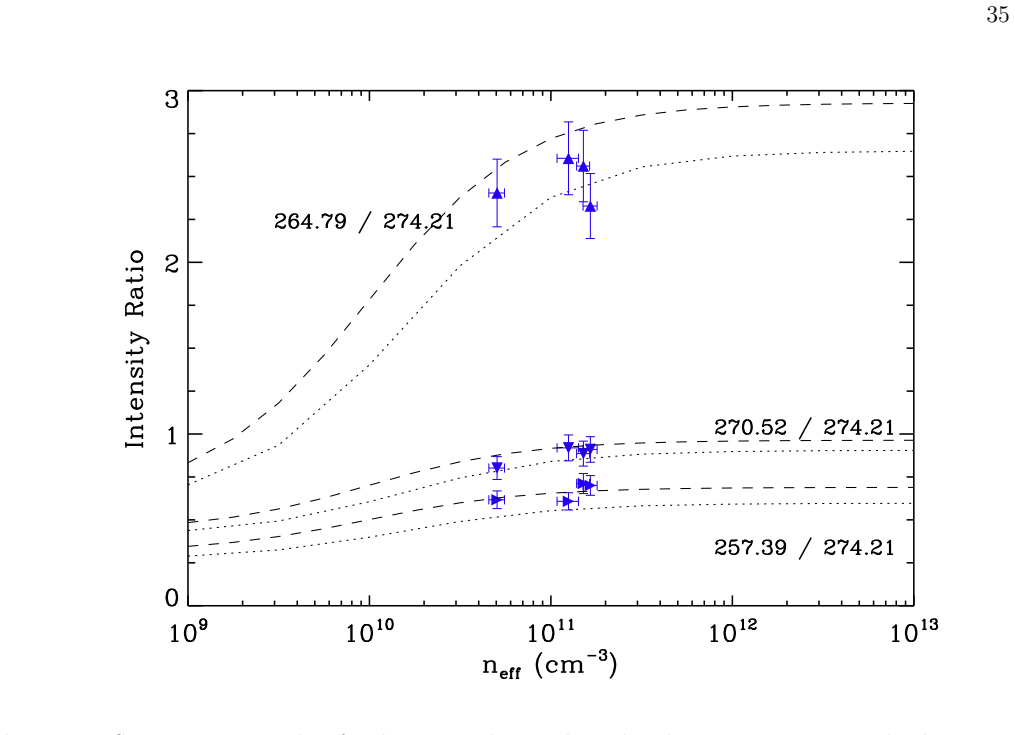
The central claim is that current atomic calculations for Fe XII are wrong in a way that corrupts the standard (186.85 + 186.88)/195.12 density diagnostic. The measured ratio in the electron beam ion trap is systematically above the Flexible Atomic Code prediction, with a steeper density dependence, and the difference exceeds the estimated 20% uncertainty in the calculations. By contrast, the Fe XIII 196.53/202.04 and the Fe XIV 264.79/274.21 and 270.52/274.21 ratios agree with theory within uncertainties. Since the Fe XII prediction is nearly identical to the CHIANTI tabulations that solar physicists use, the authors attribute the factor-of-several density discrepancies between Fe XII and Fe XIII in solar observations to the Fe XII atomic data, and conclude that the Fe XIII diagnostic is the reliable one.
Load-bearing premise
The largest load-bearing assumption is that the Fe XIV ion-cloud diameter, measured from a visible metastable line, is a valid proxy for the Fe XII and Fe XIII ion-cloud sizes, so that the effective electron density assigned to those ions is correct.
Editorial extensions
If this is right
- Solar coronal densities derived from the Fe XII (186.85 + 186.88)/195.12 ratio with current CHIANTI or FAC data are likely overestimated by roughly an order of magnitude.
- Solar density results based on the Fe XIII 196.53/202.04 diagnostic and on the Fe XIV 264.79/274.21 and 270.52/274.21 diagnostics can be trusted at the level tested here.
- Atomic-data improvement efforts for the Fe XII ion, especially the metastable-level population rates behind the 186 Å lines, should take priority over reworking the Fe XIII diagnostic.
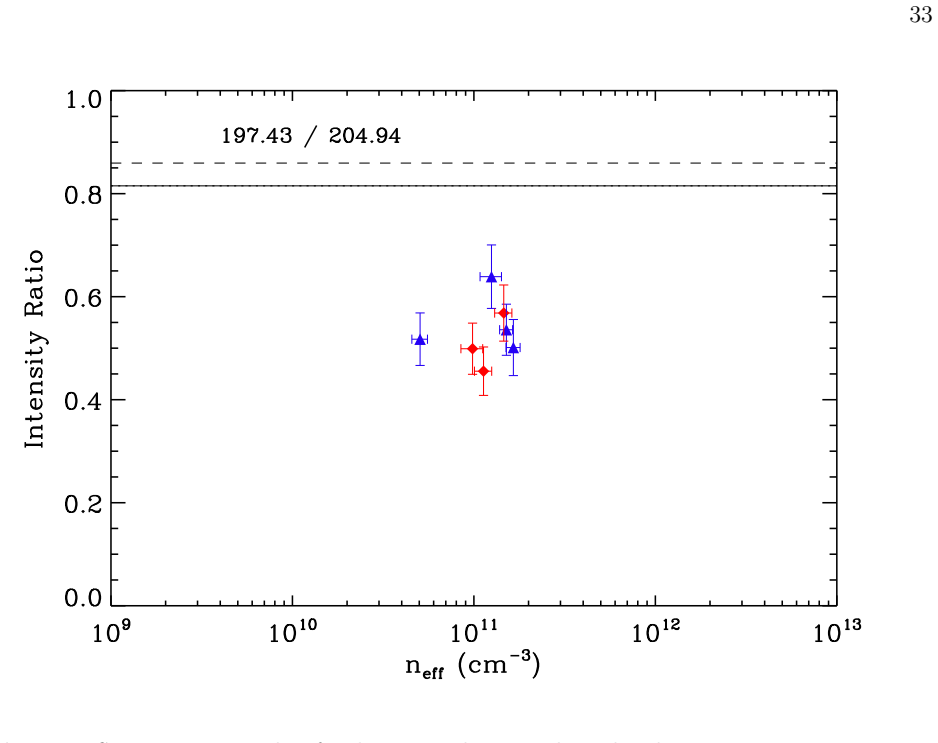
- The measured 197.43/204.94 Fe XIII ratio, although density-insensitive, disagrees with theory by about 30%, indicating a residual atomic-structure problem in Fe XIII that does not spoil the density diagnostics studied here.
Reading between the lines
- If the Fe XII problem lives in the metastable-level collision rates, other Fe XII density diagnostics built on the same lower-level populations would also be biased, and previously published solar densities using them may need revision.
- The ion-cloud assumption could be tested directly: detecting a visible metastable Fe XII line would yield the true Fe XII cloud size and a refined density scale for the 186 Å ratio.
- The pattern of results suggests that the reliability of a density diagnostic is not guaranteed by the ion being well studied; each line pair needs its own laboratory benchmark, and the same EBIT method could be extended to other astrophysically important ions.
- Because FAC and CHIANTI agree despite using different electron-energy distributions, the discrepancy is probably not an artifact of the monoenergetic beam but a genuine atomic-physics deficit in the Fe XII model.
Signed reviews
Editorial analysis
A structured set of objections, weighed in public.
Referee Report
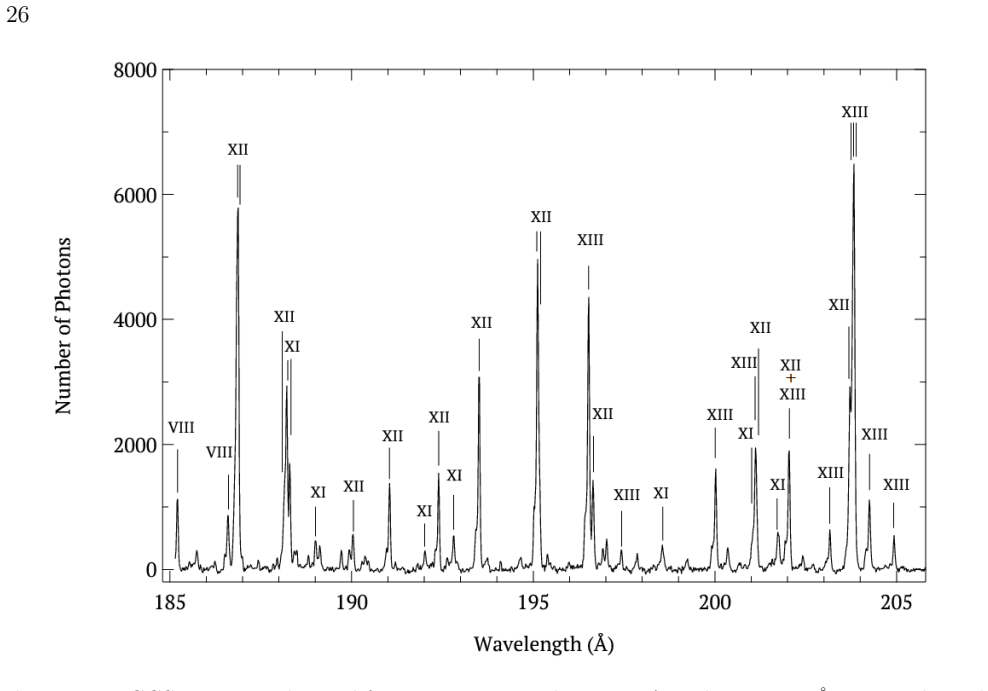
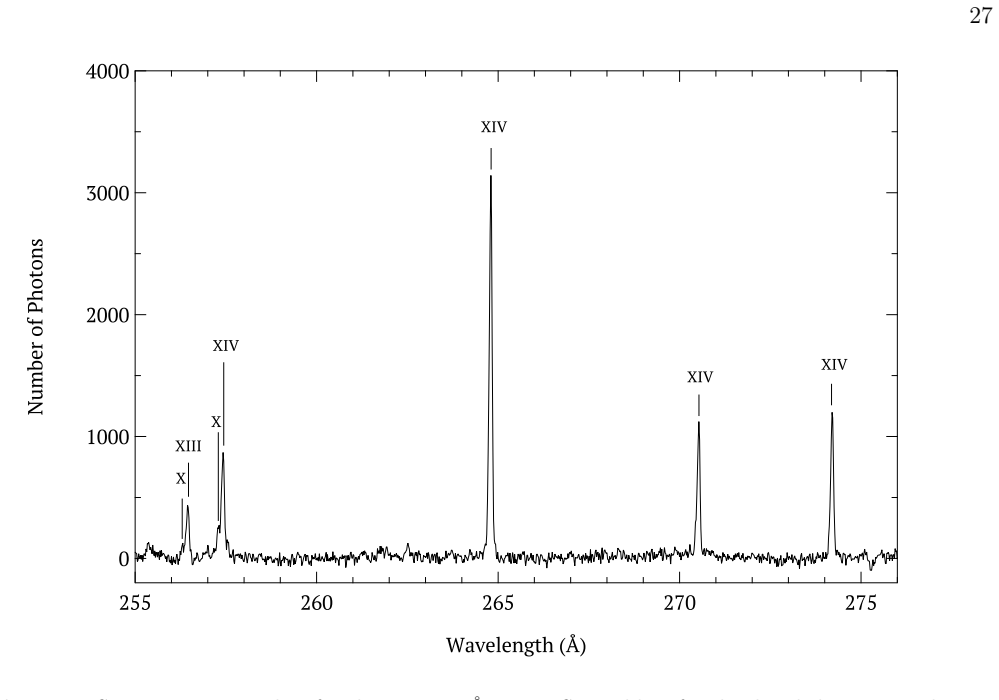
Summary. The paper reports electron beam ion trap (EBIT) measurements of extreme-ultraviolet line-intensity ratios for Fe XII, Fe XIII, and Fe XIV, with the goal of calibrating electron-density diagnostics used in solar physics. The authors measure ratios in the 185–205 Å and 255–276 Å ranges, derive effective electron densities from measured beam and ion-cloud profiles, and compare the results with Flexible Atomic Code (FAC) and CHIANTI predictions. They find good agreement for the Fe XIII 196.53/202.04 and Fe XIV 264.79/274.21 and 270.52/274.21 diagnostics, but a large discrepancy for the commonly used Fe XII (186.85+186.88)/195.12 ratio, which is larger and steeper than predicted. The paper concludes that the known solar discrepancy between Fe XII and Fe XIII density measurements is likely due to errors in the Fe XII atomic calculations.
Significance. If the results hold, the paper provides valuable laboratory benchmarks for Fe XIII and Fe XIV density diagnostics while calling into question the reliability of the widely used Fe XII (186.85+186.88)/195.12 diagnostic. The work is careful in several respects: the effective-density formulation is derived in appendices with a two-level analytic model and ion-trajectory simulations, polarization corrections including electron spiraling are evaluated, and systematic uncertainties from spectral fitting are quantified at the 8% level. The comparison against independent FAC and CHIANTI calculations is appropriate, and the measured density-insensitive Fe XII ratios (192.39/195.12 and 193.51/195.12) agree well with theory, which strengthens the internal consistency of the data. The central claim, however, hinges on the cleanliness of the 186.85+186.88 blend.
major comments (1)
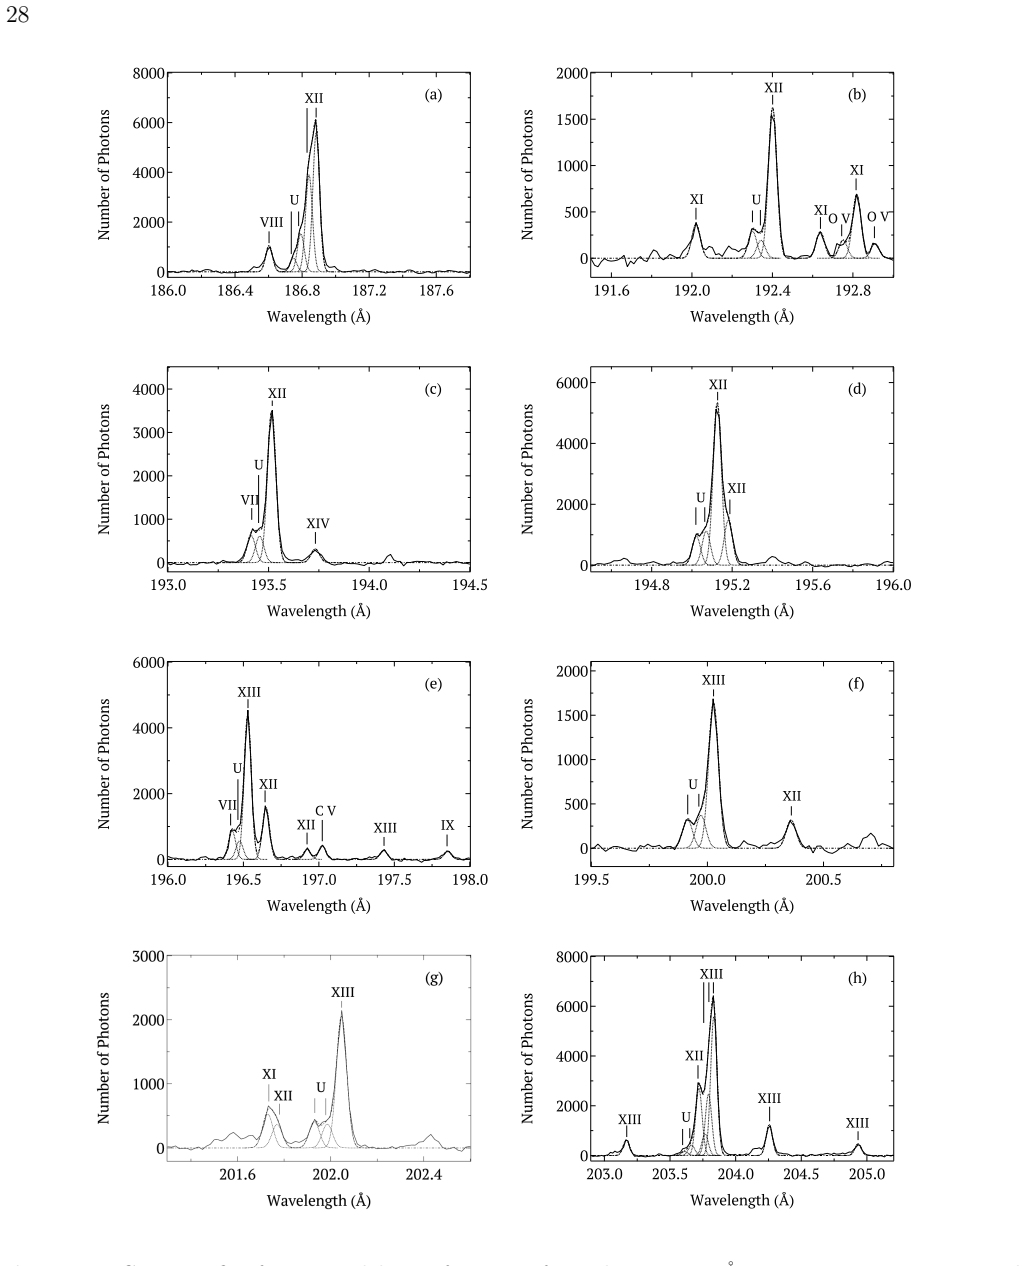
- [§2.1, Table 1, §5.1] The central conclusion that the Fe XII (186.85+186.88)/195.12 discrepancy is due to atomic data is not fully secured against the possibility of an unidentified blend in the 186.85/186.88 feature. Table 1 lists unidentified lines at 186.75 and 186.80 Å in the same spectral region, and §2.1 states that 'not all the lines could be identified.' The 186.85 and 186.88 Å lines are themselves blended and are intentionally summed because they are difficult to separate. The systematic fitting tests described in §2.1 varied only background and line-width assumptions, producing ±8% changes; they would not detect a constant or current-dependent contaminating line within the blend. If an unidentified line, for example an O V transition, contributes to this feature, it would inflate the measured numerator and could produce exactly the observed larger, steeper ratio, consistently for all three density-insensitive reference lines (192.39, 193.51, 195.12), as reported in §5.4. This would make the apparent discrepancy an experimental artifact rather than evidence against the Fe XII atomic calculations. To support the paper's claim, the authors should either demonstrate that no reasonable contaminant can account for the excess (e.g., by fitting the 186.85+186.88 feature with an additional Gaussian component, or by comparing the ratio's dependence on beam energy and current with the known behavior of candidate blends) or substantially temper the conclusion.
minor comments (4)
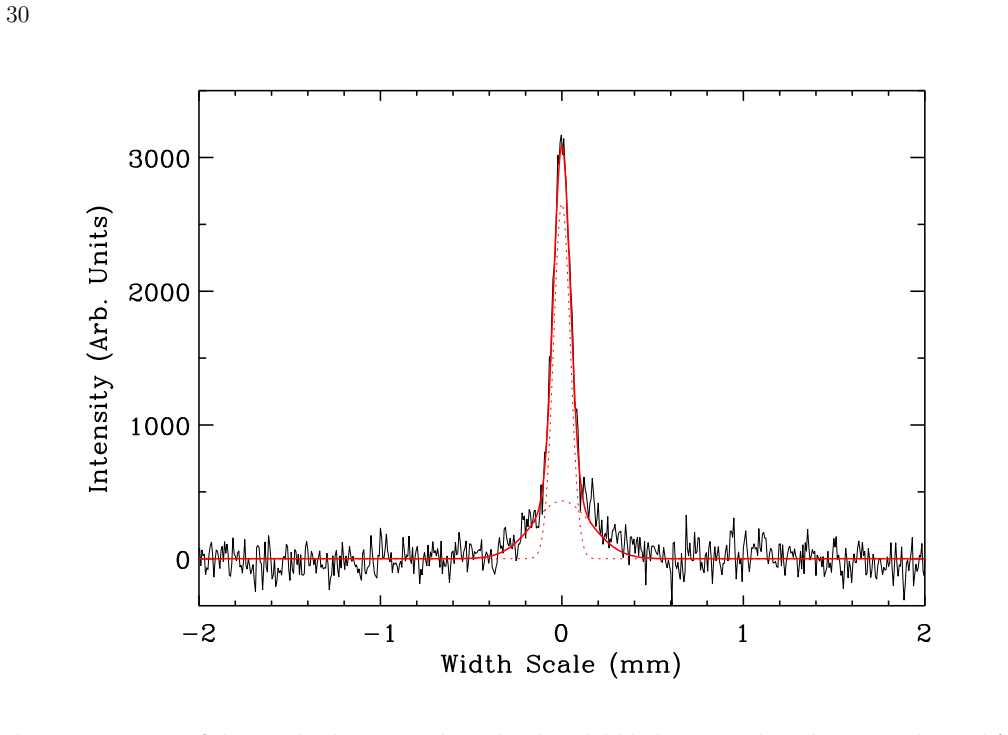
- [§2.2] The effective density for the Fe XII and Fe XIII ratios is derived using the Fe XIV ion-cloud diameter, assuming a charge dependence of less than 10% from a gyroradius scaling argument. This is plausible, and a larger Fe XII cloud would shift the data to lower effective densities, which would only increase the already large discrepancy; nevertheless, a direct measurement of the Fe XII cloud size or an explicit upper limit on its size would remove this assumption and strengthen the analysis.
- [Table 3] The entry for the Fe XIII 196.53 Å line at 5 mA appears to be missing digits; '91' is not a plausible intensity value, and this looks like a typographical error that should be corrected.
- [Table 1] The wavelength ordering in Table 1 is broken: the row '195.47 U' appears after the 196.42 Å entry, which interrupts the numerical sequence. Please reorder the lines by wavelength.
- [§5.2] The paper reports a 30% discrepancy in the density-insensitive Fe XIII 197.43/204.94 ratio. While this is not a density diagnostic, it suggests that the Fe XIII atomic model may also have issues; the summary would benefit from a sentence explaining whether this discrepancy has any bearing on the reliability of the Fe XIII density diagnostics recommended in the conclusions.
Circularity Check
No circularity: measured EBIT ratios are compared to independent FAC/CHIANTI calculations, and effective densities are derived from independent beam and cloud measurements.
full rationale
The paper is an experimental calibration study, not a derivation that reduces to its inputs. The central comparisons are between measured EBIT line-intensity ratios, plotted versus an independently derived effective electron density, and theoretical ratios from FAC and CHIANTI. The FAC and CHIANTI calculations are external benchmarks with stated atomic models; they are not fitted to the EBIT data. The effective density is computed from measured beam current, measured electron-beam width, and measured ion-cloud width, with the equivalence of spatial and time averages demonstrated analytically in Appendices A and B rather than assumed to force agreement. Previous work by the same group is cited for instrument details and polarization estimates, but those citations are not load-bearing for the main discrepancy claim. The abstract's attribution of the Fe XII discrepancy to atomic-data issues is an inference from the comparison, not a circular redefinition; an unidentified spectral blend would be a physical alternative explanation but does not constitute circularity. No fitted parameter is renamed as a prediction, and no uniqueness theorem or prior result is invoked to forbid alternatives. Therefore the derivation is self-contained with respect to the claimed comparisons, and no circular step is present.
Assumptions & free parameters
assumptions (5)
- domain assumption The electron beam density profile is Gaussian (Equation 4).
- domain assumption The Fe XIV 5302.9 angstrom metastable line measures the ion cloud size for Fe XII, Fe XIII, and Fe XIV.
- domain assumption The spatial average of the electron density over the ion cloud equals the time average experienced by the ions (Appendix B).
- domain assumption The two-level model's Taylor expansion in Equation (15) is valid for the EBIT orbit timescales.
- domain assumption FAC and CHIANTI calculations provide appropriate benchmarks for the line ratios.
Cite this review
Pith. "Pith review of Laboratory Calibrations of Fe XII-XIV Line-Intensity Ratios for Electron Density Diagnostics." pith.science (2026). https://pith.science/paper/WCLZWHLP
@misc{pith2026190808094,
  author       = {Pith},
  title        = {Pith review of: Laboratory Calibrations of Fe XII-XIV Line-Intensity Ratios for Electron Density Diagnostics},
  year         = {2026},
  howpublished = {\url{https://pith.science/paper/WCLZWHLP}},
  note         = {Machine review of arXiv:1908.08094}
}
read the original abstract
We have used an electron beam ion trap to measure electron-density-diagnostic line-intensity ratios for extreme ultraviolet lines from F XII, XIII, and XIV at wavelengths of 185-205 255-276 Angstroms. These ratios can be used as density diagnostics for astrophysical spectra and are especially relevant to solar physics. We found that density diagnostics using the Fe XIII 196.53/202.04 and the Fe XIV 264.79/274.21 and 270.52A/274.21 line ratios are reliable using the atomic data calculated with the Flexible Atomic Code. On the other hand, we found a large discrepancy between the FAC theory and experiment for the commonly used Fe XII (186.85 + 186.88)/195.12 line ratio. These FAC theory calculations give similar results to the data tabulated in CHIANTI, which are commonly used to analyze solar observations. Our results suggest that the discrepancies seen between solar coronal density measurements using the Fe XII (186.85 + 186.88)/195.12 and Fe XIII 196.54/202.04 line ratios are likely due to issues with the atomic calculations for Fe XII.
Figures
Figures from the paper (7 more)

Reference graph
Works this paper leans on
-
[1]
P., Beiersdorfer, P., Brown, G
Arthanayaka, T. P., Beiersdorfer, P., Brown, G. V., et al. 2018, Rev. Sci. Instrum., 89, 10E119
work page 2018
- [2]
- [3]
- [4]
-
[5]
Beiersdorfer, P., Tr¨ abert, E., & Pinnington, E. H. 2003, ApJ, 587, 836
work page 2003
-
[6]
Birdsall, C. K., & Langdon, A. B. 2005, Plasma Physics via Computer Simulation (New York: Taylor and Francis)
work page 2005
- [7]
- [8]
Show all 32 references
-
[9]
2002, Can
Widmann, K., & Decaux, V. 2002, Can. J. Phys., 80, 1687
2002
-
[10]
L., Harra, L
Culhane, J. L., Harra, L. K., James, A. M., et al. 2007, Sol. Phys., 243, 19 Del Zanna, G. 2012, A&A, 537, 38 Del Zanna, G., Dere, K. P., Young, P. R., Landi, E., & Mason, H. E. 2015, A&A, 582, 56 Del Zanna, G., & Mason, H. E. 2005, A&A, 433, 731 Del Zanna, G., Storey, P. J., ...
2007
-
[11]
Mason, H. E. 2012, A&A, 543, 139
2012
-
[12]
C., & Young, P
Fossi, B. C., & Young, P. R. 1997, A&AS, 125, 149
1997
-
[13]
Bhatia, A. K. 1979, ApJS, 40, 341
1979
-
[14]
Flower, D. R. 1977, A&A, 54, 163
1977
-
[15]
Gu, M. F. 2008, Can. J. Phys., 86, 675
2008
-
[16]
2018, NIST Atomic Spectra Database (version 5.6.1), Tech
Kramida, A., Ralchenko, Y., Reader, J., & NIST ASD Team. 2018, NIST Atomic Spectra Database (version 5.6.1), Tech. rep., National Institute of Standards and Technology,
2018
-
[17]
R., Dere, K
Landi, E., Young, P. R., Dere, K. P., Del Zanna, G., & Mason, H. E. 2013, ApJ, 763, 86
2013
-
[18]
A., Marrs, R
Levine, M. A., Marrs, R. E., Bardsley, J. N., et al. 1989, Nucl. Instrum. Methods Phys. Res. B, 43, 431
1989
-
[19]
1973, ApJ, 181, 1009
Malinovsky, L., & Heroux, M. 1973, ApJ, 181, 1009
1973
-
[20]
A., & Stoekhler, T
Knapp, D. A., & Stoekhler, T. 1995, Phys. Scr., T59, 183
1995
-
[21]
A., et al
Nakamura, N., Watanabe, E., Sakaue, H. A., et al. 2011, ApJ, 739, 17
2011
-
[22]
Phillips, K. J. H., Feldman, U., & Landi, E. 2008, Ultraviolet and X-Ray Spectroscopy of the Solar Atmosphere (Cambridge University Press)
2008
-
[23]
2013, Phys
Qin, H., Zhang, S., Xiao, J., et al. 2013, Phys. Plasmas, 20, 084503
2013
-
[24]
Stern, R. A. 1996, ApJ, 467, 841
1996
-
[25]
2017, A&A, 601, 111 Tr¨ abert, E., Beiersdorfer, P., Brickhouse, N
Shimizu, E., Safdar, A., Tsuda, T., et al. 2017, A&A, 601, 111 Tr¨ abert, E., Beiersdorfer, P., Brickhouse, N. S., &
2017
-
[26]
B., Beiersdorfer, P., L´ opez-Urrutia, J
Utter, S. B., Beiersdorfer, P., L´ opez-Urrutia, J. R. C., & Widmann, K. 1999, Nucl. Instrum. Meth. Phys. Res. A, 428, 276
1999
-
[27]
1990, Report No
Vogel, D. 1990, Report No. UCRL-ID-104990, Tech. rep., Lawrence Livermore National Laboratory
1990
-
[28]
2009, ApJ, 692, 1294
Watanabe, T., Hara, H., Yamamoto, N., et al. 2009, ApJ, 692, 1294
2009
-
[29]
E., Beiersdorfer, P., Soukhanovskii, V
Weller, M. E., Beiersdorfer, P., Soukhanovskii, V. A., Scotti, F., & LeBlanc, B. P. 2018, ApJ, 854, 102
2018
-
[30]
2008, ApJ, 689, 646
Yamamoto, N., Kato, T., Funaba, H., et al. 2008, ApJ, 689, 646
2008
-
[31]
R., Watanabe, T., Hara, H., & Mariska, J
Young, P. R., Watanabe, T., Hara, H., & Mariska, J. T. 2009, A&A, 495, 587
2009
-
[32]
Y., Del Zanna, G., Mason, H
Young, P. Y., Del Zanna, G., Mason, H. E., et al. 2007, Publ. Astron. Soc. Japan, 59, S857
2007
Reviewed August 14, 2026 · model on record in the stance chip above.
Discussion (0). Continue with ORCID to comment.