REVIEW 3 major objections 3 minor 1 cited by
The rate of extreme coronal line emitters in the Baryon Oscillation Spectroscopic Survey LOWZ sample
T0 review · 3 major / 3 minor · reviewed 2026-08-10 · deepseek-v4-flash
Pith's one-line read Searching 341,110 BOSS LOWZ galaxies, this paper finds one variable extreme coronal line emitter and measures a rate of 1.6e-6 per galaxy per year at redshift ~0.3.
desk verdict Careful single-event vECLE rate at z~0.3 that is plausibly right but carries a large, partially unquantified calibration systematic. read the letter →
The pith
A machine-rendered reading of the paper's core claim, the machinery that carries it, and where it could break.
The reading
What carries the argument
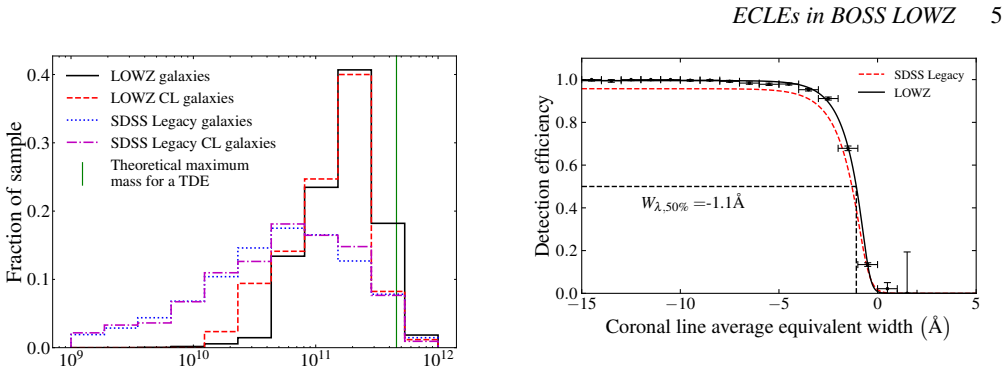
The machine that converts one detection into a rate is the visibility time: for each LOWZ galaxy, the paper samples a peak luminosity from the Sazonov et al. (2021) TDE X-ray luminosity function, converts it to a peak coronal-line strength by requiring the line-to-X-ray ratio of AT 2017gge (Eq. 2), evolves the strength as a power law over ten years, and integrates the detection efficiency over time (Eq. 4). The sum of these visibility times over all searched galaxies is the denominator of the galaxy- and mass-normalized rates; the volumetric rate is obtained by weighting the mass-normalized rate with the stellar mass function. The rate–mass and rate–sSFR relations are extended by fitting power laws to the LOWZ point together with the SDSS Legacy bins.
What would settle it
A targeted study of ten TDEs with simultaneous X-ray and coronal-line measurements would settle it: if the peak coronal-line strength per unit X-ray luminosity scatters beyond the AT 2017gge uncertainty, the single-object calibration that sets every visibility time in this paper breaks.
Extended reading notes
Core claim
The central discovery is a measured rate rather than a new phenomenon: after searching 341,110 BOSS LOWZ galaxies and confirming one variable ECLE among two candidates, the authors report a galaxy-normalized rate $R_\mathrm{G}=1.6^{+3.8}_{-1.4}\times10^{-6}~\mathrm{galaxy}^{-1}~\mathrm{yr}^{-1}$, a mass-normalized rate $R_\mathrm{M}=7^{+16}_{-6}\times10^{-18}~M_\odot^{-1}~\mathrm{yr}^{-1}$, and a volumetric rate $R_\mathrm{V}=1.8^{+4.5}_{-1.5}\times10^{-9}~\mathrm{Mpc}^{-3}~\mathrm{yr}^{-1}$ at redshift ~0.3. These rates are formally lower than but statistically consistent with the SDSS Legacy vECLE rates at z ~0.1, and are one to two orders of magnitude below literature TDE rates, implying that only 5-20 per cent of TDEs produce detectable variable coronal lines. The paper also finds that the vECLE rate decreases with increasing galaxy stellar mass, following a power law consistent with theoretical TDE rate predictions scaled by factors of 0.05-0.5, and that the mass-normalized rate shows a ~2σ positive correlation with specific star formation rate.
Load-bearing premise
The rate rests on the assumption that a tidal disruption event's peak coronal-line strength is proportional to its peak X-ray luminosity, a ratio calibrated from just one event, AT 2017gge, and applied to every galaxy.
Editorial extensions
If this is right
- At redshift ~0.3, the vECLE rate is $1.6^{+3.8}_{-1.4}\times10^{-6}~\mathrm{galaxy}^{-1}~\mathrm{yr}^{-1}$, formally 2–4 times lower than the z~0.1 SDSS Legacy rate but consistent within 1σ.
- The vECLE rate decreases with galaxy stellar mass; the combined Legacy+LOWZ power-law fit has slope $-0.7\pm0.3$ in the galaxy-normalized rate, matching theoretical TDE rate–mass relations scaled by 5–50 per cent.
- Comparing the LOWZ rates with the lowest literature TDE rates implies vECLEs are produced by roughly 5–20 per cent of all TDEs.
- The mass-normalized rate may increase with specific star formation rate at ~2σ significance, hinting that gas-rich galaxies host vECLEs preferentially.
- The [Ne V] λ3426 Å emission line, detected here for the first time in an ECLE, is a promising tool for future high-redshift coronal-line searches.
Reading between the lines
- If the redshift decline in vECLE rate is real, large surveys like DESI at z>0.5 should find vECLE yields far below the local rate; a null result at higher z would actually be consistent with the TDE-progenitor picture, turning non-detections into informative upper limits.
- The single-object calibration of Eq. (2) is the crux: a dedicated program to measure coronal-line strengths and X-ray luminosities across a sample of TDEs would test whether the line-to-X-ray ratio is universal, and would directly rescale all published vECLE rates.
- The apparent dependence on specific star formation rate, if confirmed, suggests that gas geometry or density, not just black hole mass, gates which TDEs become vECLEs; this could be tested by comparing vECLE host environments to non-emitting TDE hosts in the same mass range.
- The rate–mass slope measured here, combined with the theoretical TDE rate–mass relation, implies that the fraction of TDEs producing coronal lines may itself be mass-dependent; future, larger vECLE samples could test whether that fraction rises in lower-mass galaxies.
Editorial analysis
A structured set of objections, weighed in public.
Referee Report
Summary. This paper searches 341,110 BOSS LOWZ galaxy spectra for extreme coronal line emitters (ECLEs), identifies two candidates, and uses follow-up DESI and Gemini spectroscopy plus WISE mid-infrared photometry to determine that one object (SDSS J0113) is a variable ECLE (vECLE). The authors then compute the galaxy-normalized, mass-normalized, and volumetric vECLE rates at redshift ~0.3 using a visibility-time method that converts a single detection into a rate. The quoted rates are R_G = 1.6^{+3.8}_{-1.4} × 10^{-6} galaxy^{-1} yr^{-1}, R_M = 7^{+16}_{-6} × 10^{-18} M_sun^{-1} yr^{-1}, and R_V = 1.8^{+4.5}_{-1.5} × 10^{-9} Mpc^{-3} yr^{-1}. These are formally 2–4 times lower than the SDSS Legacy vECLE rates at z~0.1 but consistent within 1 sigma, and one to two orders of magnitude below literature TDE rates, leading the authors to conclude that vECLEs trace a subset of 5–20% of tidal disruption events.
Significance. The paper presents the first vECLE rate measurement at z~0.3, extending the vECLE rate–mass relation from C24 to higher masses and providing a new constraint on the connection between extreme coronal line emission and tidal disruption events. The search pipeline, detection-efficiency simulations, and Monte Carlo uncertainty propagation are transparent, and the data availability statement plus the use of public surveys (BOSS, DESI, WISE) make the analysis reproducible. The principal significance is the demonstration that vECLE rate measurements can be pushed to higher redshift with current spectroscopic samples, although the measurement rests on a single event and on a single-object calibration of the CL-to-X-ray luminosity scaling.
major comments (3)
- [Section 5.1, Eq. (2); Table 6] The visibility time t_v, and therefore all three quoted rates, relies on the assumption that the peak coronal-line strength scales linearly with the peak X-ray luminosity, calibrated with the single TDE AT 2017gge. The Monte Carlo propagates only the measurement errors on S_gge and L_gge, not the validity of the linear scaling itself. Because the CL strength decays as S(t) ~ t^beta with beta in [-5/3, -5/12], a constant multiplicative error f in the calibration changes t_v as f^{-1/beta}; a factor 10 miscalibration would shift the rates by a factor of roughly 4 to 250, far exceeding the quoted +233%/-84% uncertainty. The paper itself notes in Section 5.4 that ISM properties (density, clumpiness, ionization balance) are not considered, but these are precisely the factors that could make the AT 2017gge calibration non-universal. This is load-bearing: the 5–20% TDE fraction and the comparison with C24 both depend on t_v. The authors should quantify this systematic, for example by adopting a range of plausible scalings (e.g., S_max proportional to L_X^q with q varied, or introducing a log-normal scatter) and reporting the resulting spread in the rates.
- [Section 3.2 and Section 4.2.1] The detection efficiency used in the visibility-time integral (Eq. 4) is measured by injecting the full Wang et al. (2012) CL set into synthetic spectra, but the sole confirmed vECLE, SDSS J0113, was selected through the [Fe VII]-only flag (two moderately strong [Fe VII] lines with no other detected CLs). The efficiency curve epsilon(S) may not describe the survey sensitivity to a galaxy that is detectable only via [Fe VII]. If the single-line detection path has different sensitivity as a function of CL strength, the inferred visibility time and hence all derived rates would shift. Please either compute a [Fe VII]-specific efficiency curve or argue quantitatively that the full-CL-set efficiency is representative for the [Fe VII]-only selection.
- [Section 5.1, Eq. (1); Table 6] The Monte Carlo uncertainty budget does not include the uncertainties on the Sazonov et al. (2021) X-ray luminosity function parameters, N0 = (1.4 ± 0.8) × 10^{-7} Mpc^{-3} yr^{-1} and a = -0.6 ± 0.2. The slope a directly changes the probability distribution of peak luminosities from which L_max is sampled, and hence the distribution of S_max and the resulting t_v. Since Table 6 presents a complete error budget, omitting a known input-parameter uncertainty leaves the quoted rate uncertainties underestimated. Please sample the XLF parameters in the Monte Carlo and report the additional contribution to the rate uncertainties.
minor comments (3)
- [Section 5.2 and Figure 7] The power-law fit to the rate–mass relation reports a reduced chi2 of 0.02, which the paper attributes to a biased estimator for small Poisson counts. It would be helpful to state explicitly that the small chi2 does not indicate an over-fit, and to show the data points with their asymmetric error bars in the figure so readers can judge the quality of the fit.
- [Section 4.2.1] The discussion of [Ne V] emission, while scientifically interesting, is somewhat lengthy for a single-object paper; consider moving some of the comparison with TDE spectra (AT 2018dyk, AT 2019aalc, TDE 2019qiz) to a footnote or a short paragraph to improve readability.
- [Table 6] The note that the total uncertainty percentages are the 'linear sum' of statistical and systematic uncertainties is unclear; if the contributions are added in quadrature, state so, and if they are added linearly, justify why that is the appropriate combination for asymmetric errors.
Circularity Check
No significant circularity: the LOWZ vECLE rate is a new measurement (one detection divided by an independent visibility-time model), with C24 self-citations supplying methodology and calibration inputs rather than the derived result.
full rationale
The rate derivation is not circular. The measured vECLE rate is N = 1 divided by the summed visibility time t_v (Eqs. 4-5). The detection count and visibility time are computed from independent inputs: the LOWZ spectroscopic search (Section 3), the detection efficiency from fake spectra (Section 3.2), the Sazonov et al. (2021) X-ray luminosity function, and the AT 2017gge-based CL-strength calibration (Eq. 2). Equation 2 is a stated single-object assumption, not a fit to the LOWZ vECLE, so it carries external-validation risk but does not make the derivation circular. The paper's use of C24 supplies the detection algorithm and the AT 2017gge line-strength measurement; these are inputs, and the LOWZ rate is a new quantity not contained in those inputs. The comparison to TDE rates is an external benchmark, and the 5-20% fraction is a ratio to literature rates, not a self-referential construction. The caveat in Section 5.4 that ISM properties were not considered is an acknowledged limitation, not evidence of circularity. No step was found in which a prediction is equivalent by construction to an input.
Assumptions & free parameters
free parameters (3)
- CL decay power-law index beta =
sampled uniformly from -5/3 to -5/12
- CL-to-X-ray luminosity scaling constant =
from AT 2017gge via C24
- Sazonov XLF slope a =
-0.6 +/- 0.2
assumptions (5)
- domain assumption All vECLEs are produced by TDEs and CL strength scales linearly with X-ray luminosity.
- domain assumption The Sazonov et al. (2021) TDE X-ray luminosity function, normalized to a probability distribution, describes the luminosity distribution of CL-producing TDEs.
- ad hoc to paper Detection efficiency measured by injecting the full Wang et al. (2012) CL set applies to a galaxy selected via [Fe VII] only.
- domain assumption The Baldry et al. (2012) galactic stellar mass function, measured at z<0.06, is valid at z~0.3.
- domain assumption AGN and supernova progenitors are excluded for vECLEs because their coronal lines are too weak or fade too fast.
Cite this review
Pith. "Pith review of The rate of extreme coronal line emitters in the Baryon Oscillation Spectroscopic Survey LOWZ sample." pith.science (2026). https://pith.science/paper/WCXM5EOC
@misc{pith2026250114022,
  author       = {Pith},
  title        = {Pith review of: The rate of extreme coronal line emitters in the Baryon Oscillation Spectroscopic Survey LOWZ sample},
  year         = {2026},
  howpublished = {\url{https://pith.science/paper/WCXM5EOC}},
  note         = {Machine review of arXiv:2501.14022}
}
abstract
Extreme coronal line emitters (ECLEs) are a rare class of galaxy that exhibit strong, high-ionization iron coronal emission lines in their spectra. In some cases, these lines are transient and may be the result of tidal disruption event (TDEs). To test this connection, we calculate the rate of variable ECLEs (vECLEs) at redshift $\sim0.3$. We search for ECLEs in the Baryon Oscillation Spectroscopic Survey (BOSS) LOWZ sample and discover two candidate ECLEs. Using follow-up spectra from the Dark Energy Spectroscopic Instrument and Gemini Multi-Object Spectrograph, and mid-infrared observations from the Wide-field Infrared Survey Explorer, we determine that one of these galaxies is a vECLE. Using this galaxy, we calculate the galaxy-normalized vECLE rate at redshift $\sim0.3$ to be $R_\mathrm{G}=1.6~^{+3.8}_{-1.4}\times10^{-6}~\mathrm{galaxy}^{-1}~\mathrm{yr}^{-1}$ and the mass-normalized rate to be $R_\mathrm{M}=7~^{+16}_{-6}\times10^{-18}~\mathrm{M_\odot^{-1}}~\mathrm{yr}^{-1}$. This is then converted to a volumetric rate of $R_\mathrm{V}=1.8~^{+4.5}_{-1.5}\times10^{-9}~\mathrm{Mpc}^{-3}~\mathrm{yr}^{-1}$. Formally, the LOWZ vECLE rates are $2-4$ times lower than the rates calculated from the Sloan Digital Sky Survey Legacy sample at redshift $\sim0.1$. However, given the large uncertainties on both measurements, they are consistent with each other at $1\sigma$. Both the galaxy-normalized and volumetric rates are one to two orders of magnitude lower than TDE rates from the literature, consistent with vECLEs being caused by $5-20$ per cent of all TDEs.
Figures


Figures from the paper (6 more)


Forward citations
Cited by 1 Pith paper
-
AT 2018dyk: tidal disruption event or active galactic nucleus? Follow-up observations of an extreme coronal line emitter with the Dark Energy Spectroscopic Instrument
AT 2018dyk is a tidal disruption event in a gas-rich galaxy, where reprocessed emission produced both its infrared flare and iron coronal lines.
Reference graph
Works this paper leans on
-
[2]
Abazajian K. N., et al., 2009, @doi [The Astrophysical Journal Supplement Series] 10.1088/0067-0049/182/2/543 , 182, 543
-
[3]
Abdurro'uf et al., 2022, @doi [The Astrophysical Journal Supplement Series] 10.3847/1538-4365/ac4414 , 259, 35
-
[4]
P., Satyapal S., 2008, @doi [The Astrophysical Journal] 10.1086/529013 , 678, 686
Abel N. P., Satyapal S., 2008, @doi [The Astrophysical Journal] 10.1086/529013 , 678, 686
doi:10.1086/529013 2008
-
[5]
D., Velzen van van Velzen S., Horesh A., Zauderer B
Alexander K. D., Velzen van van Velzen S., Horesh A., Zauderer B. A., 2020, @doi [Space Science Reviews] 10.1007/s11214-020-00702-w , 216, 81
-
[6]
Andreoni I., et al., 2023, @doi [Nature] 10.1038/s41586-023-05699-0 , 613, E6
-
[7]
Auchettl K., Guillochon J., Ramirez-Ruiz E., 2017, @doi [The Astrophysical Journal] 10.3847/1538-4357/aa633b , 838, 149
-
[9]
Brinchmann J., Charlot S., White S. D. M., Tremonti C., Kauffmann G., Heckman T., Brinkmann J., 2004, @doi [Monthly Notices of the Royal Astronomical Society] 10.1111/j.1365-2966.2004.07881.x , 351, 1151
arXiv 2004
-
[10]
Callow J., et al., 2024a, @doi [zenodo.14222028] 10.5281/zenodo.14222028
Show all 113 references
-
[11]
Callow J., et al., 2024b, @doi [Monthly Notices of the Royal Astronomical Society] 10.1093/mnras/stae2384 , 535, 1095
-
[12]
C., Rodríguez-Ardila A., Riffel R., Marinello M., Prieto A., Dahmer-Hahn L
Cerqueira-Campos F. C., Rodríguez-Ardila A., Riffel R., Marinello M., Prieto A., Dahmer-Hahn L. G., 2020, @doi [Monthly Notices of the Royal Astronomical Society] 10.1093/mnras/staa3320 , 500, 2666
2020 doi
-
[13]
Clark P., et al., 2024, @doi [Monthly Notices of the Royal Astronomical Society] 10.1093/mnras/stae460 , 528, 7076
2024 doi
- [14]
-
[15]
J., et al., 2023a, @doi [The Astrophysical Journal] 10.3847/1538-4357/acc1e6 , 948, 112
Cleri N. J., et al., 2023a, @doi [The Astrophysical Journal] 10.3847/1538-4357/acc1e6 , 948, 112
-
[16]
J., et al., 2023b, @doi [The Astrophysical Journal] 10.3847/1538-4357/acde55 , 953, 10
Cleri N. J., et al., 2023b, @doi [The Astrophysical Journal] 10.3847/1538-4357/acde55 , 953, 10
- [17]
- [18]
-
[19]
DESI Collaboration et al., 2022, @doi [The Astronomical Journal] 10.3847/1538-3881/ac882b , 164, 207
2022 doi
- [20]
- [21]
- [22]
- [23]
- [24]
- [25]
-
[26]
DESI Collaboration et al., 2024g, @doi [The Astronomical Journal] 10.3847/1538-3881/ad0b08 , 167, 62
-
[27]
DESI Collaboration et al., 2024h, @doi [The Astronomical Journal] 10.3847/1538-3881/ad3217 , 168, 58
-
[28]
S., et al., 2013, @doi [The Astronomical Journal] 10.1088/0004-6256/145/1/10 , 145, 10
Dawson K. S., et al., 2013, @doi [The Astronomical Journal] 10.1088/0004-6256/145/1/10 , 145, 10
2013 doi
-
[29]
L., Brandt W
Donley J. L., Brandt W. N., Eracleous M., Boller T., 2002, @doi [The Astronomical Journal] 10.1086/342280 , 124, 1308
2002 doi
-
[30]
Dou L., gui Wang T., Jiang N., Yang C., Lyu J., Zhou H., 2016, The Astrophysical Journal, 832, 188
2016
-
[31]
Esquej P., et al., 2008, @doi [Astronomy and Astrophysics] 10.1051/0004-6361:200810110 , 489, 543
2008 doi
-
[32]
P., 2003, @doi [The Astrophysical Journal Supplement Series] 10.1086/374411 , 146, 407
Finkbeiner D. P., 2003, @doi [The Astrophysical Journal Supplement Series] 10.1086/374411 , 146, 407
2003 doi
-
[33]
Fransson C., et al., 2014, @doi [The Astrophysical Journal] 10.1088/0004-637X/797/2/118 , 797, 118
2014 doi
-
[34]
Frederick S., et al., 2019, @doi [The Astrophysical Journal] 10.3847/1538-4357/ab3a38 , 883, 31
2019 doi
-
[35]
M., Mullaney J
Gelbord J. M., Mullaney J. R., Ward M. J., 2009, @doi [Monthly Notices of the Royal Astronomical Society] 10.1111/j.1365-2966.2009.14961.x , 397, 172
2009
-
[36]
D., 2011, @doi [Monthly Notices of the Royal Astronomical Society] 10.1111/j.1365-2966.2011.19188.x , 416, 2102
Giannios D., Metzger B. D., 2011, @doi [Monthly Notices of the Royal Astronomical Society] 10.1111/j.1365-2966.2011.19188.x , 416, 2102
2011
-
[37]
Gilli R., Vignali C., Mignoli M., Iwasawa K., Comastri A., Zamorani G., 2010, @doi [Astronomy and Astrophysics] 10.1051/0004-6361/201014039 , 519, A92
2010 doi
-
[38]
Graur O., Maoz D., 2013, @doi [Monthly Notices of the Royal Astronomical Society] 10.1093/mnras/sts718 , 430, 1746
2013 doi
-
[39]
B., Modjaz M., 2015, @doi [Monthly Notices of the Royal Astronomical Society] 10.1093/mnras/stv713 , 450, 905
Graur O., Bianco F. B., Modjaz M., 2015, @doi [Monthly Notices of the Royal Astronomical Society] 10.1093/mnras/stv713 , 450, 905
2015 doi
-
[40]
Guillochon J., Ramirez-Ruiz E., 2013, @doi [The Astrophysical Journal] 10.1088/0004-637X/767/1/25 , 767, 25
2013 doi
-
[41]
Gullikson K., Dodson-Robinson S., Kraus A., 2014, @doi [The Astronomical Journal] 10.1088/0004-6256/148/3/53 , 148, 53
2014 doi
-
[42]
Guy J., et al., 2023, @doi [The Astronomical Journal] 10.3847/1538-3881/acb212 , 165, 144
2023 doi
-
[43]
Springer, pp 183--191, @doi 10.1007/978-3-540-69398-7_23
Habing H., 1997, AGB and POST-AGB STARS: an Overview. Springer, pp 183--191, @doi 10.1007/978-3-540-69398-7_23
1997 doi
-
[44]
Hahn C., et al., 2023, @doi [The Astronomical Journal] 10.3847/1538-3881/accff8 , 165, 253
2023 doi
-
[45]
Hahn C., et al., 2024, @doi [The Astrophysical Journal] 10.3847/1538-4357/ad19c8 , 963, 56
2024 doi
-
[46]
Hawkins M., 2002, @doi [Monthly Notices of the Royal Astronomical Society] 10.1046/j.1365-8711.2002.04939.x , 329, 76
2002
-
[47]
G., 1975, @doi [Nature] 10.1038/254295a0 , 254, 295
Hills J. G., 1975, @doi [Nature] 10.1038/254295a0 , 254, 295
1975 doi
-
[48]
T., Shappee B
Hinkle J. T., Shappee B. J., Holoien T. W. S., 2024, @doi [Monthly Notices of the Royal Astronomical Society] 10.1093/mnras/stae022 , 528, 4775
2024 doi
-
[49]
W.-S., et al., 2016, @doi [Monthly Notices of the Royal Astronomical Society] 10.1093/mnras/stv2486 , 455, 2918
Holoien T. W.-S., et al., 2016, @doi [Monthly Notices of the Royal Astronomical Society] 10.1093/mnras/stv2486 , 455, 2918
2016 doi
-
[50]
M., Jørgensen I., AllingtonSmith J
Hook I. M., Jørgensen I., AllingtonSmith J. R., Davies R. L., Metcalfe N., Murowinski R. G., Crampton D., 2004, @doi [Publications of the Astronomical Society of the Pacific] 10.1086/383624 , 116, 425
2004 doi
-
[51]
Hung T., et al., 2018, @doi [The Astrophysical Journal Supplement Series] 10.3847/1538-4365/aad8b1 , 238, 15
2018 doi
-
[52]
I., Thuan T
Izotov Y. I., Thuan T. X., Privon G., 2012, @doi [Monthly Notices of the Royal Astronomical Society] 10.1111/j.1365-2966.2012.22051.x , 427, 1229
2012
-
[53]
Kauffmann G., et al., 2003, @doi [Monthly Notices of the Royal Astronomical Society] 10.1046/j.1365-8711.2003.06291.x , 341, 33
2003
-
[54]
Khabibullin I., Sazonov S., 2014, @doi [Monthly Notices of the Royal Astronomical Society] 10.1093/mnras/stu1491 , 444, 1041
2014 doi
-
[55]
S., 2016, @doi [Monthly Notices of the Royal Astronomical Society] 10.1093/mnras/stw1290 , 461, 371
Kochanek C. S., 2016, @doi [Monthly Notices of the Royal Astronomical Society] 10.1093/mnras/stw1290 , 461, 371
2016 doi
-
[56]
Koljonen K. I. I., et al., 2024, @doi [Monthly Notices of the Royal Astronomical Society] 10.1093/mnras/stae1466 , 532, 112
2024 doi
-
[57]
Komossa S., et al., 2008, @doi [The Astrophysical Journal] 10.1086/588281 , 678, L13
2008 doi
-
[58]
Komossa S., et al., 2009, @doi [The Astrophysical Journal] 10.1088/0004-637X/701/1/105 , 701, 105
2009 doi
-
[59]
Labrie K., Anderson K., C \'a rdenes R., Simpson C., Turner J. E. H., 2019, in Astronomical Data Analysis Software and Systems XXVII. p. 321
2019
- [60]
-
[61]
Li J., Wang Z.-X., Zheng D., Zhang J.-J., Zhu L.-T., Chen Z.-Y., 2023, @doi [Research in Astronomy and Astrophysics] 10.1088/1674-4527/acae6f , 23, 025012
2023 doi
-
[62]
Lin Z., Jiang N., Kong X., Huang S., Lin Z., Zhu J., Wang Y., 2022, @doi [The Astrophysical Journal Letters] 10.3847/2041-8213/ac9c63 , 939, L33
2022 doi
-
[63]
J., 2016, @doi [Monthly Notices of the Royal Astronomical Society] 10.1093/mnras/stw307 , 458, 575
Lu W., Kumar P., Evans N. J., 2016, @doi [Monthly Notices of the Royal Astronomical Society] 10.1093/mnras/stw307 , 458, 575
2016 doi
-
[64]
Magorrian J., Tremaine S., 1999, Mon. Not. R. Astron. Soc, 309, 447
1999
-
[65]
Mainzer A., et al., 2011, @doi [The Astrophysical Journal] 10.1088/0004-637X/743/2/156 , 743, 156
2011 doi
-
[66]
Mainzer A., et al., 2014, @doi [The Astrophysical Journal] 10.1088/0004-637X/792/1/30 , 792, 30
2014 doi
-
[67]
P., Ulmer M
Maksym W. P., Ulmer M. P., Eracleous M., 2010, @doi [The Astrophysical Journal] 10.1088/0004-637X/722/2/1035 , 722, 1035
2010 doi
-
[68]
P., Ulmer M
Maksym W. P., Ulmer M. P., Eracleous M. C., Guennou L., Ho L. C., 2013, @doi [Monthly Notices of the Royal Astronomical Society] 10.1093/mnras/stt1379 , 435, 1904
2013 doi
-
[69]
Malyali A., et al., 2021, @doi [Astronomy & Astrophysics] 10.1051/0004-6361/202039681 , 647, A9
2021 doi
-
[70]
Maraston C., et al., 2013, @doi [Monthly Notices of the Royal Astronomical Society] 10.1093/mnras/stt1424 , 435, 2764
2013 doi
-
[71]
Masterson M., et al., 2024, @doi [The Astrophysical Journal] 10.3847/1538-4357/ad18bb , 961, 211
2024 doi
-
[72]
J., McLure R
McLeod D. J., McLure R. J., Dunlop J. S., Cullen F., Carnall A. C., Duncan K., 2021, @doi [Monthly Notices of the Royal Astronomical Society] 10.1093/mnras/stab731 , 503, 4413
2021 doi
-
[73]
Mignoli M., et al., 2013, @doi [Astronomy & Astrophysics] 10.1051/0004-6361/201220846 , 556, A29
2013 doi
-
[74]
N., et al., 2024, @doi [The Astronomical Journal] 10.3847/1538-3881/ad45fe , 168, 95
Miller T. N., et al., 2024, @doi [The Astronomical Journal] 10.3847/1538-3881/ad45fe , 168, 95
2024 doi
-
[75]
E., Latimer L., Baldassare V., Salehirad S., 2021, @doi [The Astrophysical Journal] 10.3847/1538-4357/ac1ffa , 922, 155
Molina M., Reines A. E., Latimer L., Baldassare V., Salehirad S., 2021, @doi [The Astrophysical Journal] 10.3847/1538-4357/ac1ffa , 922, 155
2021 doi
-
[76]
Nagao T., Taniguchi Y., Murayama T., 2000, @doi [The Astronomical Journal] 10.1086/301411 , 119, 2605
2000 doi
-
[77]
Neustadt J. M. M., et al., 2020, @doi [Monthly Notices of the Royal Astronomical Society] 10.1093/mnras/staa859 , 494, 2538
2020 doi
-
[78]
Newsome M., et al., 2024, @doi [The Astrophysical Journal] 10.3847/1538-4357/ad8a69 , 977, 258
2024 doi
-
[79]
Nicholl M., et al., 2020, @doi [Monthly Notices of the Royal Astronomical Society] 10.1093/mnras/staa2824 , 499, 482
2020 doi
-
[80]
M., Berg D
Olivier G. M., Berg D. A., Chisholm J., Erb D. K., Pogge R. W., Skillman E. D., 2022, @doi [The Astrophysical Journal] 10.3847/1538-4357/ac8f2c , 938, 16
2022 doi
-
[81]
Onori F., et al., 2022, @doi [Monthly Notices of the Royal Astronomical Society] 10.1093/mnras/stac2673 , 517, 76
2022 doi
-
[82]
S., Wozniak P., Holl B., Željko Ivezić 2016, @doi [The Astrophysical Journal] 10.3847/0004-637X/819/2/151 , 819, 151
Palaversa L., Gezari S., Sesar B., Stuart J. S., Wozniak P., Holl B., Željko Ivezić 2016, @doi [The Astrophysical Journal] 10.3847/0004-637X/819/2/151 , 819, 151
2016 doi
-
[83]
M., Shiokawa H., 2015, @doi [The Astrophysical Journal] 10.1088/0004-637X/806/2/164 , 806, 164
Piran T., Svirski G., Krolik J., Cheng R. M., Shiokawa H., 2015, @doi [The Astrophysical Journal] 10.1088/0004-637X/806/2/164 , 806, 164
2015 doi
-
[84]
Poppett C., et al., 2024, @doi [The Astronomical Journal] 10.3847/1538-3881/ad76a4 , 168, 245
2024 doi
-
[85]
O., Doan S
Reefe M., Satyapal S., Sexton R. O., Doan S. M., Secrest N. J., Cann J. M., 2022, @doi [The Astrophysical Journal] 10.3847/1538-4357/ac8981 , 936, 140
2022 doi
-
[86]
J., 1988, @doi [Nature] 10.1038/333523a0 , 333, 523
Rees M. J., 1988, @doi [Nature] 10.1038/333523a0 , 333, 523
1988 doi
-
[87]
E., Volonteri M., 2015, @doi [The Astrophysical Journal] 10.1088/0004-637X/813/2/82 , 813, 82
Reines A. E., Volonteri M., 2015, @doi [The Astrophysical Journal] 10.1088/0004-637X/813/2/82 , 813, 82
2015 doi
-
[88]
N., 2015, @doi [Monthly Notices of the Royal Astronomical Society] 10.1093/mnras/stv113 , 448, 2900
Rose M., Elvis M., Tadhunter C. N., 2015, @doi [Monthly Notices of the Royal Astronomical Society] 10.1093/mnras/stv113 , 448, 2900
2015 doi
-
[89]
Roth N., Kasen D., Guillochon J., Ramirez-Ruiz E., 2016, @doi [The Astrophysical Journal] 10.3847/0004-637X/827/1/3 , 827, 3
2016 doi
-
[90]
G., 2021, @doi [Space Science Reviews] 10.1007/s11214-020-00759-7 , 217, 18
Saxton R., Komossa S., Auchettl K., Jonker P. G., 2021, @doi [Space Science Reviews] 10.1007/s11214-020-00759-7 , 217, 18
2021 doi
-
[91]
Sazonov S., et al., 2021, @doi [Monthly Notices of the Royal Astronomical Society] 10.1093/mnras/stab2843 , 508, 3820
2021 doi
-
[92]
F., et al., 2023, @doi [The Astronomical Journal] 10.3847/1538-3881/ad0832 , 166, 259
Schlafly E. F., et al., 2023, @doi [The Astronomical Journal] 10.3847/1538-3881/ad0832 , 166, 259
2023 doi
-
[93]
Short P., et al., 2023, @doi [Monthly Notices of the Royal Astronomical Society] 10.1093/mnras/stad2270 , 525, 1568
2023 doi
-
[94]
H., et al., 2023, @doi [The Astronomical Journal] 10.3847/1538-3881/ac9ab1 , 165, 9
Silber J. H., et al., 2023, @doi [The Astronomical Journal] 10.3847/1538-3881/ac9ab1 , 165, 9
2023 doi
-
[95]
A., et al., 2013, @doi [The Astronomical Journal] 10.1088/0004-6256/146/2/32 , 146, 32
Smee S. A., et al., 2013, @doi [The Astronomical Journal] 10.1088/0004-6256/146/2/32 , 146, 32
2013 doi
-
[96]
Smith N., et al., 2009, @doi [The Astrophysical Journal] 10.1088/0004-637X/695/2/1334 , 695, 1334
2009 doi
- [97]
-
[98]
Stern D., et al., 2012, @doi [The Astrophysical Journal] 10.1088/0004-637X/753/1/30 , 753, 30
2012 doi
-
[99]
C., Metzger B
Stone N. C., Metzger B. D., 2016, @doi [Monthly Notices of the Royal Astronomical Society] 10.1093/mnras/stv2281 , 455, 859
2016 doi
-
[100]
C., Ostriker J
Teboul O., Stone N. C., Ostriker J. P., 2023, @doi [Monthly Notices of the Royal Astronomical Society] 10.1093/mnras/stad3301 , 527, 3094
2023 doi
-
[101]
A., et al., 2004, @doi [The Astrophysical Journal] 10.1086/423264 , 613, 898
Tremonti C. A., et al., 2004, @doi [The Astrophysical Journal] 10.1086/423264 , 613, 898
2004 doi
-
[102]
Velzen van van Velzen S., 2018, @doi [The Astrophysical Journal] 10.3847/1538-4357/aa998e , 852, 72
2018 doi
-
[103]
R., 2014, @doi [The Astrophysical Journal] 10.1088/0004-637X/792/1/53 , 792, 53
Velzen van van Velzen S., Farrar G. R., 2014, @doi [The Astrophysical Journal] 10.1088/0004-637X/792/1/53 , 792, 53
2014 doi
-
[104]
W., Onori F., Hung T., Arcavi I., 2020, @doi [Space Science Reviews] 10.1007/s11214-020-00753-z , 216
Velzen van van Velzen S., Holoien T. W., Onori F., Hung T., Arcavi I., 2020, @doi [Space Science Reviews] 10.1007/s11214-020-00753-z , 216
2020 doi
-
[105]
R., Komossa S., Yan L., Kara E
Velzen van van Velzen S., Pasham D. R., Komossa S., Yan L., Kara E. A., 2021, @doi [Space Science Reviews] 10.1007/s11214-021-00835-6 , 217, 63
2021 doi
-
[106]
M., et al., 2024, @doi [arXiv.2408.17419] 10.48550/arXiv.2408.17419
Veres P. M., et al., 2024, @doi [arXiv.2408.17419] 10.48550/arXiv.2408.17419
2024 doi
-
[107]
Wang J., Merritt D., 2004, @doi [The Astrophysical Journal] 10.1086/379767 , 600, 149
2004 doi
-
[108]
Wang T.-G., Zhou H.-Y., Wang L.-F., Lu H.-L., Xu D., 2011, @doi [The Astrophysical Journal] 10.1088/0004-637X/740/2/85 , 740, 85
2011 doi
-
[109]
Wang T.-G., Zhou H.-Y., Komossa S., Wang H.-Y., Yuan W., Yang C., 2012, @doi [The Astrophysical Journal] 10.1088/0004-637X/749/2/115 , 749, 115
2012 doi
-
[110]
Wang Y., et al., 2022, @doi [The Astrophysical Journal Letters] 10.3847/2041-8213/ac6670 , 930, L4
2022 doi
-
[111]
L., et al., 2010, @doi [The Astronomical Journal] 10.1088/0004-6256/140/6/1868 , 140, 1868
Wright E. L., et al., 2010, @doi [The Astronomical Journal] 10.1088/0004-6256/140/6/1868 , 140, 1868
2010 doi
-
[112]
W., Wang T
Yang C. W., Wang T. G., Ferland G., Yuan W., Zhou H. Y., Jiang P., 2013, @doi [Astrophysical Journal] 10.1088/0004-637X/774/1/46 , 774
2013 doi
-
[113]
Yao Y., et al., 2023, @doi [The Astrophysical Journal Letters] 10.3847/2041-8213/acf216 , 955, L6
2023 doi
-
[114]
R., et al., 2014, @doi [The Astrophysical Journal] 10.1088/0004-637X/798/1/29 , 798, 29
Zeimann G. R., et al., 2014, @doi [The Astrophysical Journal] 10.1088/0004-637X/798/1/29 , 798, 29
2014 doi
-
[115]
write newline
" write newline "" before.all 'output.state := FUNCTION fin.entry write newline FUNCTION new.block output.state before.all = 'skip after.block 'output.state := if FUNCTION new.sentence output.state after.block = 'skip output.state before.all = 'skip after.sentence 'output.stat...
Reviewed August 10, 2026 · model on record in the stance chip above.
Discussion (0). Continue with ORCID to comment.