REVIEW 4 major objections 5 minor 27 references
Millikelvin-precision temperature sensing for advanced cryogenic detectors
T0 review · 4 major / 5 minor · reviewed 2026-08-07 · deepseek-v4-flash
Pith's one-line read This paper claims that a laboratory cross-calibration procedure brings platinum resistance thermometers to millikelvin precision in liquid argon, enough to measure the 15 mK gradients that reveal mixing and purity in large cryogenic…
desk verdict Solid metrology paper with genuinely useful long-term calibration data, but the mK precision claim should be read as an internal-consistency estimate until the thermal-homogeneity assumption inside the capsule is tested. read the letter →
The pith
A machine-rendered reading of the paper's core claim, the machinery that carries it, and where it could break.
The reading
What carries the argument
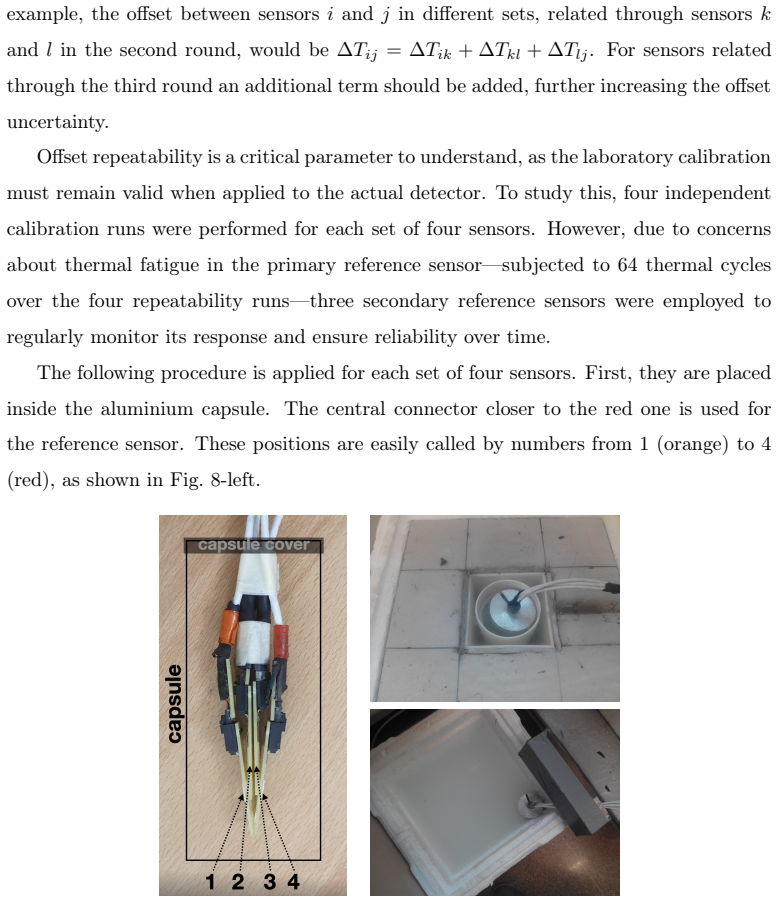
The load-bearing object is the calibration capsule: a thin-walled aluminum cylinder suspended inside nested insulating volumes, assumed isothermal during a run because all sensors in it are supposed to share one temperature. On top of that assumption the paper introduces two cross-calibration topologies: the reference method, in which every batch includes one common reference sensor, and the tree method, in which a few promoted sensors link batches in later rounds; the tree method wins because it needs no time-walk correction. The time-walk correction itself is a second piece of machinery, a linear parametrization of how the reference sensor's offset drifts with the number of thermal immersions, caused by thermal fatigue. The third component is the readout: a shared 1 mA current source and a multiplexed single 24-bit ADC channel with four-wire sensing, which suppresses electronic offsets between channels to below about 0.5 mK repeatability.
What would settle it
Take a set of sensors, hold them in the calibration capsule, and impose a controlled asymmetric temperature difference across the capsule by warming one wall with a small heater; if the derived offsets between sensors shift systematically with position or with the applied heat, the isothermality premise fails and the quoted calibration errors are underestimates.
Extended reading notes
Core claim
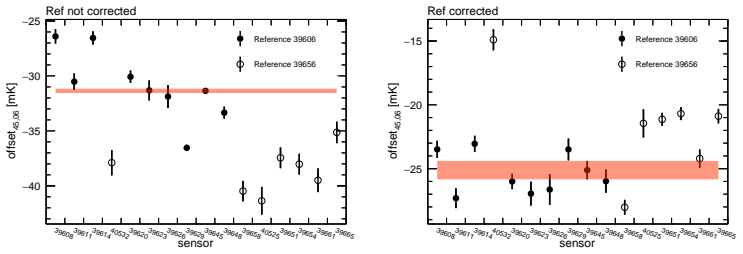
The central claim is that relative sensor offsets, not absolute temperatures, are what need to be calibrated, and that this can be done to millikelvin level by exposing batches of sensors to the same cryogenic bath. The authors built a calibration capsule with multiple insulating volumes and an aluminum inner vessel to make the thermal environment as homogeneous as possible, then cross-calibrated 48 sensors by two routes: a reference method that always compares against one sensor, and a tree method that chains offsets through promoted sensors. Although the tree method involves more intermediate steps, it avoids the drift of a single heavily cycled reference and turns out to be the more accurate route; after correcting the primary reference for a time-walk of 0.07 mK per immersion, growing to 0.22 mK per immersion, the two independent routes agree with a spread of 2.4 mK, giving an upper limit of 1.7 mK on the tree-method error. Re-calibrations after detector decommissioning, with an enlarged 14-sensor capsule, give a single-calibration error between 1.6 and 3.0 mK, no bias between liquid nitrogen and liquid argon, and no detectable ageing over five years.
Load-bearing premise
During every calibration run, all sensors inside the capsule are at exactly the same temperature; if a spatial gradient exists inside the capsule, every measured offset is biased, and the internal cross-check between the two methods cannot reveal it because both methods use the same capsule.
Editorial extensions
If this is right
- A grid of sensors calibrated this way can resolve the CFD-predicted 15 mK gradients in ProtoDUNE-SP, giving a data-driven check of argon mixing and purity.
- The calibration error (1.7 mK for the 2018 tree method, 1.6 to 3.0 mK for later campaigns) is less than half the 5 mK precision required for DUNE far-detector monitoring.
- Liquid nitrogen can be used for large-scale calibration instead of liquid argon: the 10 K difference in bath temperature does not bias the offsets.
- The absence of measurable ageing over five years means a single laboratory calibration can remain valid across the lifetime of a detector module.
- The scaled-up 14-sensor capsule makes it practical to calibrate the more than 500 sensors planned for the DUNE far detector.
Reading between the lines
- If the capsule is not truly isothermal, both calibration routes share the same bias, because both use the same capsule; a direct test would be to impose a known asymmetric heat load and see whether derived offsets move with sensor position.
- The calibration removes relative offsets, not absolute accuracy; vendor-level absolute accuracy of about 0.1 K remains, but for gradient and mixing diagnostics the relative precision is the physically relevant quantity.
- The same cross-calibration logic should transfer to other cryogenic liquids or systems where mixing and purity correlate with temperature, such as liquid-hydrogen or liquid-oxygen targets.
- The 4.3 mK spread between the 2018 and 2023 liquid-argon campaigns suggests that long-term reproducibility may be limited by uncorrected readout-channel offsets as much as by sensor ageing; future campaigns could isolate this by using identical readout channels for both measurements.
Editorial analysis
A structured set of objections, weighed in public.
Referee Report
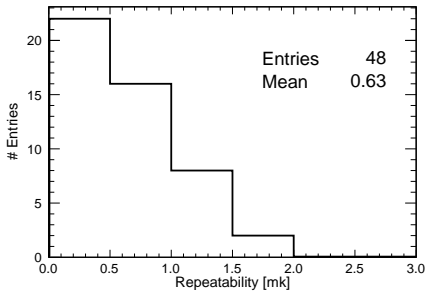
Summary. The paper describes a cross-calibration technique for PT102 platinum RTDs used in the ProtoDUNE-SP temperature monitoring system. Sensors are calibrated in sets inside an aluminum capsule immersed in LAr (and later LN2), using either a reference method or a tree method to relate all sensors to a common reference. The authors report repeatabilities of 0.6–2.3 mK, apply a time-walk correction for reference-sensor fatigue, estimate calibration errors of 1.7 mK for the 2018 campaign and 1.6–3.0 mK for later campaigns, and compare four calibration campaigns to study ageing and liquid dependence. The central claim is that the calibration achieves millikelvin-level precision, stated in the abstract as 'an unprecedented precision of 2.5 mK'. The manuscript includes detailed hardware descriptions, multiple independent calibration campaigns, and internal cross-checks, but the precision claim rests on an untested assumption of thermal homogeneity inside the capsule.
Significance. If the claimed precision is robust, the technique is genuinely useful for DUNE and other LArTPCs: a dense grid of sensors cross-calibrated to a few mK would allow measuring the ~15 mK vertical temperature gradients predicted by CFD, providing a data-driven check of argon mixing and impurity maps without placing purity monitors in the active volume. The paper also provides useful information on RTD ageing, readout offset characterization, and the comparison of LAr versus LN2 calibration media. The work includes multiple calibration campaigns, quantitative repeatability distributions, and an explicit attempt to estimate systematic errors. However, the central precision claim is not fully supported by the presented evidence, because the dominant potential systematic—thermal gradients inside the calibration capsule—is assumed away rather than measured, and the internal cross-check between the two methods uses the same capsule and therefore cannot detect such a common bias.
major comments (4)
- [Abstract and Sec. 4.3.5 / Sec. 5.4] The abstract claims 'an unprecedented precision of 2.5 mK', but the body does not present 2.5 mK as the central estimate. Section 4.3.5 concludes an upper limit of 1.7 mK for the tree method in 2018, and Section 5.4 estimates the single-calibration error in LAr to lie between 1.6 and 3.0 mK. The abstract's number appears nowhere in the quantitative error analysis; it should either be derived explicitly or the abstract should quote the body's actual range, otherwise the headline claim is misleading.
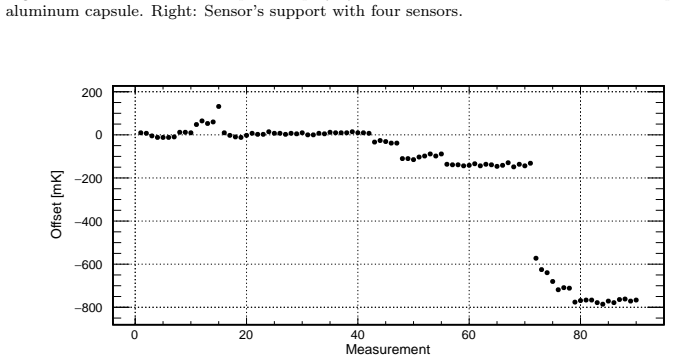
- [Sec. 4.2 and Sec. 4.3.5] The calibration procedure assumes that 'all sensors in the capsule are at the same temperature' (Sec. 4.2). The paper provides no independent validation of this assumption, and its own data suggest position-dependent thermal structure: Fig. 10 shows different time patterns for positions 1 and 4 versus position 2, and Sec. 5.2 reports that corona-reference offsets are larger and noisier than corona-corona offsets. Since both the reference method and the tree method are calibrated in the same capsule with the same assumption, the cross-check of Sec. 4.3.5 (2.4 mK spread) cancels any common spatial gradient and therefore underestimates the true systematic uncertainty. The claimed 1.7 mK upper limit is thus not established.
- [Sec. 5.1 and Sec. 5.2] The post-2020 setup assumes rotational symmetry of convection inside the capsule so that the 12 corona sensors are at the same temperature. This assumption is load-bearing for the 1.6–3.0 mK error estimates of the 2022–2023 campaigns, yet it is only supported by the qualitative observation that corona-corona offsets are more stable than corona-reference offsets (Fig. 17). Fig. 20 shows that repeatability depends on corona position, which indicates that the assumed symmetry is not exact. Without a quantitative test of the symmetry assumption, the stated calibration error for the new setup is not fully justified.
- [Sec. 3 and Sec. 5.4] The readout offset correction is a key systematic: Sec. 3 shows channel offsets up to 2.5 mK and states that this correction was applied only in the post-2018 campaigns. The 2018 calibration therefore contains an uncorrected readout contribution, which is acknowledged in the LAr-2018 vs LAr-2023 comparison (std dev 4.3 mK). This means that the 2018 value of 1.7 mK is an underestimate of the total error, and the abstract's 2.5 mK cannot be taken as the precision achieved in 2018. The paper should explicitly state which error estimate, if any, corresponds to the abstract claim and whether the 2.5 mK includes the readout offset correction.
minor comments (5)
- [Sec. 3] There is a typo: 'thse two measurements' should be 'these two measurements'.
- [Sec. 2] The word 'Resitance' is misspelled; it should be 'Resistance'.
- [Sec. 5.3] The phrase 'sligthly worst' should be 'slightly worse'.
- [Fig. 12 and Sec. 4.3.2] The axis label 'Inmersions' is a typo for 'Immersions', and the unit 'mk' should be 'mK' consistently throughout the figures.
- [Sec. 4.2] The sentence about the calibration run 'actually begins at that point and lasts for 40 minutes' is clear, but it would help to state explicitly how the 1000–2000 s stable interval (Sec. 4.3.1) relates to the 40-minute run, since the run start time is defined relative to capsule immersion.
Circularity Check
No circular derivation; one minor non-load-bearing self-citation, plus a shared-assumption caveat that is a systematic limitation rather than circularity.
full rationale
The paper's calibration chain is experimental rather than derivational: sensor offsets are measured under a stated common-temperature assumption, repeatability is computed as the standard deviation of repeated runs, the tree-vs-reference cross-check compares two measurement graphs against a directly measured reference-reference offset, and the campaign comparisons use time-separated re-measurements. None of these quantities is defined in terms of the claimed 2.5 mK precision, and no prediction is fitted to the data it is supposed to validate. The only self-citation, [21] (the Master's thesis of one of the authors), is used to identify the static TGM hardware and is not load-bearing; the calibration procedure and error estimates are presented in the paper itself. The main caveat is that both calibration methods share the same capsule and the same assumption of intra-capsule thermal homogeneity (Sec. 4.2), and the post-2020 setup further assumes rotational symmetry of convection (Sec. 5.1); a common-mode spatial gradient would therefore not be detected by the internal cross-check in Sec. 4.3.5. This is an important systematic-uncertainty limitation, but it is not a circular derivation: the precision estimate is an uncertainty estimate from repeatability and cross-campaign comparisons, not a quantity equivalent by construction to its own inputs.
Assumptions & free parameters
free parameters (6)
- Time-walk slope for reference sensor 39606 before breakpoint =
0.072 ± 0.003 mK/immersion
- Time-walk slope for reference sensor 39606 after breakpoint =
0.223 ± 0.007 mK/immersion
- Time-walk breakpoint for sensor 39606 =
63.5 immersions
- Time-walk slope for reference sensor 39656 =
0.168 ± 0.007 mK/immersion
- Offset between reference sensors 39656 and 39606 at zero immersions =
-9.19 ± 0.13 mK
- Readout channel offsets =
up to 2.5 mK (channel 7 vs others), below 1 mK between other channels
assumptions (6)
- domain assumption All sensors in the calibration capsule are at the same temperature during a run.
- domain assumption Convection inside the new capsule has rotational symmetry, so corona sensors at the same height share temperature.
- domain assumption The resistance of the two precision resistors is constant across the two measurements used to compute readout offsets.
- ad hoc to paper Thermal fatigue of the primary reference sensor is the only time-dependent source of offset drift, so a linear time-walk model represents all sensors.
- domain assumption Calibration constants measured in LAr and LN2 are valid at the absolute temperatures encountered in ProtoDUNE-SP.
- domain assumption The vendor-supplied PT102 sensor response, expressed through the Van Dusen equation, is accurate enough after relative offsets are applied.
Cite this review
Pith. "Pith review of Millikelvin-precision temperature sensing for advanced cryogenic detectors." pith.science (2026). https://pith.science/paper/WH6XQREV
@misc{pith2026250606022,
  author       = {Pith},
  title        = {Pith review of: Millikelvin-precision temperature sensing for advanced cryogenic detectors},
  year         = {2026},
  howpublished = {\url{https://pith.science/paper/WH6XQREV}},
  note         = {Machine review of arXiv:2506.06022}
}
read the original abstract
Precise temperature monitoring -- to the level of a few milli-Kelvin -- is essential for the operation of large-scale cryostats requiring a recirculation system. In particular, the performance of Liquid Argon Time Projection Chambers -- such as those planned for the DUNE experiment -- strongly relies on proper argon purification and mixing, which can be characterized by a sufficiently dense grid of high-precision temperature probes. In this article, we present a novel technique for the cross-calibration of Resistance Temperature Detectors in cryogenic liquids, developed as part of the temperature monitoring system for a DUNE prototype. This calibration has enabled the validation and optimization of the system's components, achieving an unprecedented precision of 2.5 mK.
Figures


Figures from the paper (19 more)









Reference graph
Works this paper leans on
-
[1]
B. Abi, et al., Deep Underground Neutrino Experiment (DUNE), Far Detector Tech- nicalDesignReport, VolumeIIntroductiontoDUNE,JINST15(08)(2020)T08008. arXiv:2002.02967,doi:10.1088/1748-0221/15/08/T08008. 28
arXiv 2020
-
[2]
Abi, et al., Long-baseline neutrino oscillation physics potential of the DUNE experiment, Eur
B. Abi, et al., Long-baseline neutrino oscillation physics potential of the DUNE experiment, Eur. Phys. J. C 80 (10) (2020) 978.arXiv:2006.16043,doi:10.1140/ epjc/s10052-020-08456-z
arXiv 2020
-
[3]
B. Abi, et al., Deep Underground Neutrino Experiment (DUNE), Far Detector Tech- nical Design Report, Volume II: DUNE Physics (2 2020).arXiv:2002.03005
arXiv 2020
-
[4]
Abi, et al., Supernova neutrino burst detection with the Deep Underground Neutrino Experiment, Eur
B. Abi, et al., Supernova neutrino burst detection with the Deep Underground Neutrino Experiment, Eur. Phys. J. C 81 (5) (2021) 423.arXiv:2008.06647,doi: 10.1140/epjc/s10052-021-09166-w
arXiv 2021
-
[5]
B. Abi, et al., Prospects for beyond the Standard Model physics searches at the Deep Underground Neutrino Experiment, Eur. Phys. J. C 81 (4) (2021) 322.arXiv: 2008.12769,doi:10.1140/epjc/s10052-021-09007-w
arXiv 2021
-
[6]
Amerio, et al., Design, construction and tests of the ICARUS T600 detector, Nucl
S. Amerio, et al., Design, construction and tests of the ICARUS T600 detector, Nucl. Instrum. Meth. A 527 (2004) 329–410.doi:10.1016/j.nima.2004.02.044
-
[7]
R. Acciarri, et al., Design and Construction of the MicroBooNE Detector, JINST 12 (02) (2017) P02017.arXiv:1612.05824,doi:10.1088/1748-0221/12/02/ P02017
arXiv 2017
-
[8]
Abi, et al., The Single-Phase ProtoDUNE Technical Design Report (6 2017)
B. Abi, et al., The Single-Phase ProtoDUNE Technical Design Report (6 2017). arXiv:1706.07081
arXiv 2017
Show all 27 references
-
[9]
B. Abi, et al., Deep Underground Neutrino Experiment (DUNE), Far Detec- tor Technical Design Report, Volume IV: Far Detector Single-phase Technology, JINST 15 (08) (2020) T08010.arXiv:2002.03010,doi:10.1088/1748-0221/15/ 08/T08010
2020
-
[10]
B. Abi, et al., First results on ProtoDUNE-SP liquid argon time projection chamber performance from a beam test at the CERN Neutrino Platform, JINST 15 (12) (2020) P12004.arXiv:2007.06722,doi:10.1088/1748-0221/15/12/P12004
2020
-
[11]
A. A. Abud, et al., Design, construction and operation of the ProtoDUNE-SP Liquid Argon TPC, JINST 17 (01) (2022) P01005.arXiv:2108.01902,doi:10.1088/ 1748-0221/17/01/P01005. 29
2022
-
[12]
Xiao, Purity monitoring for ProtoDUNE-SP, J
Y. Xiao, Purity monitoring for ProtoDUNE-SP, J. Phys. Conf. Ser. 2156 (2021) 012211.doi:10.1088/1742-6596/2156/1/012211
2021 doi
-
[13]
Adamowski, et al., The Liquid Argon Purity Demonstrator, JINST 9 (2014) P07005.arXiv:1403.7236,doi:10.1088/1748-0221/9/07/P07005
M. Adamowski, et al., The Liquid Argon Purity Demonstrator, JINST 9 (2014) P07005.arXiv:1403.7236,doi:10.1088/1748-0221/9/07/P07005
2014 arXiv
-
[14]
D. L. Adams, et al., Design and performance of a 35-ton liquid argon time projection chamberasaprototypeforfutureverylargedetectors, JINST15(03)(2020)P03035. arXiv:1912.08739,doi:10.1088/1748-0221/15/03/P03035
2020 arXiv
-
[15]
A. Hahn, M. Adamowski, D. Montanari, B. Norris, J. Reichenbacher, R. Rucinski, J. Stewart, T. Tope, The LBNE 35 Ton Prototype Cryostat, in: 2014 IEEE Nuclear ScienceSymposiumandMedicalImagingConferenceand21stSymposiumonRoom- Temperature Semiconductor X-ray and Gamma-ray Detect...
2014
-
[16]
URLhttps://www.minco.com/wp-content/uploads/Resistance-Thermometry
Minco, Resistance thermometry, last visited: 2023-05-18. URLhttps://www.minco.com/wp-content/uploads/Resistance-Thermometry. pdf
2023
-
[17]
URLhttps://www.lakeshore.com/products/categories/overview/ temperature-products/cryogenic-temperature-sensors/platinum
LakeShore, Platinum sensors applications, last visited: 2023-05-18. URLhttps://www.lakeshore.com/products/categories/overview/ temperature-products/cryogenic-temperature-sensors/platinum
2023
-
[18]
URLhttps://www.molex.com/en-us/products/part-detail/0014562042? display=pdf
Molex, Idc-4 male connector, last visited: 2025-06-05. URLhttps://www.molex.com/en-us/products/part-detail/0014562042? display=pdf
2025
-
[19]
URLhttps://www.molex.com/en-us/products/part-detail/0015943043? display=pdf
Molex, Idc-4 female connector, last visited: 2025-06-05. URLhttps://www.molex.com/en-us/products/part-detail/0015943043? display=pdf
2025
-
[20]
URLhttps://www.axon-cable.com/en/00_home/00_start/00/index.aspx
Axon, Axon custom cables, last visited: 2022-10-01. URLhttps://www.axon-cable.com/en/00_home/00_start/00/index.aspx
2022
-
[21]
M. A. García-Peris, ProtoDUNE T-Gradient development and calibration, Master’s thesis, Valencia U. (7 2018).doi:10.2172/1780813. 30
2018 doi
-
[22]
Chojnacki, A Multiplexed RTD Temperature Map System for Multi-Cell SRF Cavities, in: SRF2009, Vol
E. Chojnacki, A Multiplexed RTD Temperature Map System for Multi-Cell SRF Cavities, in: SRF2009, Vol. TUPPO033, 2009, p. 232
2009
-
[23]
application bulletin, Implementation and applications of current sources and current receivers, last visited: 2024-04-02
B.-B. application bulletin, Implementation and applications of current sources and current receivers, last visited: 2024-04-02. URLhttps://www.ti.com/lit/an/sboa046/sboa046.pdf?ts=1712062207089
2024
-
[24]
URLhttps://download.tek.com/datasheet/1KW-73954-1_2001-2002_DMM_ Datasheet_080323.pdf
Tektronix, Keithley 2001 digit high performance multimeter, last visited: 2024-04- 02. URLhttps://download.tek.com/datasheet/1KW-73954-1_2001-2002_DMM_ Datasheet_080323.pdf
2001
-
[25]
Instruments, Compactrio systems, last visited: 2024-04-02
N. Instruments, Compactrio systems, last visited: 2024-04-02. URLhttps://www.ni.com/es/shop/compactrio.html
2024
-
[26]
Instruments, Ni-9238, last visited: 2024-04-02
N. Instruments, Ni-9238, last visited: 2024-04-02. URLhttps://www.ni.com/es-es/shop/model/ni-9238.html
2024
-
[27]
URLhttps://tempsens.com/catalog/cables-wires/rtd-triad-cables.html 31
Tempsens, Rtd cables, last visited: 2024-03-15. URLhttps://tempsens.com/catalog/cables-wires/rtd-triad-cables.html 31
2024
Reviewed August 7, 2026 · model on record in the stance chip above.
Discussion (0). Continue with ORCID to comment.