REVIEW 3 major objections 4 minor 46 references
As A Matter of State: The role of thermodynamics in magnetohydrodynamic turbulence
T0 review · 3 major / 4 minor · reviewed 2026-08-14 · deepseek-v4-flash
Pith's one-line read Thermodynamics weakens density–magnetic field link in turbulence
desk verdict Solid, systematic MHD turbulence study on thermodynamics; the main trends hold, but the runaway-cooling run must be explicitly excluded from the fits. read the letter →
The pith
A machine-rendered reading of the paper's core claim, the machinery that carries it, and where it could break.
The reading
What carries the argument
The load-bearing tool is a suite of 30 ideal MHD simulations of stationary, thermally balanced turbulence, run with two idealized optically thin cooling functions—linear cooling $L\propto\rho e$ and free-free-like cooling $L\propto\rho^2 e^{1/2}$—with the cooling coefficient chosen to balance turbulent dissipation. The analysis rests on correlation coefficients and probability density functions (mean, standard deviation, skewness, kurtosis) of density, thermal pressure, total pressure, and a Faraday-rotation-derived line-of-sight magnetic field strength, computed over 51 snapshots in the stationary regime ($5T\le t\le10T$). The key relations are the $\rho$–$B$ anticorrelation, whose dependence on $\gamma$ and cooling encodes the shift in the compressible mode balance, and the constant $p_{\rm th}$–$p_B$ anticorrelation that signals total-pressure equilibrium.
What would settle it
Run the same turbulence suite with a realistic, tabulated optically thin cooling curve for a specific plasma such as the intracluster medium, and compare the density–magnetic field correlation coefficients and the density-fluctuation versus Mach number slopes: if the ordering by $\gamma$ weakens, reverses, or vanishes, the idealized cooling functions are responsible for the claimed degeneracy.
Extended reading notes
Core claim
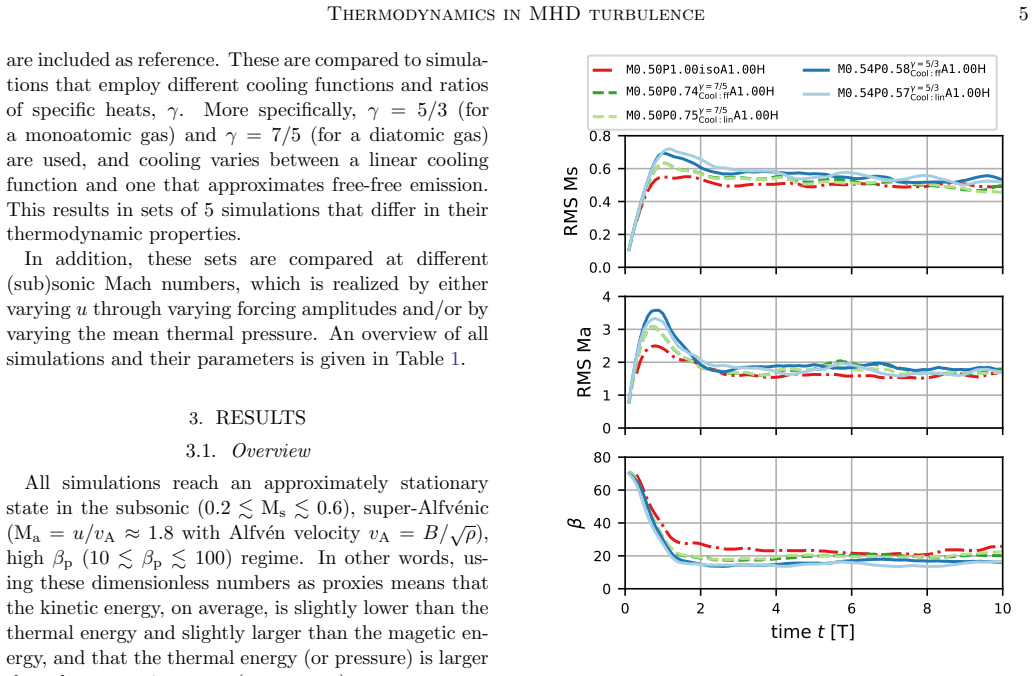
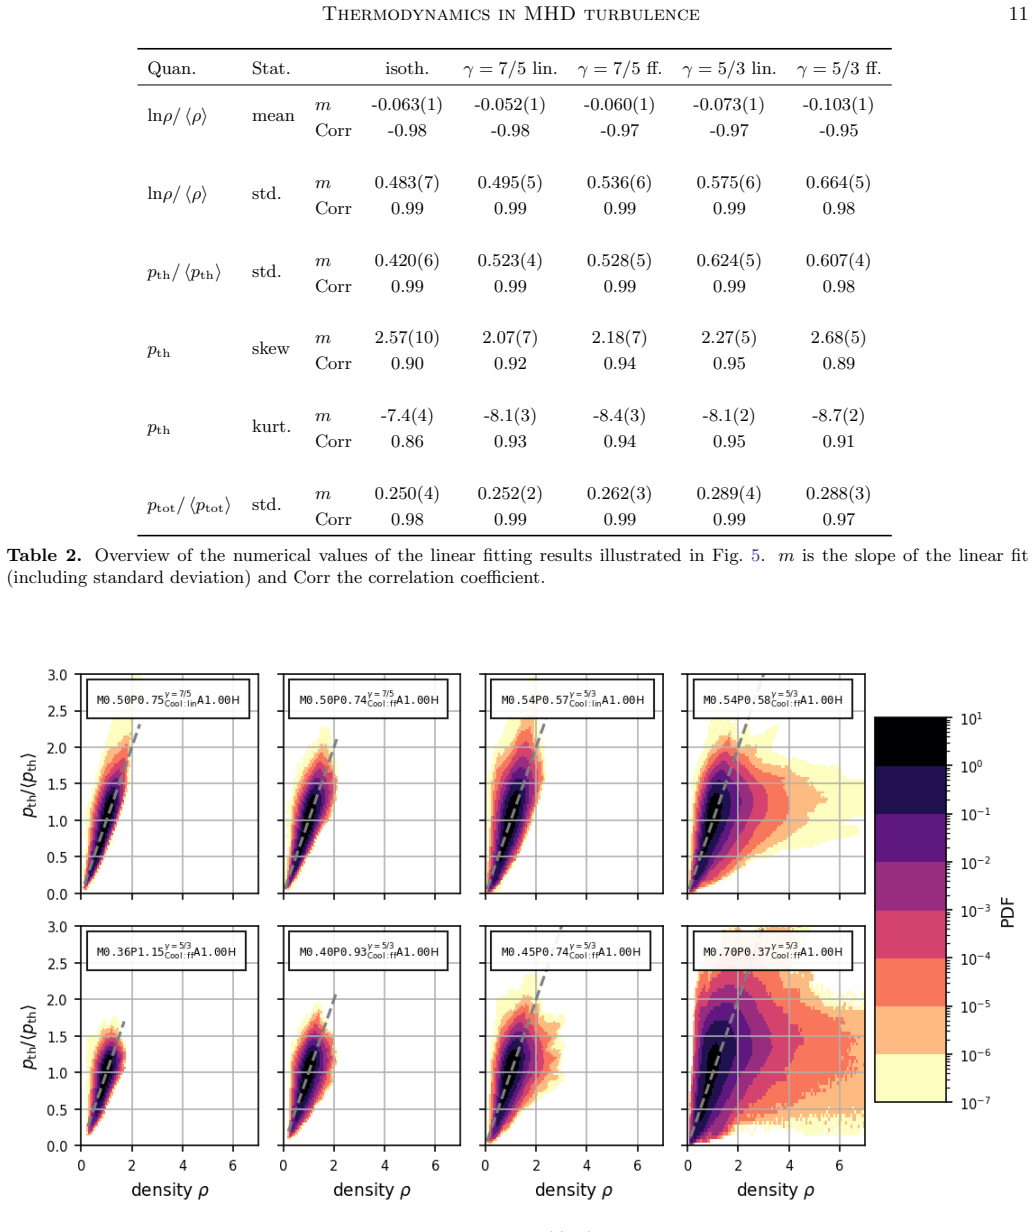
In the regime studied—subsonic ($M_s\approx0.2$–$0.6$), super-Alfvénic ($M_a\approx1.8$), and high plasma $\beta$ ($10\lesssim\beta_p\lesssim100$)—the thermal–magnetic pressure anticorrelation is essentially fixed near $-0.8$ regardless of thermodynamics, indicating total-pressure equilibrium. The density–magnetic field anticorrelation, however, is set primarily by the adiabatic index: about $-0.81$ for isothermal gas, $-0.71$ for $\gamma=7/5$, and $-0.64$ (linear cooling) or $-0.55$ (free-free cooling) for $\gamma=5/3$. The linear relation between the standard deviation of logarithmic density and sonic Mach number steepens with $\gamma$, from a slope near $0.48$ in the isothermal case to about $0.66$ for $\gamma=5/3$ with free-free cooling. Because Mach number and thermodynamics shift these relations in the same direction, the authors conclude that inferring Mach numbers from such statistics alone is degenerate, but that higher-order moments may separate the two effects.
Load-bearing premise
The load-bearing premise is that the two idealized cooling functions and the dissipation-balance condition lose energy the way real optically thin plasmas do, closely enough that the reported dependence on $\gamma$ is generic rather than an artifact of the chosen cooling forms.
Editorial extensions
If this is right
- Observational estimates of sonic Mach number from density fluctuation amplitudes carry a hidden thermodynamic dependence: the same slope can correspond to different combinations of $\gamma$ and $M_s$.
- Faraday-rotation-based line-of-sight field strengths stay within about 10 percent of the true field in this regime, so the thermodynamic effect is unlikely to dominate measurement error there.
- The $\rho$–$B$ anticorrelation is not a clean slow-mode diagnostic outside isothermal turbulence, because its strength changes with $\gamma$ and cooling.
- Higher-order moments, especially the skewness of the density distribution, are nearly independent of $M_s$ and mainly track $\gamma$, offering a path to break the degeneracy.
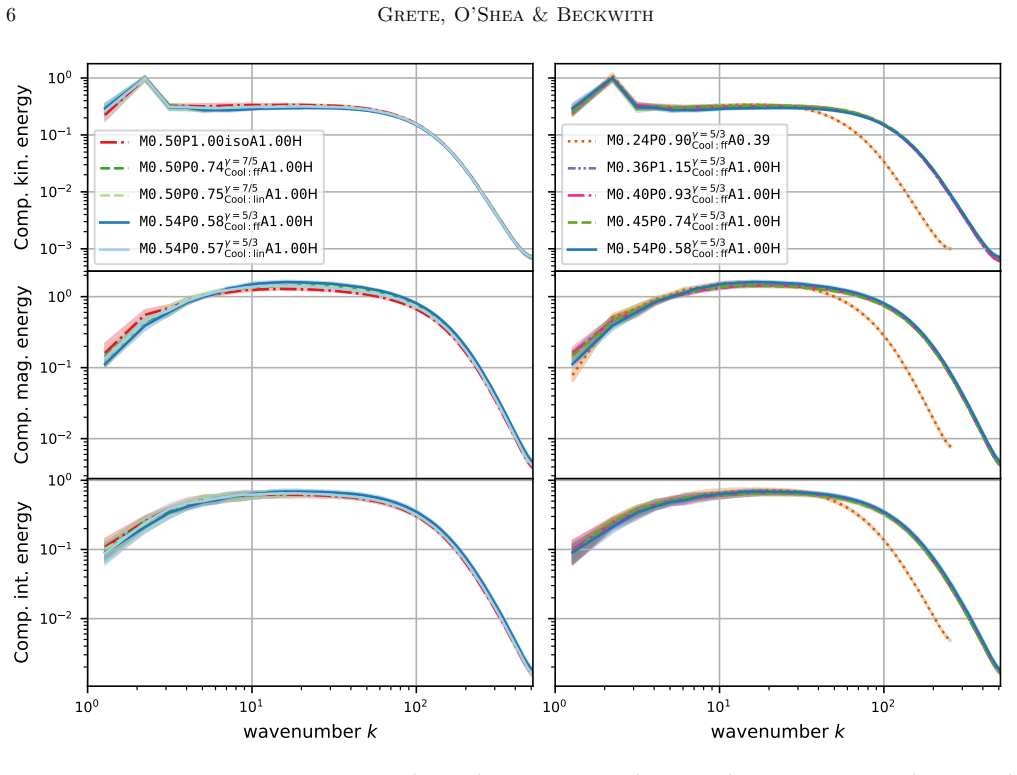
- Kinetic, magnetic, and internal energy spectra are practically identical across equations of state, so spectral shape alone cannot reveal the thermodynamics.
Reading between the lines
- We infer that published $M_s$ estimates from intracluster-medium-like observations should carry an additional systematic uncertainty for unknown $\gamma$; the slopes reported here provide a first table for quantifying it.
- A testable extension would be to repeat the analysis with a realistic, tabulated cooling curve: if the ordering by $\gamma$ persists, the idealized cooling functions are not the controlling factor.
- The weakening $\rho$–$B$ anticorrelation implies a shift in the mix of slow and fast magnetosonic modes with $\gamma$; synthetic polarization or Faraday rotation maps could search for that shift in observed clusters.
- We infer that the degeneracy should strengthen in the supersonic regime, where density fluctuations are larger, so extending this suite to higher $M_s$ would sharpen or refute the higher-moment diagnostic.
Signed reviews
Editorial analysis
A structured set of objections, weighed in public.
Referee Report
Summary. This paper presents a suite of 30 ideal MHD simulations of driven, thermally balanced turbulence in the subsonic, super-Alfvenic, high-beta regime, with the equation of state varied between approximately isothermal, gamma = 7/5, and gamma = 5/3, and with no cooling, linear cooling, or free-free-like cooling used to balance turbulent dissipation. The central results are that the energy spectra are insensitive to thermodynamics, that the thermal-magnetic pressure anticorrelation is essentially independent of gamma and cooling (about -0.8), while the density-magnetic field anticorrelation weakens systematically with increasing gamma (from about -0.8 isothermal to about -0.55 for gamma = 5/3 with free-free cooling), and that the slopes of the linear relations between density/pressure fluctuation amplitudes and sonic Mach number steepen with gamma. The paper argues this creates a degeneracy between thermodynamics and Mach number in interpreting observations, which may be broken by higher-order moments.
Significance. If the reported gamma-dependences are robust, this is a useful and timely quantification of a usually neglected thermodynamic axis in MHD turbulence simulations, with direct implications for interpreting Faraday-rotation-based and density-fluctuation-based diagnostics in ICM-like plasmas. The study is carefully set up: it uses a fixed numerical scheme with resolution pairs at 512^3 and 1024^3, an explicit stationarity interval (5T-10T), a published code fork, and a candid limitations section that acknowledges the idealized cooling functions and the narrow parameter range. The comparison to previous isothermal and hydrodynamic work (Nolan et al. 2015; Mohapatra & Sharma 2019) is useful. The main caveat is that the quantitative slopes and the cooling-function dependence rest on a small number of simulations and, as detailed below, on the treatment of one non-stationary run.
major comments (3)
- [Secs. 2.3, 3.3, and Tables 1-2] The manuscript does not state whether the non-stationary, runaway-cooling run M0.70P0.37gamma=5/3 Cool:ff A1.00H is included in the regressions of Table 2 and in the correlation and moment plots. Section 2.3 restricts all statistical results to the stationary interval 5T <= t <= 10T, but Table 1 gives only final values at t = 4T for this run, while Sec. 3.3 says moments are computed for all snapshots of all 30 simulations and that regressions use all outputs of all simulations. If the runaway run contributes, the high-Ms endpoint that anchors the gamma=5/3 free-free slope m = 0.664(5) is a transient thermal-instability tail rather than balanced turbulence, so the steepening with gamma and the weakened rho-B anticorrelation would not be clean thermodynamic statements. Please state explicitly whether this run is excluded, and if so, report the fitted slopes and correlations with the run excluded; the gamma=5/3 free-free branch is also described as only marginally stable at Ms ~ 0.5, so the sensitivity of the fits to this branch's stability should be quantified.
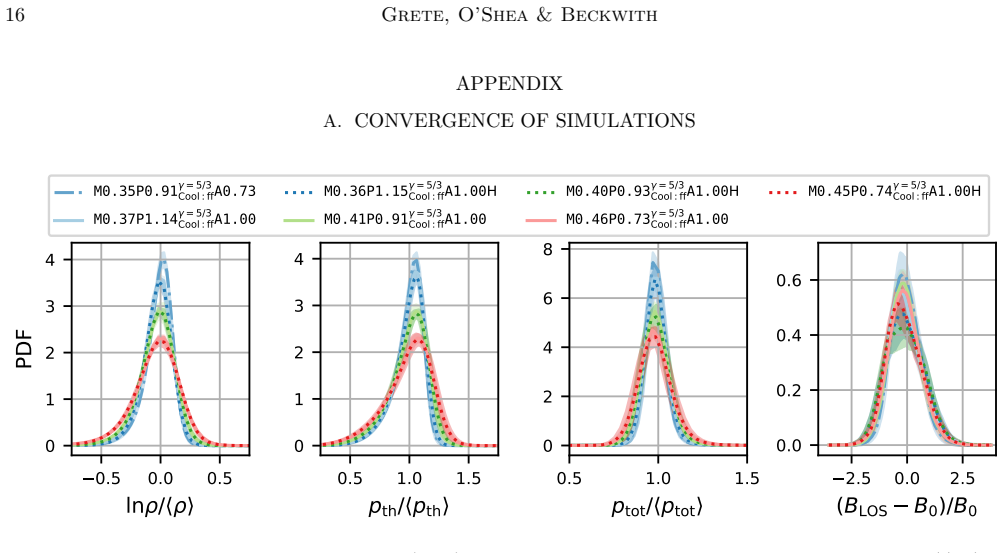
- [Sec. 3.2 and Appendix A] The text states that higher resolution leads to slightly weaker rho-B anticorrelations of about the same order as the cooling functions, yet no numerical estimate of this resolution effect is given, and Appendix A demonstrates convergence only for PDFs, not for the correlation coefficients. Because the cooling-function difference at fixed gamma (e.g., -0.64(3) for linear versus -0.55(3) for free-free at gamma = 5/3) is one of the paper's quantitative results, please report the resolution-pair differences from the gray-shaded simulations in Fig. 3 and show explicitly that the cooling trend survives after accounting for resolution.
- [Sec. 3.3 and Table 2] The slopes in Table 2 are fit to 51 temporally correlated snapshots per simulation, with only 3-4 simulations per EOS/cooling combination (and 15-16 for gamma = 5/3 free-free) over the narrow range 0.2 < Ms < 0.6. The quoted standard errors, e.g., 0.664(5), therefore reflect within-run scatter rather than simulation-to-simulation variance, and the comparisons of slopes across EOS and cooling functions may not be statistically robust. Please provide a fit or bootstrap that treats each simulation as an independent sample, for example using time-averaged moments per run, or otherwise quantify the inter-run uncertainty.
minor comments (4)
- [Abstract and Sec. 4.2] The abstract and Sec. 4.2 contain awkward or ungrammatical phrasings such as the physical properties turbulence and Similarly, with the linear relation between variations in density and thermal pressure with sonic Mach number becomes steeper with increasing gamma; these should be corrected.
- [Sec. 3.3 and Table 2] Section 3.3 states that linear fits are performed only when the absolute correlation exceeds 0.9, but Table 2 includes a fit for the isothermal pth kurtosis with Corr = 0.86; please reconcile the criterion with the reported fits.
- [Fig. 7 caption] The caption of Fig. 7 is internally inconsistent about line styles, referring to solid, dashed, and dotted lines in ways that do not agree with the described convergence comparison; the visual distinction between 512^3 and 1024^3 runs should be made unambiguous.
- [Table 1] The runaway run M0.70P0.37gamma=5/3 Cool:ff A1.00H is listed without temporal standard deviations; a brief footnote explaining that these are single-epoch final values would help avoid confusion with the stationary rows.
Circularity Check
No significant circularity: all reported trends are measured simulation outputs, with cooling coefficients as input controls and no fitted parameter renamed as a prediction.
full rationale
The paper's central results are empirical outputs of a simulation suite, not quantities derived from assumptions that already contain them. The adiabatic index gamma and the cooling functions (Eqs. 5 and 6) are prescribed inputs; the cooling coefficient Ccool is chosen through Eq. (7) only to balance turbulent dissipation, and it is never fitted to the reported correlation coefficients or slopes. The density--magnetic-field correlations, PDF moments, and linear fits in Table 2 are computed from the simulated stationary-regime data, so they are not equivalent to the input parameters by construction. The conclusion that the rho--B anticorrelation weakens 'by construction' under a total-pressure equilibrium is a physical interpretation of the measured trend, not a circular derivation. Self-citations, such as Grete et al. (2018) for the stochastic forcing scheme and for the isothermal rho--B anticorrelation, are not load-bearing: the isothermal reference case is independently reproduced in this paper's own run M0.50P1.00isoA1.00H, and the forcing scheme is a numerical method rather than a premise that implies the paper's new findings. The paper also explicitly acknowledges its idealized cooling functions and qualitative scope in Sec. 4.3, which further confirms that the results are presented as empirical trends rather than forced identities. The reviewer's concern about the runaway-cooling run M0.70P0.37gamma=5/3 Cool:ff A1.00H is a potential data-selection or robustness issue, not a circularity issue, because including or excluding that run changes which measured points enter a regression; it does not make the regression equivalent to its inputs. Overall, the derivation chain is self-contained: simulations produce the statistics, and the statistics are not tautologically encoded in the setup.
Assumptions & free parameters
free parameters (2)
- Cooling coefficient Ccool =
0.018 to 0.412 (per simulation, Table 1)
- Forcing amplitude a =
0.25 to 1.56 (RMS power, Table 1)
assumptions (6)
- domain assumption Ideal MHD equations (Eqs. 1-4) with an ideal gas EOS are the governing model.
- domain assumption The stochastic forcing is purely solenoidal with a parabolic spectrum peaking at k=2 and represents astrophysical driving.
- domain assumption The idealized cooling functions (linear, Eq. 5, and free-free-like, Eq. 6) approximate optically thin cooling in real plasmas.
- domain assumption Numerical dissipation from the finite-volume scheme behaves like explicit viscosity and resistivity (implicit LES).
- domain assumption Statistics in the stationary regime (5T to 10T) are converged in resolution and sampling.
- domain assumption The Fourier decomposition using sqrt(rho) u and sqrt(rho) c_s is valid despite violating the inviscid criterion.
Cite this review
Pith. "Pith review of As A Matter of State: The role of thermodynamics in magnetohydrodynamic turbulence." pith.science (2026). https://pith.science/paper/WMJJJLXV
@misc{pith2026190803989,
  author       = {Pith},
  title        = {Pith review of: As A Matter of State: The role of thermodynamics in magnetohydrodynamic turbulence},
  year         = {2026},
  howpublished = {\url{https://pith.science/paper/WMJJJLXV}},
  note         = {Machine review of arXiv:1908.03989}
}
abstract
Turbulence simulations play a key role in advancing the general understanding of the physical properties turbulence and in interpreting astrophysical observations of turbulent plasmas. For the sake of simplicity, however, turbulence simulations are often conducted in the isothermal limit. Given that the majority of astrophysical systems are not governed by isothermal dynamics, we aim to quantify the impact of thermodynamics on the physics of turbulence, through varying adiabatic index, $\gamma$, combined with a range of optically thin cooling functions. In this paper, we present a suite of ideal magnetohydrodynamics simulations of thermally balanced stationary turbulence in the subsonic, super-Alfv\'enic, high beta (ratio of thermal to magnetic pressure) regime, where turbulent dissipation is balanced by two idealized cooling functions (approximating linear cooling and free-free emission) and examine the impact of the equation of state by considering cases that correspond to isothermal, monatomic and diatomic gases. We find a strong anticorrelation between thermal and magnetic pressure independent of thermodynamics, whereas the strong anticorrelation between density and magnetic field found in the isothermal case weakens with increasing $\gamma$. Similarly, with the linear relation between variations in density and thermal pressure with sonic Mach number becomes steeper with increasing $\gamma$. This suggests that there exists a degeneracy in these relations with respect to thermodynamics and Mach number in this regime, which is dominated by slow magnetosonic modes. These results have implications for attempts to infer (e.g.) Mach numbers from (e.g.) Faraday rotation measurements, without additional information regarding the thermodynamics of the plasma. However, our results suggest that this degeneracy can be broken by utilizing higher-order moments of observable distribution functions.
Figures

Figures from the paper (4 more)


Reference graph
Works this paper leans on
-
[1]
2018, Journal of Plasma Physics, 84, 905840404
Andr´ es, N., Sahraoui, F., Galtier, S., et al. 2018, Journal of Plasma Physics, 84, 905840404
work page 2018
-
[2]
Balbus, S. A., & Hawley, J. F. 1998, Reviews of Modern Physics, 70, 1
work page 1998
-
[3]
2013, Magnetic Fields in Galaxies, ed
Beck, R., & Wielebinski, R. 2013, Magnetic Fields in Galaxies, ed. T. D. Oswalt & G. Gilmore (Dordrecht: Springer Netherlands), 641
work page 2013
-
[4]
Beckwith, K., Grete, P., & O’Shea, B. W. 2019, IEEE Transactions on Plasma Science, 1
work page 2019
-
[5]
F., & Krolik, J
Beckwith, K., Hawley, J. F., & Krolik, J. H. 2008, ApJ, 678, 1180
2008
-
[6]
Beckwith, K., & Stone, J. M. 2011, The Astrophysical Journal Supplement Series, 193, 6
work page 2011
-
[7]
2013, Space Science Reviews, 178, 163 Br¨ uggen, M., & Vazza, F
Brandenburg, A., & Lazarian, A. 2013, Space Science Reviews, 178, 163 Br¨ uggen, M., & Vazza, F. 2015, Turbulence in the Intracluster Medium, ed. A. Lazarian, M. E. de Gouveia Dal Pino, & C. Melioli (Berlin, Heidelberg: Springer Berlin Heidelberg), 599
work page 2013
-
[8]
Brunetti, G., & Jones, T. W. 2015, Cosmic Rays in Galaxy Clusters and Their Interaction with Magnetic Fields, ed. A. Lazarian, M. E. de Gouveia Dal Pino, & C. Melioli (Berlin, Heidelberg: Springer Berlin Heidelberg), 557
work page 2015
Show all 46 references
-
[9]
2007, Monthly Notices of the Royal Astronomical Society, 378, 245
Brunetti, G., & Lazarian, A. 2007, Monthly Notices of the Royal Astronomical Society, 378, 245
2007
-
[10]
2012, Flow, Turbulence and Combustion, 89, 563
Chernyshov, A., Karelsky, K., & Petrosyan, A. 2012, Flow, Turbulence and Combustion, 89, 563
2012
-
[11]
A., Ferziger, J
Clark, R. A., Ferziger, J. H., & Reynolds, W. C. 1979, Journal of Fluid Mechanics, 91, 1
1979
-
[12]
Dalcin, L., Mortensen, M., & Keyes, D. E. 2019, Journal of Parallel and Distributed Computing Dalc´ ın, L., Paz, R., & Storti, M. 2005, Journal of Parallel and Distributed Computing, 65, 1108
2019
-
[13]
2016, Journal of Plasma Physics, 82
Federrath, C. 2016, Journal of Plasma Physics, 82
2016
-
[14]
2015, Monthly Notices of the Royal Astronomical Society, 448, 3297
Federrath, C., & Banerjee, S. 2015, Monthly Notices of the Royal Astronomical Society, 448, 3297
2015
-
[15]
S., & Schmidt, W
Federrath, C., Klessen, R. S., & Schmidt, W. 2008, The Astrophysical Journal Letters, 688, L79
2008
-
[16]
Germano, M., Piomelli, U., Moin, P., & Cabot, W. H. 1991, Physics of Fluids A, 3, 1760
1991
-
[17]
W., & Beckwith, K
Grete, P., O’Shea, B. W., & Beckwith, K. 2018, The Astrophysical Journal Letters, 858, L19
2018
-
[18]
2017, Physics of Plasmas, 24, 092311
Christlieb, A. 2017, Physics of Plasmas, 24, 092311
2017
-
[19]
G., Schmidt, W., & Schleicher, D
Grete, P., Vlaykov, D. G., Schmidt, W., & Schleicher, D. R. G. 2016, Physics of Plasmas, 23, 062317
2016
-
[20]
2007, Implicit Large Eddy Simulation: Computing Turbulent Fluid Dynamics (Cambridge University Press)
Grinstein, F., Margolin, L., & Rider, W. 2007, Implicit Large Eddy Simulation: Computing Turbulent Fluid Dynamics (Cambridge University Press)
2007
-
[21]
Hunter, J. D. 2007, Computing in Science & Engineering, 9, 90
2007
-
[22]
A., & Lazarian, A
Kowal, G., Falceta-Gon¸ calves, D. A., & Lazarian, A. 2011, New Journal of Physics, 13, 053001
2011
-
[23]
2007, The Astrophysical Journal, 658, 423
Kowal, G., Lazarian, A., & Beresnyak, A. 2007, The Astrophysical Journal, 658, 423
2007
-
[24]
N., & Stone, J
Lemaster, M. N., & Stone, J. M. 2009, The Astrophysical Journal, 691, 1092
2009
-
[25]
2019, Monthly Notices of the Royal Astronomical Society, 484, 4881
Mohapatra, R., & Sharma, P. 2019, Monthly Notices of the Royal Astronomical Society, 484, 4881
2019
-
[26]
Z., Glover, S
Molina, F. Z., Glover, S. C. O., Federrath, C., & Klessen, R. S. 2012, Monthly Notices of the Royal Astronomical Society, 423, 2680
2012
-
[27]
S., Kowal, G., Santos-Lima, R., de Gouveia Dal Pino, E
Nakwacki, M. S., Kowal, G., Santos-Lima, R., de Gouveia Dal Pino, E. M., & Falceta-Gon¸ calves, D. A. 2016, Monthly Notices of the Royal Astronomical Society, 455, 3702
2016
-
[28]
A., Federrath, C., & Sutherland, R
Nolan, C. A., Federrath, C., & Sutherland, R. S. 2015, Monthly Notices of the Royal Astronomical Society, 451, 1380
2015
-
[29]
Padoan, P., Jones, B. J. T., & Nordlund, A. P. 1997, The Astrophysical Journal, 474, 730
1997
-
[30]
2011, The Astrophysical Journal, 730, 40
Padoan, P., & Nordlund, ˚A. 2011, The Astrophysical Journal, 730, 40
2011
-
[31]
1998, Phys
Passot, T., & V´ azquez-Semadeni, E. 1998, Phys. Rev. E, 58, 4501
1998
-
[32]
2003, A&A, 398, 845
Passot, T., & V´ azquez-Semadeni, E. 2003, A&A, 398, 845
2003
-
[33]
Begelman, M. C. 2014, Monthly Notices of the Royal Astronomical Society, 438, 1355
2014
-
[34]
M., Falceta-Gon¸ calves, D
Santos-Lima, R., de Gouveia Dal Pino, E. M., Falceta-Gon¸ calves, D. A., Nakwacki, M. S., & Kowal, G. 2017, Monthly Notices of the Royal Astronomical Society, 465, 4866 Thermodynamics in MHD turbulence 15
2017
-
[35]
A., & Cowley, S
Schekochihin, A. A., & Cowley, S. C. 2006, Physics of Plasmas, 13, 056501
2006
-
[36]
A., Cowley, S
Schekochihin, A. A., Cowley, S. C., Kulsrud, R. M., Rosin, M. S., & Heinemann, T. 2008, Phys. Rev. Lett., 100, 081301
2008
-
[37]
Niemeyer, J. C. 2009, Astronomy & Astrophysics, 494, 127
2009
-
[38]
B., Hawley, J
Simon, J. B., Hawley, J. F., & Beckwith, K. 2009, The Astrophysical Journal, 690, 974
2009
-
[39]
M., & Gardiner, T
Stone, J. M., & Gardiner, T. 2009, New Astronomy, 14, 139
2009
-
[40]
Simon, J. B. 2008, The Astrophysical Journal Supplement Series, 178, 137
2008
-
[41]
V., Porter, D
Sytine, I. V., Porter, D. H., Woodward, P. R., Hodson, S. W., & Winkler, K.-H. 2000, Journal of Computational Physics, 158, 225
2000
-
[42]
M., Cattaneo, F., & Boldyrev, S
Tobias, S. M., Cattaneo, F., & Boldyrev, S. 2013, in Ten Chapters in Turbulence, ed. P. Davidson, Y. Kaneda, & K. Sreenivasan (Cambridge University Press), 351
2013
-
[43]
2014, Computing in Science & Engineering, 16, 62 van der Walt, S., Colbert, S
Towns, J., Cockerill, T., Dahan, M., et al. 2014, Computing in Science & Engineering, 16, 62 van der Walt, S., Colbert, S. C., & Varoquaux, G. 2011, Computing in Science Engineering, 13, 22
2014
-
[44]
H., & Chen, S
Yang, Y., Shi, Y., Wan, M., Matthaeus, W. H., & Chen, S. 2016, Phys. Rev. E, 93, 061102
2016
-
[45]
2016, The Astrophysical Journal, 831, 85
Yoon, H., Cho, J., & Kim, J. 2016, The Astrophysical Journal, 831, 85
2016
-
[46]
2018, Phys
Zhao, D., & Aluie, H. 2018, Phys. Rev. Fluids, 3, 054603 16 Grete, O’Shea & Beckwith APPENDIX A. CONVERGENCE OF SIMULATIONS 0.5 0.0 0.5 ln / 0 1 2 3 4 PDF 0.5 1.0 1.5 pth/ pth 0 1 2 3 4 0.5 1.0 1.5 ptot/ ptot 0 2 4 6 8 2.5 0.0 2.5 (BLOS B0)/B0 0.0 0.2 0.4 0.6 M0.35P0.91 = 5/3 ...
2018
Reviewed August 14, 2026 · model on record in the stance chip above.
Discussion (0). Continue with ORCID to comment.