REVIEW 3 major objections 8 minor 76 references
An empirical model of the extragalactic radio background
T0 review · 3 major / 8 minor · reviewed 2026-08-11 · deepseek-v4-flash
Pith's one-line read Building the extragalactic radio background from a mock galaxy catalog, this paper predicts that roughly half of the radio sources SKA will detect at z ~ 4–6 will be too faint for Rubin's deepest optical survey.
desk verdict Useful new mock catalog with convincing z<4 validation; the z>4 SKA/Rubin prediction is an explicit extrapolation that needs a sensitivity test. read the letter →
The pith
A machine-rendered reading of the paper's core claim, the machinery that carries it, and where it could break.
The reading
What carries the argument
The carrying object is the EGG mock galaxy catalog (Schreiber et al. 2017), a near-infrared-selected simulated sky containing active and passive galaxies with stellar masses, SFRs, and SEDs down to z~10. Onto it the paper layers two radio channels: star-forming galaxies receive 1.4 GHz luminosities by converting their IR luminosities with the mass- and redshift-dependent qIR calibration of Delvecchio et al. (2021), while radio AGNs are assigned with probability functions p(L1.4GHz|M*, z) from Wang et al. (2024), restricted to hosts above $10^{10}$ M_sun, with luminosities drawn from a pure density evolution luminosity function. A Soneira–Peebles hierarchical clustering algorithm redistributes the massive host galaxies so that the mock radio AGNs reproduce the observed angular two-point correlation function. These components convert ordinary galaxy properties into a realistic radio sky whose multi-wavelength connections can be queried directly.
What would settle it
Measure the 1.4 GHz radio luminosity function of AGNs at 4<z<6 with a deep survey, or measure the fraction of SKA-detected z~4–6 sources with r>27.5 in early SKA/Rubin overlap; a deviation from the extrapolated pure-density-evolution model, or a fraction far from ~50%, would refute the central prediction.
Extended reading notes
Core claim
The paper's central claim is that the extragalactic radio background can be built from the bottom up: instead of drawing sources from measured radio luminosity functions, it assigns radio emission to every galaxy in the EGG mock catalog based on that galaxy's star formation rate and on a probability, calibrated at z<4, that it hosts a radio AGN of a given 1.4 GHz luminosity. The synthetic catalog then reproduces the observed 1.4 GHz radio luminosity functions of both AGNs and star-forming galaxies, the differential number counts at 150 MHz, 1.4 GHz, and 3 GHz, and the angular clustering of radio AGNs. Since the radio flux is attached to physical galaxies, the catalog directly links radio detection to host properties such as stellar mass, redshift, and photometric magnitudes. Its headline prediction is that 45–56% of the radio sources SKA will detect at z>4 will be too faint at r-band (r~27.5) to be seen by Rubin's LSST survey, making deep radio observations essential for finding dust-obscured early-universe galaxies.
Load-bearing premise
The high-redshift predictions assume that the radio-AGN probability functions and the luminosity-function shape measured at z<4 continue to hold at 4<z<6 without new data; if those functions change, the 'half invisible' result changes.
Editorial extensions
If this is right
- The released 4 deg^2 mock catalog lets survey planners compute, for any radio detection, the expected optical/NIR magnitude and stellar mass of its host.
- SKA's 5-hour pointings should detect star-forming galaxies down to ~10^10 M_sun at z~6, extending galaxy formation studies to the early universe.
- At z>4, 45–56% of SKA-detected radio sources will lack an LSST r-band (or z-band) counterpart, so SKA will be the primary window onto dust-obscured early galaxies.
- Radio AGN and SFG contributions to the extragalactic radio background separate cleanly in the model, but the AGN contribution is sensitive to a single bright source per square degree at 150 MHz.
Reading between the lines
- The same catalog-based technique could be used to predict X-ray or sub-mm emission from the same mock galaxies, yielding a fully multi-wavelength mock sky for survey planning.
- The 'half invisible' prediction would shift if high-redshift radio AGNs are hosted by lower-mass galaxies than assumed; SKA pathfinder data at 4<z<6 could test the extrapolated AGN probabilities within a few years.
- If the extrapolation is wrong, the model would still reproduce z<4 observables, meaning the high-z prediction should be read as the main falsifiable output rather than the calibrations.
Editorial analysis
A structured set of objections, weighed in public.
Referee Report
Summary. This paper constructs an empirical model of the extragalactic radio sky by starting from an EGG-generated NIR-selected mock galaxy catalog and assigning radio continuum emission to every galaxy: star-forming galaxies receive 1.4 GHz luminosities from their SFRs through qIR, while radio AGNs are drawn from the Wang et al. (2024) probability functions and assigned luminosities following a pure density evolution RLF. The model also adds Soneira-Peebles clustering for massive galaxies and empirically calibrated sizes for SFGs. The authors validate the resulting AGN and SFG 1.4 GHz RLFs, differential source counts at 150 MHz, 1.4 GHz, and 3 GHz, and the angular two-point correlation function of radio AGNs. They then use the catalog to predict SKA source statistics and LSST cross-matching, finding that roughly half of SKA sources at z>4 will be fainter than r=27.5, and they describe the columns of the released 4 deg^2 mock catalog.
Significance. If the model is correct, it provides a useful physical link between radio flux densities and galaxy host properties, and the released mock catalog can support survey design and multiwavelength follow-up planning. The SFG RLF and the source-count checks use independent data, and the paper is commendably explicit about its limitations, including the extrapolation to z>4, the missing extended radio sources, and the ad hoc 10^10 M_sun host-mass threshold. The main weakness is that the AGN population is generated from the same Wang et al. (2024) functions that are used as the primary AGN validation, so the independent evidence for the high-redshift AGN behavior is sparse; consequently, the headline SKA/LSST prediction requires a sensitivity analysis before it can be regarded as robust.
major comments (3)
- [§2.2, Eqs. (2)–(3)] The calculation of fAGN is not dimensionally consistent as written. In Eq. (2), p(L|M,z) is written as a dimensionless power law, but Eq. (3) integrates it over dL_radio. Since p is proportional to L^-0.77, the integral from L_limit to infinity diverges at the upper end, and even with a finite upper cutoff fAGN would have units of luminosity rather than being a fraction. If p is instead a probability per logarithmic luminosity, Eq. (3) must integrate over dlog L and the normalization in Eq. (2) must be interpreted accordingly. This step controls the total number of radio AGNs in every mass and redshift bin, so it should be fixed and stated explicitly.
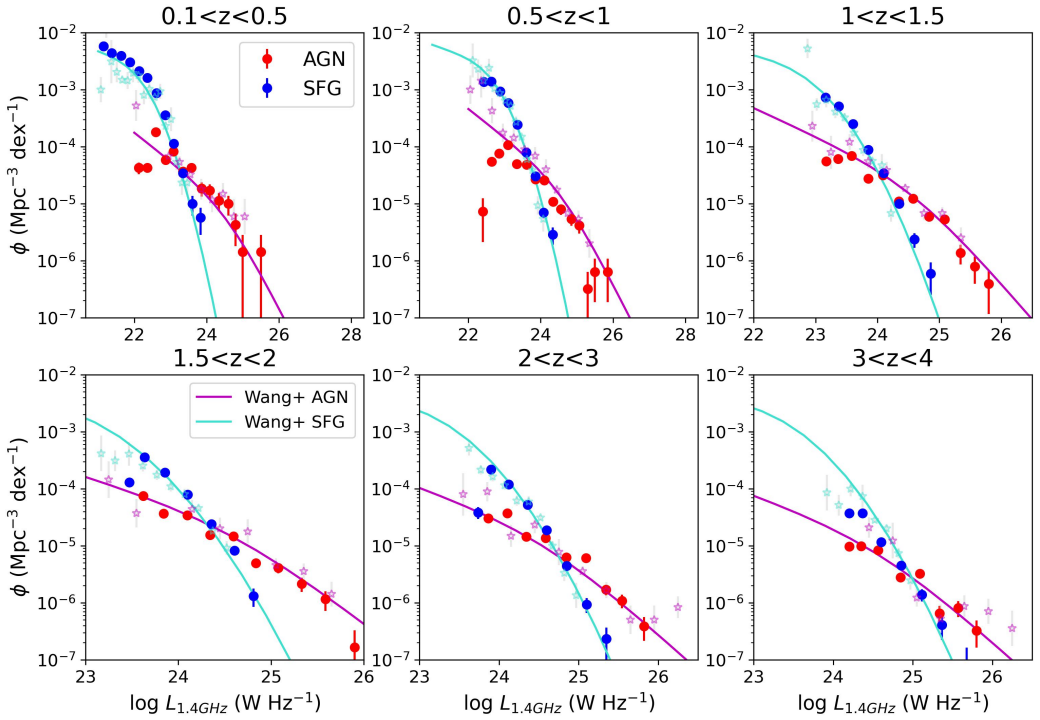
- [§3.1, Fig. 1 vs. §2.2] The agreement between the mock AGN RLF and the Wang et al. (2024) data points in Fig. 1 is partly circular: the mock AGNs are generated from the same best-fit functions in Eqs. (2) and (5), so Fig. 1 largely demonstrates that the sampling code recovers its input. The genuinely informative tests are Figs. 2 and 3, which use independent compilations. I request a quantitative comparison in the overlapping luminosity and redshift bins, for example residuals or a chi-square statistic, and a clear separation in the text between internal consistency checks and external validation when summarizing the claim that the AGN RLF is successfully recovered.
- [§4.1 and §5.1(4)] The headline prediction that 56% of SKA-detected sources at z>4 are invisible in the LSST r~27.5 survey is driven by radio AGNs generated with Eqs. (2) and (5) extrapolated from z<4, as the text acknowledges, and the high-redshift validation data are sparse. No sensitivity test is provided. I request a robustness check that, at minimum, freezes the AGN probability and RLF evolution at z=4, and ideally also varies the 10^10 M_sun host-mass threshold of §2.2 and the qIR extrapolation for SFGs beyond z~4.5, and reports the resulting range for the claimed 45–56% optically invisible fraction. Without such a test, the main SKA/LSST prediction is not yet demonstrated.
minor comments (8)
- [§2.2, Eq. (2)] The pivot values M0, L0, and z0 in Eq. (2) are not defined; please state them explicitly.
- [§3.1, Figs. 2–3] The flux limits, selection criteria, and redshift binning of the literature data used in Figs. 2 and 3 are described in the text but would be easier to assess if summarized in the captions or a table.
- [§5.1(4)] The statement that the extrapolations 'succeeded in recovering RLFs of both radio AGNs and SFGs at z>4' is stronger than the sparse z>4 data warrant; please soften it or add quantitative uncertainties.
- [§4.1] The LSST r band is approximated with the SDSS r band; the potential filter and k-correction differences should be stated or estimated.
- [Table 3] The mock catalog is described as publicly released, but no URL or DOI is given; please add access details.
- [§2.5, Table 1] The z>2 effective-radius fit uses only 19 SFGs and the resulting A and alpha values have large uncertainties; this should be noted wherever the size model is applied.
- [§5.2] The heading 'Coution' is a typo for 'Caution'; other typos include 'wavelenghths' in the introduction and 'simuations' in §4.2.
- [§4.3, Eq. (8)] The constant C in Eq. (8) is not defined or used; please define it or remove it.
Circularity Check
The AGN RLF 'recovery' is a self-consistency check on the authors' own Wang et al. (2024) input functions, while the SKA/Rubin z>4 prediction is an admitted extrapolation rather than a circular construction.
-
fitted input called prediction
[Section 2.2 (Eqs. 2 and 5) vs. Section 3.1 (Fig. 1)]
"We take advantage of recent work by Wang et al. (2024), which gathered deep VLA 3 GHz observations ... They carefully investigated AGN probability as a function of redshift, stellar mass and radio luminosity using maximum likelihood fitting and derived functional forms for radio AGNs in active and passive host galaxies respectively. ... Fig. 1 compares the RLF of our mock AGNs (red dots) and SFGs (blue dots) to the data points (magenta and cyan stars respectively) in Wang et al. (2024). ..."
The mock AGN population is generated from the same fitted functions used in the comparison: Eq. (2) gives p(L_1.4GHz|M*,z) from Wang et al. (2024) and Eq. (5) gives the AGN RLF shape from Wang et al. (2024). Sections 2.2 and 3.1 therefore describe a forward model whose AGN component is re-sampled from the very RLF/data it is then said to recover. The agreement in Fig. 1 is a numerical self-consistency test of the EGG host catalog and the integration in Eq. (3), not an independent observational validation of the AGN population. This is the classic fitted-input-called-prediction pattern: applying a fitted probability/RLF to a mock catalog and then 'recovering' the same RLF is forced by construction for the AGN component.
full rationale
The paper is largely a forward-model construction, not a derivation from first principles, and most of its output is genuinely independent of the input fits. The EGG parent catalog is built from empirical stellar mass functions and SED libraries; SFG radio luminosities are obtained from SFR-MS and qIR calibrations; and the source counts at 150 MHz-15 GHz are checked against many external surveys (Franzen, Mandal, Bondi, Condon, Smolčić, Matthews, Vernstrom, van der Vlugt, Jiménez-Andrade), with good agreement. These tests are not circular: the radio fluxes are not fitted to those counts. The one clear circular step is the AGN RLF 'recovery' in Section 3.1. The mock radio AGNs are assigned luminosities using Equations (2) and (5), both taken directly from Wang et al. (2024), and the validation in Fig. 1 compares the resulting RLF to the same Wang et al. (2024) data and best-fit models. The agreement is therefore a self-consistency check: the AGN component is re-sampled from the same fitted probability density and RLF shape it is later said to recover. The overlap of two co-authors (Tao Wang, Yijun Wang) strengthens the concern that this is self-citation load-bearing, although the cited work itself is an external empirical measurement and not a mere assertion. The high-redshift SKA/Rubin claim (56% optically invisible at z>4) is not circular in the strict sense. Section 5.1(4) explicitly states that Equations (2) and (5) are extrapolated to 4<z<6 because Wang et al. only constrained them at z<4. The prediction is a genuine extrapolation with independent content; the problem is robustness, not circularity. No sensitivity test (e.g., freezing the AGN evolution at z=4) is presented, so the headline fraction should be treated as model-dependent. The clustering section also tunes 15%/25% active/passive fractions to a clustering target before 'reproducing' radio-AGN clustering, but this is peripheral and explicitly fails at large scales. Overall, the central derivation is not equivalent to its inputs; one validation reduces to a re-sampling of the authors' own fitted functions, so a moderate score of 4 is appropriate.
Assumptions & free parameters
free parameters (10)
- Radio AGN probability parameters, active hosts (Eq. 2a) =
normalization 10^-0.79, M* slope 1.06, L slope -0.77, redshift slope 3.08
- Radio AGN probability parameters, passive hosts (Eq. 2b) =
normalization 10^-0.70, M* slope 1.41, L slope -0.60, redshift slope 2.47
- Radio AGN RLF shape parameters (Eq. 5) =
Phi*_0=10^-5.5, L*_0=10^24.59, alpha=1.27, beta=-0.49, alpha_D=-0.77 z + 2.69
- Stellar mass threshold for radio AGN hosts =
10^10 Msun
- Peak qIR for passive galaxies =
2.3
- qIR Gaussian scatter =
0.26 dex
- qIR low-side cutoff =
0.43 dex below peak
- Clustering redistribution fractions =
15% active, 25% passive
- Effective radius parameters A and alpha (Eq. 6, Table 1) =
A: 2.093/2.415/1.737, alpha: 0.092/0.029/0.211 in three z bins
- Median spectral slopes and scatter =
SFG: -0.8 at 1.4/3 GHz, -0.5 at 150 MHz; AGN: -0.5; sigma=0.1
assumptions (9)
- domain assumption The EGG mock catalog (Schreiber et al. 2017), including stellar mass functions, UVJ-based SEDs, SFR-M* main sequence, and passive residual SFRs, accurately represents the galaxy population, including extrapolation to z~10.
- domain assumption A flat LCDM cosmology with Omega_M=0.286, H0=69.3 km/s/Mpc, and a Salpeter IMF are adopted.
- domain assumption The Bell (2003) relation converts SFR_MS to a 1.4 GHz radio luminosity lower limit for the AGN probability integral.
- domain assumption The Delvecchio et al. (2021) qIR(M*,z) relation and its scatter describe SFG radio emission at all masses and redshifts up to z>4.5.
- domain assumption The Wang et al. (2024) radio AGN probability functions and RLF shape remain valid when extrapolated to 4<z<6.
- ad hoc to paper Radio AGNs only reside in galaxies with stellar mass above 10^10 Msun.
- domain assumption Passive galaxies have a redshift-independent qIR distribution peaked at 2.3.
- domain assumption The Soneira-Peebles algorithm with R=3', eta=5, lambda=6, and assigned fractions 15%/25%, reproduces the clustering of massive galaxies and radio AGNs.
- domain assumption A single median spectral slope applies per population across luminosity and redshift, with 0.1 dex Gaussian scatter.
Cite this review
Pith. "Pith review of An empirical model of the extragalactic radio background." pith.science (2026). https://pith.science/paper/WNUP4BXI
@misc{pith2026241208995,
  author       = {Pith},
  title        = {Pith review of: An empirical model of the extragalactic radio background},
  year         = {2026},
  howpublished = {\url{https://pith.science/paper/WNUP4BXI}},
  note         = {Machine review of arXiv:2412.08995}
}
abstract
Radio observations provide a powerful tool to constrain the assembly of galaxies over cosmic time. Recent deep and wide radio continuum surveys have improved significantly our understanding on radio emission properties of AGNs and SFGs across $0 < z < 4$. This allows us to derive an empirical model of the radio continuum emission of galaxies based on their SFR and the probability of hosting an radio AGN. We make use of the Empirical Galaxy Generator (EGG) to generate a near-infrared-selected, flux-limited multi-wavelength catalog to mimic real observations. Then we assign radio continuum flux densities to galaxies based on their SFRs and the probability of hosting a radio-AGN of specific 1.4 GHz luminosity. We also apply special treatments to reproduce the clustering signal of radio AGNs.Our empirical model successfully recovers the observed 1.4 GHz radio luminosity functions (RLFs) of both AGN and SFG populations, as well as the differential number counts at various radio bands. The uniqueness of this approach also allows us to directly link radio flux densities of galaxies to other properties, including redshifts, stellar masses, and magnitudes at various photometric bands. We find that roughly half of the radio continuum sources to be detected by SKA at $z \sim 4-6$ will be too faint to be detected in the optical survey ($r \sim 27.5$) carried out by Rubin observatory. Unlike previous studies which utilized RLFs to reproduce ERB, our work starts from a simulated galaxy catalog with realistic physical properties. It has the potential to simultaneously, and self-consistently reproduce physical properties of galaxies across a wide range of wavelengths, from optical, NIR, FIR to radio wavelengths. Our empirical model can shed light on the contribution of different galaxies to the extragalactic background light, and greatly facilitates designing future multiwavelength galaxy surveys.
Figures


Figures from the paper (7 more)


Reference graph
Works this paper leans on
-
[1]
H., Jagannathan, P., & Nyland, K
Alberts, S., Rujopakarn, W., Rieke, G. H., Jagannathan, P., & Nyland, K. 2020, ApJ, 901, 168
2020
- [2]
-
[3]
M., Gonzalez-Perez, V ., Lagos, C
Baugh, C. M., Gonzalez-Perez, V ., Lagos, C. D. P., et al. 2019, MNRAS, 483, 4922
work page 2019
-
[4]
H., Hearin, A
Behroozi, P., Wechsler, R. H., Hearin, A. P., & Conroy, C. 2019, MNRAS, 488, 3143
2019
-
[5]
S., Wechsler, R
Behroozi, P. S., Wechsler, R. H., & Conroy, C. 2013, ApJ, 770, 57
2013
-
[6]
Bell, E. F. 2003, ApJ, 586, 794
work page 2003
-
[7]
Best, P. N., Kauffmann, G., Heckman, T. M., et al. 2005, MNRAS, 362, 25 Béthermin, M., Wu, H.-Y ., Lagache, G., et al. 2017, A&A, 607, A89
work page 2005
-
[8]
Bonaldi, A., An, T., Brüggen, M., et al. 2021, MNRAS, 500, 3821
work page 2021
Show all 76 references
-
[9]
2019, MNRAS, 482, 2
Bonaldi, A., Bonato, M., Galluzzi, V ., et al. 2019, MNRAS, 482, 2
2019
-
[10]
2017, MNRAS, 469, 1912
Bonato, M., Negrello, M., Mancuso, C., et al. 2017, MNRAS, 469, 1912
2017
-
[11]
2008, ApJ, 681, 1129
Bondi, M., Ciliegi, P., Schinnerer, E., et al. 2008, ApJ, 681, 1129
2008
-
[12]
2003, A&A, 403, 857
Bondi, M., Ciliegi, P., Zamorani, G., et al. 2003, A&A, 403, 857
2003
-
[13]
2023, arXiv e-prints, arXiv:2312.06247
Bondi, M., Scaramella, R., Zamorani, G., et al. 2023, arXiv e-prints, arXiv:2312.06247
2023 arXiv
-
[14]
Bridle, A. H. 1967, MNRAS, 136, 219
1967
-
[15]
Brown, M. J. I., Moustakas, J., Kennicutt, R. C., et al. 2017, ApJ, 847, 136
2017
-
[16]
2019, MNRAS, 490, 243
Chakraborty, A., Roy, N., Datta, A., et al. 2019, MNRAS, 490, 243
2019
-
[17]
Condon, J. J. 1984, ApJ, 284, 44
1984
-
[18]
2013, ARA&A, 51, 393
Conroy, C. 2013, ARA&A, 51, 393
2013
-
[19]
J., Springel, V ., White, S
Croton, D. J., Springel, V ., White, S. D. M., et al. 2006, MNRAS, 365, 11
2006
-
[20]
2007, ApJ, 670, 156
Daddi, E., Dickinson, M., Morrison, G., et al. 2007, ApJ, 670, 156
2007
-
[21]
Dale, D. A. & Helou, G. 2002, ApJ, 576, 159
2002
-
[22]
2017, A&A, 605, A70
Davidzon, I., Ilbert, O., Laigle, C., et al. 2017, A&A, 605, A70
2017
-
[23]
Davies, L. J. M., Huynh, M. T., Hopkins, A. M., et al. 2017, MNRAS, 466, 2312 de Jong, J. M. G. H. J., Röttgering, H. J. A., Kondapally, R., et al. 2024, A&A, 683, A23
2017
-
[24]
T., et al
Delvecchio, I., Daddi, E., Sargent, M. T., et al. 2021, A&A, 647, A123
2021
-
[25]
J., Mortlock, A., et al
Duncan, K., Conselice, C. J., Mortlock, A., et al. 2014, MNRAS, 444, 2960
2014
-
[26]
Fixsen, D. J. 2009, ApJ, 707, 916
2009
-
[27]
Franzen, T. M. O., Jackson, C. A., O ffringa, A. R., et al. 2016, MNRAS, 459, 3314
2016
-
[28]
A., Riley, J
Garn, T., Green, D. A., Riley, J. M., & Alexander, P. 2009, MNRAS, 397, 1101
2009
-
[29]
C., Giavalisco, M., et al
Guo, Y ., Ferguson, H. C., Giavalisco, M., et al. 2013, ApJS, 207, 24
2013
-
[30]
L., Jarvis, M
Hale, C. L., Jarvis, M. J., Delvecchio, I., et al. 2018, MNRAS, 474, 4133
2018
-
[31]
Hamilton, A. J. S. 1993, ApJ, 417, 19
1993
-
[32]
G., Almaini, O., Cirasuolo, M., et al
Hartley, W. G., Almaini, O., Cirasuolo, M., et al. 2010, MNRAS, 407, 1212
2010
-
[33]
G., Lane, K
Hartley, W. G., Lane, K. P., Almaini, O., et al. 2008, MNRAS, 391, 1301
2008
-
[34]
2013, ApJS, 208, 19 Ivezi´c, Ž., Kahn, S
Hinshaw, G., Larson, D., Komatsu, E., et al. 2013, ApJS, 208, 19 Ivezi´c, Ž., Kahn, S. M., Tyson, J. A., et al. 2019, ApJ, 873, 111
2013
-
[35]
2007, ApJ, 656, 680 Jiménez-Andrade, E
Jiang, L., Fan, X., Ivezi´c, Ž., et al. 2007, ApJ, 656, 680 Jiménez-Andrade, E. F., Murphy, E. J., Momjian, E., et al. 2024, arXiv e-prints, arXiv:2406.13801
2007 arXiv
-
[36]
2018, ApJ, 864, 56
Jin, S., Daddi, E., Liu, D., et al. 2018, ApJ, 864, 56
2018
-
[37]
I., Sramek, R., Schmidt, M., Sha ffer, D
Kellermann, K. I., Sramek, R., Schmidt, M., Sha ffer, D. B., & Green, R. 1989, AJ, 98, 1195
1989
-
[38]
N., Cochrane, R
Kondapally, R., Best, P. N., Cochrane, R. K., et al. 2022, MNRAS, 513, 3742
2022
-
[39]
E., Daddi, E., Béthermin, M., et al
Magdis, G. E., Daddi, E., Béthermin, M., et al. 2012, ApJ, 760, 6
2012
-
[40]
2017, MNRAS, 464, 3271
Magliocchetti, M., Popesso, P., Brusa, M., et al. 2017, MNRAS, 464, 3271
2017
-
[41]
2017, ApJ, 842, 95
Mancuso, C., Lapi, A., Prandoni, I., et al. 2017, ApJ, 842, 95
2017
-
[42]
J., et al
Mandal, S., Prandoni, I., Hardcastle, M. J., et al. 2021, A&A, 648, A5
2021
-
[43]
2010, MNRAS, 404, 532
Massardi, M., Bonaldi, A., Negrello, M., et al. 2010, MNRAS, 404, 532
2010
-
[44]
M., Condon, J
Matthews, A. M., Condon, J. J., Cotton, W. D., & Mauch, T. 2021, ApJ, 909, 193
2021
-
[45]
J., & Bonfield, D
McAlpine, K., Jarvis, M. J., & Bonfield, D. G. 2013, MNRAS, 436, 1084
2013
-
[46]
P., Somerville, R
Moster, B. P., Somerville, R. S., Maulbetsch, C., et al. 2010, ApJ, 710, 903
2010
-
[47]
J., Momjian, E., Condon, J
Murphy, E. J., Momjian, E., Condon, J. J., et al. 2017, ApJ, 839, 35
2017
-
[48]
2013, ApJ, 777, 18
Muzzin, A., Marchesini, D., Stefanon, M., et al. 2013, ApJ, 777, 18
2013
-
[49]
G., Weiner, B
Noeske, K. G., Weiner, B. J., Faber, S. M., et al. 2007, ApJ, 660, L43
2007
-
[50]
2017, A&A, 602, A5
Novak, M., Smolˇci´c, V ., Delhaize, J., et al. 2017, A&A, 602, A5
2017
-
[51]
I., et al
Padovani, P., Bonzini, M., Kellermann, K. I., et al. 2015, MNRAS, 452, 1263
2015
-
[52]
I., et al
Padovani, P., Miller, N., Kellermann, K. I., et al. 2011, ApJ, 740, 20
2011
-
[53]
J., Wang, L., Hurley, P
Pearson, W. J., Wang, L., Hurley, P. D., et al. 2018, A&A, 615, A146
2018
-
[54]
2011, ApJ, 739, L40
Rodighiero, G., Daddi, E., Baronchelli, I., et al. 2011, ApJ, 739, L40
2011
-
[55]
Salpeter, E. E. 1955, ApJ, 121, 161
1955
-
[56]
2017, ApJ, 847, 76
Santini, P., Fontana, A., Castellano, M., et al. 2017, ApJ, 847, 76
2017
-
[57]
& Green, R
Schmidt, M. & Green, R. F. 1983, ApJ, 269, 352
1983
-
[58]
2017, A&A, 602, A96
Schreiber, C., Elbaz, D., Pannella, M., et al. 2017, A&A, 602, A96
2017
-
[59]
2015, A&A, 575, A74
Schreiber, C., Pannella, M., Elbaz, D., et al. 2015, A&A, 575, A74
2015
-
[60]
K., Dennefeld, M., Saikia, D
Sirothia, S. K., Dennefeld, M., Saikia, D. J., et al. 2009, MNRAS, 395, 269 Smolˇci´c, V ., Delvecchio, I., Zamorani, G., et al. 2017a, A&A, 602, A2 Smolˇci´c, V ., Novak, M., Bondi, M., et al. 2017b, A&A, 602, A1 Smolˇci´c, V ., Novak, M., Delvecchio, I., et al. 2017c, A&A, 602, A6
2009
-
[61]
Soneira, R. M. & Peebles, P. J. E. 1978, AJ, 83, 845
1978
-
[62]
S., Steinhardt, C
Speagle, J. S., Steinhardt, C. L., Capak, P. L., & Silverman, J. D. 2014, ApJS, 214, 15
2014
-
[63]
2016, A&A Rev., 24, 10
Tadhunter, C. 2016, A&A Rev., 24, 10
2016
-
[64]
R., Quadri, R
Tomczak, A. R., Quadri, R. F., Tran, K.-V . H., et al. 2014, ApJ, 783, 85
2014
-
[65]
Tunbridge, B., Harrison, I., & Brown, M. L. 2016, MNRAS, 463, 3339 van der Vlugt, D., Algera, H. S. B., Hodge, J. A., et al. 2021, ApJ, 907, 5 van der Wel, A., Franx, M., van Dokkum, P. G., et al. 2014, ApJ, 788, 28
2016
-
[66]
V ., et al
Vernstrom, T., Scott, D., Wall, J. V ., et al. 2014, MNRAS, 440, 2791
2014
-
[67]
V ., et al
Vernstrom, T., Scott, D., Wall, J. V ., et al. 2016, MNRAS, 462, 2934
2016
-
[68]
V ., Chu, T
Wall, J. V ., Chu, T. Y ., & Yen, J. L. 1970, Australian Journal of Physics, 23, 45
1970
-
[69]
J., et al
Wang, L., Gao, F., Duncan, K. J., et al. 2019, A&A, 631, A109
2019
-
[70]
2024, arXiv e-prints, arXiv:2401.04924
Wang, Y ., Wang, T., Liu, D., et al. 2024, arXiv e-prints, arXiv:2401.04924
2024 arXiv
-
[71]
R., Kauffmann, O
Weaver, J. R., Kauffmann, O. B., Ilbert, O., et al. 2022, ApJS, 258, 11
2022
-
[72]
E., Labbé, I., van Dokkum, P
Whitaker, K. E., Labbé, I., van Dokkum, P. G., et al. 2011, ApJ, 735, 86
2011
-
[73]
E., van Dokkum, P
Whitaker, K. E., van Dokkum, P. G., Brammer, G., & Franx, M. 2012, ApJ, 754, L29
2012
-
[74]
H., Riley, J
Whittam, I. H., Riley, J. M., Green, D. A., et al. 2016, MNRAS, 457, 1496
2016
-
[75]
J., Miller, L., Jarvis, M
Wilman, R. J., Miller, L., Jarvis, M. J., et al. 2008, MNRAS, 388, 1335
2008
-
[76]
S., Reddy, N
Yun, M. S., Reddy, N. A., & Condon, J. J. 2001, ApJ, 554, 803
2001
Reviewed August 11, 2026 · model on record in the stance chip above.
Discussion (0). Continue with ORCID to comment.