REVIEW 4 major objections 6 minor 4 cited by
Radiation and Magnetic Pressure Support in Accretion Disks around Supermassive Black Holes and The Physical Origin of the Extreme Ultraviolet to Soft X-ray Spectrum
T0 review · 4 major / 6 minor · reviewed 2026-08-15 · deepseek-v4-flash
Pith's one-line read Simulations trace the quasar soft X-ray excess to bulk Comptonization in the accretion flow itself, not to a hot corona or reflection.
desk verdict First global 3D radiation-MHD demonstration of bulk Comptonization producing the AGN EUV/soft-X power law, but the production region sits at unresolved angular scales and the spectral slopes are provisional. read the letter →
The pith
A machine-rendered reading of the paper's core claim, the machinery that carries it, and where it could break.
The reading
What carries the argument
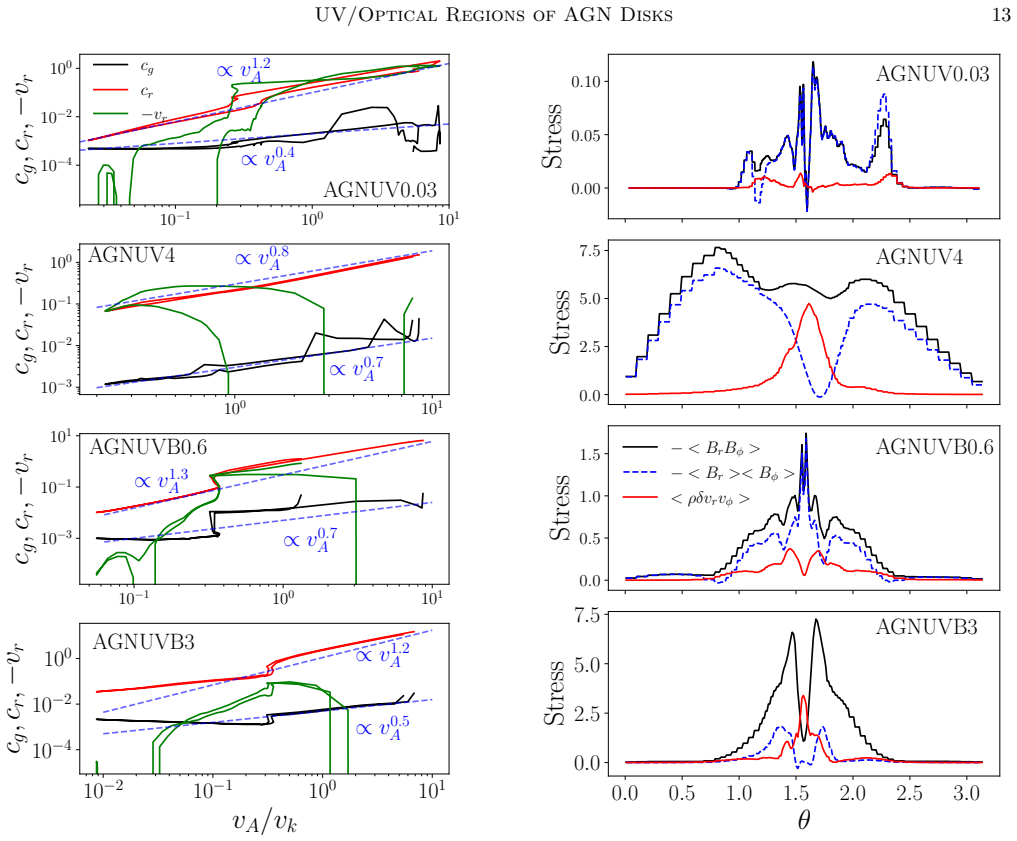
The load-bearing mechanism is compressible bulk Comptonization in the converging accretion flow: photons repeatedly scatter off electrons in gas whose radial inflow speed exceeds the electron thermal speed, gaining energy from the bulk convergence of the flow rather than from thermal electron motions. The required physical condition is that the optical depth across the velocity gradient be comparable to $c/v$, so photons are carried along with the flow while slowly diffusing; the simulations find this condition met in an optically thick layer about 30 to 45 degrees from the midplane, where the inflow speed is $\gtrsim 0.1\%c$. The numerical machinery that exposes the mechanism is multi-group radiation transport with realistic opacities, which lets the emergent spectrum be computed self-consistently from the simulated gas structure, and a control experiment that turns off Doppler frequency shifts to isolate bulk Comptonization from thermal emission.
What would settle it
Take one of the near-Eddington simulations and re-run the multi-group spectrum calculation with the same level of angular refinement applied to the 30 to 45 degree off-midplane layer; if the emergent 10 eV to 1 keV power-law slope moves outside $L_\nu\propto\nu^{-1}$ to $\nu^{-2}$, or the component disappears, the claim that bulk Comptonization in this specific region produces the observed soft X-ray excess is not established.
Extended reading notes
Core claim
The central discovery claim is that the power-law continuum from about 10 eV to 1 keV in near-Eddington accretion disks around supermassive black holes is produced by compressible bulk Comptonization within the converging accretion flow. The evidence is diagnostic rather than merely correlative: when the Doppler frequency shift is switched off in the multi-group radiation transport, the high-energy power law disappears while the thermal peak below 10 eV is unchanged, and setting all velocities to zero produces the same result. The photons emerge from a region 30 to 45 degrees from the midplane that is still optically thick (Rosseland optical depth above $10^3$), where the radial inflow speed exceeds the electron thermal speed; this is not a turbulent Comptonization process, which would require small-scale eddies, but a coherent convergent-flow process whose spectral shape resembles the analytic free-fall bulk-Comptonization solution. The same simulations show that the disks become either radiation-pressure or magnetic-pressure supported depending on whether the cooling time is shorter or longer than the inflow time, and that strongly magnetized disks with very low surface density would produce spectra very different from what is observed.
Load-bearing premise
The numerical grid refines only the region within about 3.5 degrees of the midplane, while the photons that form the power law are produced 30 to 45 degrees from the midplane at root-level angular resolution, and the paper presents no resolution-convergence check for that zone.
Editorial extensions
If this is right
- If the central claim holds, the observed soft X-ray slope becomes a direct readout of the inflow velocity and optical depth structure of the disk.
- No warm corona or blurred reflection is needed to explain the soft X-ray excess in near-Eddington quasars.
- The power law merges smoothly with the ~10 eV thermal peak, matching the observed ~12 eV (1000 Å) far-UV break.
- The absence of the power law in the 3 percent Eddington run is consistent with soft X-ray excesses appearing preferentially in high-accretion-rate sources.
- Extrapolating to smaller black-hole masses, as in Narrow Line Seyfert 1 galaxies, the same mechanism is expected to shift the spectrum to higher frequencies while preserving the power-law slope (a prediction the paper states explicitly).
Reading between the lines
- The same mechanism should be visible in any accretion flow that is optically thick and converges at speeds above the electron thermal speed; X-ray binaries, which lack the soft X-ray excess, may simply not satisfy that condition, a connection the paper notes observationally but does not develop into a model.
- Because bulk Comptonization is a kinematic process, the soft X-ray excess should appear in other systems with suitable inflow conditions, such as tidal disruption events or ultraluminous X-ray sources, whenever the velocity and optical depth combination is met; this is a direct extrapolation of the paper's mechanism beyond AGN disks.
- A decisive observational discriminator follows from the mechanism: the predicted EUV-to-soft-X-ray continuum is featureless and smoothly connects to the UV peak, so a high-resolution spectrum across the 0.01-1 keV range with no atomic features would favor this model over reflection or absorption interpretations; this test is implicit in the paper's comparison to observed slopes.
Signed reviews
Editorial analysis
A structured set of objections, weighed in public.
Referee Report
Summary. The paper presents four 3D radiation MHD simulations of accretion disks around a 1e8 solar mass black hole, with accretion rates ranging from 0.03 to 4 times Eddington. The disks end up either magnetic-pressure dominated or radiation-pressure dominated depending on the relative cooling and inflow timescales. Using a restart of single snapshots with multi-group radiation transport (14 frequency groups, TOPS opacities), the authors compute emerging spectra and find a power-law component between ~10 eV and 1 keV in the three higher-accretion-rate runs, which they attribute to compressible bulk Comptonization in an optically thick converging flow located about 30-50 degrees from the midplane. The 3% Eddington run does not show this component from the disk body. The mechanism is probed by turning off the Doppler frequency shift, which removes the power law.
Significance. If the main result holds, the paper offers a concrete, physically motivated origin for the EUV/soft X-ray excess in radio-quiet quasars, distinct from warm-corona or reflection models, with the spectral slope set by the inflow dynamics. The work has genuine strengths: the Doppler-off experiment is a clean internal test of the mechanism; the multi-group transport uses realistic opacities; and the spectral calculation has no tunable parameters. The identification of the production region and the mechanism's dependence on inflow speed are falsifiable predictions. However, confidence is limited by the numerical resolution of the production region, the use of single non-time-averaged snapshots, and an inconsistency between the quoted slope conventions, as detailed below.
major comments (4)
- [Section 2 and Figures 15-16] The high-energy photon production region is under-resolved. The AMR refinement covers only |theta-90 deg| < 3.5 deg with Delta_theta=1.23%, while the root polar grid has 32 uniform cells over 180 degrees, giving Delta_theta about 5.6 degrees. Figure 15 places the production region at 30-50 degrees from the midplane, entirely at root resolution, with roughly 3-4 cells across the 20-degree-wide zone. Bulk Comptonization depends on the velocity gradient and optical depth along the photon path, and Figure 16 shows the inflow speed rising from below 1e-4 c at the midplane to above 1e-2 c at |theta-90 deg| > 30 deg, a gradient that 5.6-degree cells represent only coarsely. No resolution convergence test is presented for the velocity structure or the emergent spectrum in this region, so the reported power-law slopes (nu L_nu proportional to nu^-1 to nu^-1.5 in Figure 13) may be numerically dependent.
- [Abstract and Section 5 / Figure 13] The slope convention is inconsistent. The abstract and summary state L_nu proportional to nu^-1 to nu^-2, but Section 5 reports nu L_nu proportional to nu^-1 to nu^-1.5, which corresponds to L_nu proportional to nu^-2 to nu^-2.5. The observed slopes quoted (Laor et al. 1997) are L_nu proportional to nu^-1.77 and nu^-1.72. The comparison to observation is therefore not as claimed: the simulated L_nu slopes are steeper by one power of nu. This needs to be corrected and the observational comparison re-evaluated.
- [Section 5 and Figure 1] The spectra are computed from single snapshots with gas and magnetic fields frozen after restart, rather than from time-averaged or multiple snapshots. The luminosity histories in Figure 1 show large variability over the simulation, including a secular decline in AGNUV4, so the representativeness of the chosen snapshot is not established. Since the central claim is that the power-law component is a generic property of such disks, the absence of a time average or of several independent snapshots weakens the claim.
- [Table 1 and Section 3] The four runs differ simultaneously in initial torus density, pressure, radius, magnetic field amplitude, and field topology, as well as in the achieved accretion rate. The interpretation that the pressure-support regime is controlled by the ratio of cooling time to inflow time is thus not cleanly tested, because multiple initial conditions change together. A systematic study (varying one parameter at a time) would be needed to support the causal claims about magnetic versus radiation pressure support in Section 3.
minor comments (6)
- [Figure 14 caption] The caption refers to runs "AGNUV10" and "AGNUVB10", which appear to be typos for AGNUV4 and AGNUVB3.
- [Abstract and Section 5] The abstract says the 3% Eddington disk does not exhibit the power-law component, but Section 5 notes a weak power-law appears when photons from the whole box are included; please clarify whether the claim refers to the disk body only.
- [Abstract and Section 5] The production region is quoted as 30-45 degrees from the midplane in the abstract, while Section 5 gives 30-50 degrees (|theta-90 deg| between about 30 and 50); the numbers should be made consistent.
- [Section 5] The sentence "This is also not in the optically thin region" is awkward; consider "This region is not optically thin" for clarity.
- [Figure 1 caption] The caption mentions blue lines and red circles but does not describe how they appear in the panels; please add a legend or explicit description in the caption.
- [Section 5] The claim that the spectral shape is "pretty close" to the Payne & Blandford (1981) solution is qualitative; a quantitative comparison (e.g., fitting the simulated slope to the analytical prediction) would strengthen the connection.
Circularity Check
No circularity found: the spectral power law is an emergent simulation output compared with external observations and a controlled Doppler-term toggle, not an input fitted into the model.
full rationale
The paper's central claim, that an EUV/soft-X-ray power law arises from bulk Comptonization in the optically thick converging flow, is derived from time-dependent radiation-MHD simulations rather than from a fit. The spectra in Figure 13 are computed by post-processing snapshots with a multi-group transport module using TOPS opacities, and the paper explicitly states that there are no free parameters that can adjust the spectra (Section 5). The attribution to bulk Comptonization is tested by turning off the Doppler frequency shift and showing that the power law disappears (Figure 14), which is a controlled numerical experiment rather than a definitional identity. Self-citations to Jiang et al. (2014a), Jiang (2021), and Jiang (2022) concern the radiation-transport algorithms used, and citations to Jiang et al. (2019a,b) and Secunda et al. (2024, 2025) are contextual or about the inner region excluded from the domain; none substitute for the present calculation of the outer-disk spectrum. The comparison to Payne & Blandford (1981) is an external analytic benchmark, not an imported uniqueness theorem. The skeptical concerns about root-level angular resolution in the 30-45 degree production region and the abstract/figure slope-convention mismatch (nu L_nu versus L_nu) are numerical-resolution and consistency issues, not circularity. The derivation chain is therefore self-contained: simulation dynamics plus multi-group radiation transport produce the spectrum, and the observed comparison is made after the fact.
Assumptions & free parameters
free parameters (5)
- Initial torus density scale rho_i =
0.2 rho0 (AGNUV0.03), 1 rho0 (AGNUV4), 1 rho0 (AGNUVB0.6), 10 rho0 (AGNUVB3)
- Initial torus pressure scale P_i =
9.6e-4 P0 (AGNUV0.03), 1e8 P0 (AGNUV4), 108 P0 (AGNUVB0.6), 1080 P0 (AGNUVB3)
- Initial torus radius r_i =
300 r_g (AGNUV0.03), 400 r_g (AGNUV4, AGNUVB0.6, AGNUVB3)
- Magnetic field amplitude a0 =
3.25 (AGNUV0.03), 4e-4 (AGNUV4), 4e-4 (AGNUVB0.6), 2e-3 (AGNUVB3)
- Magnetic field loop topology =
Single loop (AGNUV0.03, AGNUV4), double loop (AGNUVB0.6, AGNUVB3)
assumptions (6)
- domain assumption Ideal MHD with MRI as the angular momentum transport mechanism
- domain assumption Gray radiation MHD during dynamical evolution is adequate for the disk structure
- ad hoc to paper The gas and magnetic fields can be frozen while the multi-group radiation field relaxes
- domain assumption The inner disk inside 50 r_g does not affect the UV and soft X-ray production outside it
- ad hoc to paper Single snapshots are representative of the time-averaged disk emission
- domain assumption Solar metallicity opacity tables are appropriate for the disk atmosphere
Cite this review
Pith. "Pith review of Radiation and Magnetic Pressure Support in Accretion Disks around Supermassive Black Holes and The Physical Origin of the Extreme Ultraviolet to Soft X-ray Spectrum." pith.science (2026). https://pith.science/paper/X54NXWVZ
@misc{pith2026250509671,
  author       = {Pith},
  title        = {Pith review of: Radiation and Magnetic Pressure Support in Accretion Disks around Supermassive Black Holes and The Physical Origin of the Extreme Ultraviolet to Soft X-ray Spectrum},
  year         = {2026},
  howpublished = {\url{https://pith.science/paper/X54NXWVZ}},
  note         = {Machine review of arXiv:2505.09671}
}
abstract
We present the results of four three-dimensional radiation magnetohydrodynamic simulations of accretion disks around a $10^8$ solar mass black hole, which produce the far ultraviolet spectrum peak and demonstrate a robust physical mechanism to produce the extreme ultraviolet to soft X-ray power-law continuum component. The disks are fed from rotating tori and reach accretion rates ranging from $0.03$ to $4$ times the Eddington value. The disks become radiation pressure or magnetic pressure dominated depending on the relative timescales of radiative cooling and gas inflow. Magnetic pressure supported disks can form with or without net poloidal magnetic fields as long as the inflowing gas can cool quickly enough, which can typically happen when the accretion rate is low. We calculate the emerging spectra from these disks using multi-group radiation transport with realistic opacities and find that they typically peak around $10$ eV. At accretion rates close to or above the Eddington limit, a power-law component can appear for photon energies between $10$ eV and 1 keV with a spectral slope varying between $L_\nu\propto\nu^{-1}$ and $\nu^{-2}$, comparable to what is observed in radio quiet quasars. The disk with $3\%$ Eddington accretion rate does not exhibit this component. These high energy photons are produced in an optically thick region $\approx 30^{\circ}-45^{\circ}$ from the disk midplane by compressible bulk Comptonization within the converging accretion flow. Strongly magnetized disks that have a very small surface density will produce a spectrum that is very different from what is observed.
Figures


Figures from the paper (11 more)




Forward citations
Cited by 4 Pith papers
-
Magnetosonic Waves as a Driver of Observed Temperature Fluctuation Patterns in AGN Accretion Disks
Turbulent Maxwell stress in simulated AGN disks excites temperature waves that match observed slow inward and outward propagating fluctuations, implying magnetically dominated photospheres in observed AGN.
-
Viscously Spreading Accretion Disks around Black Holes: Implications for TDEs, LFBOTs and other Transients
Many late-time TDE plateaus can be reproduced by initially wide disks formed with redistributed angular momentum, while the same model with super-Eddington outflows explains AT2018cow's late emission with a 10-100 sol...
-
Do Little Red Dots Vary?
Super-Eddington accretion models can explain why little red dots show almost no variability, whereas standard sub-Eddington AGN variability models predict changes that should already have been seen.
-
Idealized Global Models of Accretion Disks with Strong Toroidal Magnetic Fields
A zero-net-vertical-flux accretion disk with a strong toroidal magnetic field settles into a state with midplane magnetic and gas pressures comparable, and accretion stress alpha about 0.1, when the gas scale height i...
Reference graph
Works this paper leans on
-
[1]
A., Branduardi-Raymont, G., Culhane, J
Arnaud, K. A., Branduardi-Raymont, G., Culhane, J. L., et al. 1985, MNRAS, 217, 105, doi: 10.1093/mnras/217.1.105
-
[2]
Bai, X.-N., & Stone, J. M. 2013, ApJ, 767, 30, doi: 10.1088/0004-637X/767/1/30 UV/Optical Regions of AGN Disks21
-
[3]
Balbus, S. A., & Hawley, J. F. 1991, ApJ, 376, 214, doi: 10.1086/170270 —. 1998, Reviews of Modern Physics, 70, 1, doi: 10.1103/RevModPhys.70.1
doi:10.1086/170270 1991
-
[4]
Ballantyne, D. R., & Xiang, X. 2020, MNRAS, 496, 4255, doi: 10.1093/mnras/staa1866
-
[5]
R., Sudhakar, V., Fairfax, D., et al
Ballantyne, D. R., Sudhakar, V., Fairfax, D., et al. 2024, MNRAS, 530, 1603, doi: 10.1093/mnras/stae944
-
[6]
2024, ApJ, 977, 201, doi: 10.3847/1538-4357/ad9277
Barnier, S., & Done, C. 2024, ApJ, 977, 201, doi: 10.3847/1538-4357/ad9277
-
[7]
Beckwith, K., Hawley, J. F., & Krolik, J. H. 2008, ApJ, 678, 1180, doi: 10.1086/533492
doi:10.1086/533492 2008
-
[8]
Begelman, M. C., & Armitage, P. J. 2023, MNRAS, 521, 5952, doi: 10.1093/mnras/stad914
Show all 82 references
-
[9]
C., Armitage, P
Begelman, M. C., Armitage, P. J., & Reynolds, C. S. 2015, ApJ, 809, 118, doi: 10.1088/0004-637X/809/2/118
2015 doi
-
[11]
C., Scepi, N., & Dexter, J
Begelman, M. C., Scepi, N., & Dexter, J. 2022, MNRAS, 511, 2040, doi: 10.1093/mnras/stab3790
2022 doi
-
[12]
2009, A&A, 495, 421, doi: 10.1051/0004-6361:200810620
Bianchi, S., Guainazzi, M., Matt, G., Fonseca Bonilla, N., & Ponti, G. 2009, A&A, 495, 421, doi: 10.1051/0004-6361:200810620
2009 doi
-
[13]
H., Hirose, S., & Shabaltas, N
Blaes, O., Krolik, J. H., Hirose, S., & Shabaltas, N. 2011, ApJ, 733, 110, doi: 10.1088/0004-637X/733/2/110
2011 doi
-
[14]
D., & Payne, D
Blandford, R. D., & Payne, D. G. 1981, MNRAS, 194, 1033, doi: 10.1093/mnras/194.4.1033
1981 doi
-
[15]
F., & Torkelsson, U
Brandenburg, A., Nordlund, A., Stein, R. F., & Torkelsson, U. 1995, ApJ, 446, 741, doi: 10.1086/175831
1995 doi
-
[16]
M., Bentz, M
Cackett, E. M., Bentz, M. C., & Kara, E. 2021, iScience, 24, 102557, doi: 10.1016/j.isci.2021.102557
2021
-
[17]
P., Magee, N
Colgan, J., Kilcrease, D. P., Magee, N. H., et al. 2016, ApJ, 817, 116, doi: 10.3847/0004-637X/817/2/116
2016 doi
-
[18]
C., Gallo, L., & Ross, R
Crummy, J., Fabian, A. C., Gallo, L., & Ross, R. R. 2006, MNRAS, 365, 1067, doi: 10.1111/j.1365-2966.2005.09844.x
2006
-
[19]
1987, ApJ, 321, 305, doi: 10.1086/165630
Czerny, B., & Elvis, M. 1987, ApJ, 321, 305, doi: 10.1086/165630
1987 doi
-
[20]
2003, A&A, 412, 317, doi: 10.1051/0004-6361:20031441
Czerny, B., Niko lajuk, M., R´ o˙ za´ nska, A., et al. 2003, A&A, 412, 317, doi: 10.1051/0004-6361:20031441
2003 doi
-
[21]
C., & Lesur, G
Das, U., Begelman, M. C., & Lesur, G. 2018, MNRAS, 473, 2791, doi: 10.1093/mnras/stx2518
2018 doi
-
[22]
W., & Tchekhovskoy, A
Davis, S. W., & Tchekhovskoy, A. 2020, ARA&A, 58, 407, doi: 10.1146/annurev-astro-081817-051905
2020 doi
-
[23]
Dexter, J., & Begelman, M. C. 2019, MNRAS, 483, L17, doi: 10.1093/mnrasl/sly213
2019 doi
-
[25]
C., Anninos, P., Roth, N., & Mishra, B
Fragile, P. C., Anninos, P., Roth, N., & Mishra, B. 2023, ApJ, 959, 59, doi: 10.3847/1538-4357/ad096b
2023 doi
-
[26]
C., & Sadowski, A
Fragile, P. C., & Sadowski, A. 2017, MNRAS, 467, 1838, doi: 10.1093/mnras/stx274
2017 doi
-
[27]
2012, ApJ, 758, 103, doi: 10.1088/0004-637X/758/2/103 Gierli´ nski, M., & Done, C
Gaburov, E., Johansen, A., & Levin, Y. 2012, ApJ, 758, 103, doi: 10.1088/0004-637X/758/2/103 Gierli´ nski, M., & Done, C. 2004, MNRAS, 349, L7, doi: 10.1111/j.1365-2966.2004.07687.x
2012
-
[28]
J., Nelson, R
Gressel, O., Turner, N. J., Nelson, R. P., & McNally, C. P. 2015, ApJ, 801, 84, doi: 10.1088/0004-637X/801/2/84
2015 doi
-
[29]
M., Quataert, E., & Kim, C.-G
Guo, M., Stone, J. M., Quataert, E., & Kim, C.-G. 2024, ApJ, 973, 141, doi: 10.3847/1538-4357/ad5fe7
2024 doi
-
[30]
Hopkins, P. F. 2024, arXiv e-prints, arXiv:2407.00160, doi: 10.48550/arXiv.2407.00160
2024 doi
-
[31]
F., Squire, J., Su, K.-Y., et al
Hopkins, P. F., Squire, J., Su, K.-Y., et al. 2024, The Open Journal of Astrophysics, 7, 19, doi: 10.21105/astro.2310.04506
2024
-
[32]
2023, ApJ, 945, 57, doi: 10.3847/1538-4357/acb6fc
Huang, J., Jiang, Y.-F., Feng, H., et al. 2023, ApJ, 945, 57, doi: 10.3847/1538-4357/acb6fc
2023 doi
-
[33]
2021, A&A, 647, A192, doi: 10.1051/0004-6361/202039322
Jacquemin-Ide, J., Lesur, G., & Ferreira, J. 2021, A&A, 647, A192, doi: 10.1051/0004-6361/202039322
2021 doi
-
[34]
2021, ApJS, 253, 49, doi: 10.3847/1538-4365/abe303 —
Jiang, Y.-F. 2021, ApJS, 253, 49, doi: 10.3847/1538-4365/abe303 —. 2022, ApJS, 263, 4, doi: 10.3847/1538-4365/ac9231
2021 doi
-
[35]
M., & Davis, S
Jiang, Y.-F., Blaes, O., Stone, J. M., & Davis, S. W. 2019a, ApJ, 885, 144, doi: 10.3847/1538-4357/ab4a00
- [36]
-
[37]
W., & Stone, J
Jiang, Y.-F., Davis, S. W., & Stone, J. M. 2016, ApJ, 827, 10, doi: 10.3847/0004-637X/827/1/10
2016 doi
-
[38]
M., & Davis, S
Jiang, Y.-F., Stone, J. M., & Davis, S. W. 2013, ApJ, 778, 65, doi: 10.1088/0004-637X/778/1/65 —. 2014a, ApJS, 213, 7, doi: 10.1088/0067-0049/213/1/7 —. 2014b, ApJ, 784, 169, doi: 10.1088/0004-637X/784/2/169 —. 2019b, ApJ, 880, 67, doi: 10.3847/1538-4357/ab29ff
2013 doi
-
[39]
2017, MNRAS, 471, 706, doi: 10.1093/mnras/stx1634
Jin, C., Done, C., Ward, M., & Gardner, E. 2017, MNRAS, 471, 706, doi: 10.1093/mnras/stx1634
2017 doi
-
[40]
2024, MNRAS, 527, 356, doi: 10.1093/mnras/stad3193
Jin, C., Lusso, E., Ward, M., Done, C., & Middei, R. 2024, MNRAS, 527, 356, doi: 10.1093/mnras/stad3193
2024 doi
-
[41]
2012, MNRAS, 420, 1825, doi: 10.1111/j.1365-2966.2011.19805.x
Jin, C., Ward, M., Done, C., & Gelbord, J. 2012, MNRAS, 420, 1825, doi: 10.1111/j.1365-2966.2011.19805.x
2012
-
[42]
2008, A&A, 490, 501, doi: 10.1051/0004-6361:200810385
Johansen, A., & Levin, Y. 2008, A&A, 490, 501, doi: 10.1051/0004-6361:200810385
2008 doi
-
[43]
Kaufman, J., & Blaes, O. M. 2016, MNRAS, 459, 1790, doi: 10.1093/mnras/stw761
2016 doi
-
[44]
M., & Hirose, S
Kaufman, J., Blaes, O. M., & Hirose, S. 2018, MNRAS, 476, 5548, doi: 10.1093/mnras/sty540
2018 doi
-
[45]
2008, Nature, 454, 492, doi: 10.1038/nature07114 22Jiang et al
Kishimoto, M., Antonucci, R., Blaes, O., et al. 2008, Nature, 454, 492, doi: 10.1038/nature07114 22Jiang et al
2008 doi
-
[46]
H., Hirose, S., & Blaes, O
Krolik, J. H., Hirose, S., & Blaes, O. 2007, ApJ, 664, 1045, doi: 10.1086/519515
2007 doi
-
[47]
Kynoch, D., Mitchell, J. A. J., Ward, M. J., et al. 2023, MNRAS, 520, 2781, doi: 10.1093/mnras/stad221 Lanˇ cov´ a, D., Abarca, D., Klu´ zniak, W., et al. 2019, ApJL, 884, L37, doi: 10.3847/2041-8213/ab48f5
2023 doi
-
[48]
Laor, A., & Davis, S. W. 2014, MNRAS, 438, 3024, doi: 10.1093/mnras/stt2408
2014 doi
-
[49]
J., & McDowell, J
Laor, A., Fiore, F., Elvis, M., Wilkes, B. J., & McDowell, J. C. 1997, ApJ, 477, 93, doi: 10.1086/303696
1997 doi
-
[50]
1969, Nature, 223, 690, doi: 10.1038/223690a0
Lynden-Bell, D. 1969, Nature, 223, 690, doi: 10.1038/223690a0
1969 doi
-
[51]
2009, MNRAS, 394, 250, doi: 10.1111/j.1365-2966.2008.14255.x
Schurch, N. 2009, MNRAS, 394, 250, doi: 10.1111/j.1365-2966.2008.14255.x
2009
-
[52]
2000, PASJ, 52, 499, doi: 10.1093/pasj/52.3.499
Mineshige, S., Kawaguchi, T., Takeuchi, M., & Hayashida, K. 2000, PASJ, 52, 499, doi: 10.1093/pasj/52.3.499
2000 doi
-
[53]
C., Armitage, P
Mishra, B., Begelman, M. C., Armitage, P. J., & Simon, J. B. 2020, MNRAS, 492, 1855, doi: 10.1093/mnras/stz3572
2020 doi
-
[54]
Mitchell, J. A. J., Done, C., Ward, M. J., et al. 2023, MNRAS, 524, 1796, doi: 10.1093/mnras/stad1830
2023 doi
-
[55]
W., Kochanek, C
Morgan, C. W., Kochanek, C. S., Morgan, N. D., & Falco, E. E. 2010, ApJ, 712, 1129, doi: 10.1088/0004-637X/712/2/1129
2010 doi
-
[56]
O., et al
Palit, B., R´ o˙ za´ nska, A., Petrucci, P. O., et al. 2024, A&A, 690, A308, doi: 10.1051/0004-6361/202450111
2024 doi
-
[57]
I., Blackman, E
Pariev, V. I., Blackman, E. G., & Boldyrev, S. A. 2003, A&A, 407, 403, doi: 10.1051/0004-6361:20030868
2003 doi
-
[58]
G., & Blandford, R
Payne, D. G., & Blandford, R. D. 1981, MNRAS, 196, 781, doi: 10.1093/mnras/196.4.781
1981 doi
- [59]
-
[60]
O., Ursini, F., De Rosa, A., et al
Petrucci, P. O., Ursini, F., De Rosa, A., et al. 2018, A&A, 611, A59, doi: 10.1051/0004-6361/201731580
2018 doi
-
[61]
O., Gronkiewicz, D., Rozanska, A., et al
Petrucci, P. O., Gronkiewicz, D., Rozanska, A., et al. 2020, A&A, 634, A85, doi: 10.1051/0004-6361/201937011
2020 doi
-
[62]
Psaltis, D., & Lamb, F. K. 1997, ApJ, 488, 881, doi: 10.1086/304711
1997 doi
-
[63]
Rees, M. J. 1984, ARA&A, 22, 471, doi: 10.1146/annurev.aa.22.090184.002351
1984
-
[64]
C., & Pickrel, D
Roth, N., Anninos, P., Fragile, P. C., & Pickrel, D. 2025, ApJ, 981, 144, doi: 10.3847/1538-4357/adb1c1 R´ o˙ za´ nska, A., Malzac, J., Belmont, R., Czerny, B., &
2025 doi
-
[65]
Petrucci, P. O. 2015, A&A, 580, A77, doi: 10.1051/0004-6361/201526288
2015 doi
-
[66]
2016, MNRAS, 459, 4397, doi: 10.1093/mnras/stw913
Sadowski, A. 2016, MNRAS, 459, 4397, doi: 10.1093/mnras/stw913
2016 doi
-
[67]
J., Simon, J
Salvesen, G., Armitage, P. J., Simon, J. B., & Begelman, M. C. 2016a, MNRAS, 460, 3488, doi: 10.1093/mnras/stw1231
-
[68]
B., Armitage, P
Salvesen, G., Simon, J. B., Armitage, P. J., & Begelman, M. C. 2016b, MNRAS, 457, 857, doi: 10.1093/mnras/stw029
- [69]
-
[70]
I., & Sunyaev, R
Shakura, N. I., & Sunyaev, R. A. 1973, A&A, 24, 337
1973
-
[71]
A., & Done, C
Sobolewska, M. A., & Done, C. 2007, MNRAS, 374, 150, doi: 10.1111/j.1365-2966.2006.11117.x
2007
-
[72]
W., & Blaes, O
Socrates, A., Davis, S. W., & Blaes, O. 2004, ApJ, 601, 405, doi: 10.1086/380301
2004 doi
- [73]
-
[74]
M., Tomida, K., White, C
Stone, J. M., Tomida, K., White, C. J., & Felker, K. G. 2020, ApJS, 249, 4, doi: 10.3847/1538-4365/ab929b
2020 doi
-
[75]
1994, MNRAS, 270, 480, doi: 10.1093/mnras/270.3.480
Thompson, C. 1994, MNRAS, 270, 480, doi: 10.1093/mnras/270.3.480
1994 doi
-
[76]
Titarchuk, L., Mastichiadis, A., & Kylafis, N. D. 1997, ApJ, 487, 834, doi: 10.1086/304617
1997 doi
-
[77]
A., & Pringle, J
Tout, C. A., & Pringle, J. E. 1992, MNRAS, 259, 604, doi: 10.1093/mnras/259.4.604
1992 doi
-
[78]
J., & Pounds, K
Turner, T. J., & Pounds, K. A. 1988, MNRAS, 232, 463, doi: 10.1093/mnras/232.2.463
1988 doi
-
[79]
2002, ApJ, 576, 349, doi: 10.1086/341631
Turolla, R., Zane, S., & Titarchuk, L. 2002, ApJ, 576, 349, doi: 10.1086/341631
2002 doi
-
[80]
M., & Netzer, H
Wang, J. M., & Netzer, H. 2003, A&A, 398, 927, doi: 10.1051/0004-6361:20021511
2003 doi
-
[81]
R., Bianchi, S., et al
Xiang, X., Ballantyne, D. R., Bianchi, S., et al. 2022, MNRAS, 515, 353, doi: 10.1093/mnras/stac1646
2022 doi
-
[82]
Davidsen, A. F. 1997, ApJ, 475, 469, doi: 10.1086/303560
1997 doi
-
[83]
Zhu, Z., Jiang, Y.-F., & Stone, J. M. 2019, arXiv:1912.01632, arXiv:1912.01632. https://arxiv.org/abs/1912.01632
2019 arXiv
-
[84]
Zhu, Z., & Stone, J. M. 2018, ApJ, 857, 34, doi: 10.3847/1538-4357/aaafc9
2018 doi
Reviewed August 15, 2026 · model on record in the stance chip above.
Discussion (0). Continue with ORCID to comment.