REVIEW 4 major objections 5 minor 50 references
Causal Discovery of Radiation Response Mechanisms in Human Cells
T0 review · 4 major / 5 minor · reviewed 2026-08-02 · deepseek-v4-flash
Pith's one-line read Jointly modeling radiation exposure with gene expression, the authors aim to show that causal discovery finds perturbation-response gene sets and regulatory structure that differential expression misses.
desk verdict A genuinely novel application of causal discovery to perturbed transcriptomics, undermined by a statistically invalid DESeq2-on-LFC gene filter that seeds every downstream result; the paper deserves a serious referee but the central claim is untested until that filter is fixed. read the letter →
The pith
A machine-rendered reading of the paper's core claim, the machinery that carries it, and where it could break.
The reading
What carries the argument
The central mechanism is DAG-GNN, a variational autoencoder that learns a directed adjacency matrix under a differentiable acyclicity constraint, here trained to reconstruct the joint distribution of gene expression and cumulative radiation dose. Because the full 15,694-gene matrix is intractable, the authors pre-filter genes by differential-expression p-values, partition the remaining genes into overlapping subsets using the STRING protein interaction network as an undirected skeleton, learn a DAG per subset, and merge the subgraphs. Ten bootstrap resamples produce a consensus graph (edges present in at least 50% of runs) at each dose rate; 'perfect' edges present in all ten runs are treate
What would settle it
Re-run the entire pipeline with the gene prefilter performed by DESeq2 (or an equivalent count-based method) on the raw count matrix rather than on log2-fold-change values, and check whether the causal gene sets still show stronger radiation-pathway enrichment than the differential-expression or random-forest baselines; if the 438-gene invariant set shifts and the enrichment advantage disappears, the claim collapses.
Extended reading notes
Core claim
On its own terms, the paper claims that causal discovery over the joint distribution of radiation dose and gene expression outperforms standard gene-selection pipelines for perturbation response. Using RPE1 cells exposed to five dose rates over nine weeks, the authors build dose-specific directed acyclic graphs with a graph variational autoencoder, include the cumulative radiation dose as an explicit variable, and retain edges that appear in at least half of ten bootstrap resamples. The resulting gene sets are smaller than those from differential expression yet are more strongly enriched for curated radiation-response pathways, and the invariant 438-gene intersection is enriched almost entir
Load-bearing premise
The whole pipeline depends on the statistical validity of the gene prefilter, which computes p-values with a negative-binomial test designed for count data but applies it to a log2-fold-change matrix—so if those p-values are meaningless, the causal graphs are learned over an arbitrary gene subset and the enrichment comparisons lose their footing.
Editorial extensions
If this is right
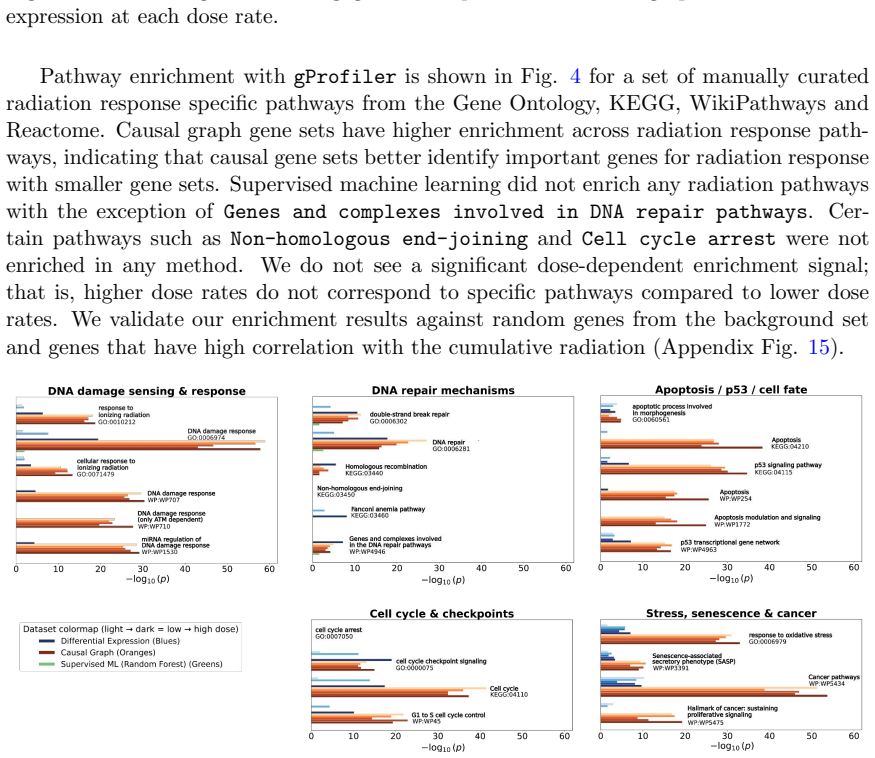
- A joint model of radiation exposure and multivariate gene expression produces gene sets with stronger radiation-specific pathway enrichment than differential expression, random forest feature importance, or a linear correlation baseline, even though these sets are smaller.
- The learned directed graphs consistently place transcription factors at high out-degree hubs and housekeeping genes at high in-degree sinks, and this assignment is not driven by expression variance (maximum Spearman rho = 0.119).
- The 438 genes present in every dose-rate graph are enriched almost exclusively for known radiation-response pathways (cell cycle, p53 signaling, DNA damage response, senescence), supporting the intersection as a core response set.
- Ancestors of housekeeping genes are enriched for oxidative-stress response while non-ancestors are enriched for membrane-permeability and apoptosis processes, suggesting a stress-versus-death branch in the graph.
- Edges that appear in 100% of bootstrap runs, though mostly absent from current knowledge bases, are candidates for novel radiation-response mechanisms that could be tested by CRISPR knockout.
Reading between the lines
- If the approach holds, the same joint-perturbation causal-discovery recipe could transfer to drug-response or disease-progression transcriptomics, where structured perturbations and few samples are the norm.
- Because the graph is built over a p-value-filtered gene pool, the claim's scope is restricted to genes passing that prefilter; the method's generalizability depends on the prefilter being statistically valid.
- The invariant-gene intersection behaves like an environment-invariant causal signature, so the dose-rate-stable edges might be testable mechanistic predictions: silencing the upstream transcription-factor hubs should shift the downstream housekeeping-ancestor enrichment profile.
- A cheap additional robustness check the authors did not run would be to compare the consensus graphs against graphs learned from shuffled radiation-dose labels, to ensure the perturbation variable is doing the work and not the expression covariance alone.
Editorial analysis
A structured set of objections, weighed in public.
Referee Report
Summary. The paper applies causal discovery (DAG-GNN) to bulk RNA-seq data from RPE1 cells exposed to five radiation dose rates, jointly modeling a cumulative radiation-dose variable with gene expression. It compares the resulting causal gene sets against differential expression (DESeq2) and random-forest baselines via pathway enrichment, and analyzes the learned directed graphs for known regulatory structure (transcription-factor hubs, housekeeping sinks, invariant subgraphs). The central claim is that causal discovery achieves a higher enrichment for radiation-response pathways and provides structured hypotheses about stress-versus-apoptosis branching. The paper includes code, a real dataset, and detailed appendices with additional baselines and bootstrap analyses.
Significance. If the methodological concerns were resolved, this would be a valuable demonstration of causal discovery on low-sample, perturbed transcriptomics—a setting where exact graph recovery is known to be hard but where structured hypothesis generation could still be useful. The graph-structural findings (TF hubs, housekeeping sinks, a stress/apoptosis branch) are concrete and experimentally testable, and the paper provides a public implementation. However, the statistical validity of the prefilter and the circularity in graph validation currently prevent full confidence in the conclusions.
major comments (4)
- [§4.1.1 and Table 1] DESeq2 is applied to X_LFC, a matrix of log2 ratios of TPM values, not raw counts. DESeq2's negative-binomial model and Wald test are defined for count data; applying them to continuous log-ratios gives p-values with no defined statistical meaning. These p-values are the gate for the entire causal pipeline (genes with p>0.05 are removed before DAG-GNN), so every downstream result—causal gene sets, invariant 438-gene set, enrichment comparisons in Fig. 4/Table 3, and structural analyses—is computed over an arbitrarily filtered gene universe. This is a load-bearing error that requires rerunning the DE analysis on raw counts or an appropriate continuous-data method and repeating the full pipeline.
- [§4.1.3, Appendix A, and Table 2] The STRING PPI network is used as the initial undirected structure to define the causal partition (Appendix A), constraining the search space for DAG-GNN. The same STRING network is then used as a validation target for edge overlap in Table 2. This creates partial circularity: edges consistent with STRING are more likely to be discovered because the partition restricts possible edges. The reported F1 values (max 0.031) are low, but they are not calibrated against the constrained search space. The random-gene control in Appendix D draws from the full background, not from the STRING-partitioned pool, so it does not correct this bias.
- [§4.1.3 and Appendix G] With n=36 samples per dose and up to 2,866 variables per DAG-GNN run, the problem is severely underdetermined. The consensus graph is built from only 10 bootstrap resamples with an arbitrary 50% edge-presence threshold, and the adjacency threshold is fixed at the DAG-GNN default 0.3. Appendix G shows very high variance across individual bootstrap runs; e.g., edge overlap with knowledge bases varies widely. The authors note the analysis is 'primarily qualitative,' but the central claim of 'higher hit rate' rests on consensus graphs derived from these fragile thresholds. A sensitivity analysis (e.g., varying the consensus threshold or adjacency threshold) or a more robust statistical evaluation is needed.
- [Fig. 4 and Table 3] The comparison of pathway enrichment across methods is not statistically formalized. Fig. 4 reports -log10 p-values without confidence intervals or a formal test for whether causal gene sets are significantly more enriched than DE or random-forest sets. The causal gene sets are generally smaller than DE sets, and the figures do not control for gene-set size or the DE-p-value prefilter. The random-gene control in Appendix D (drawing from the full background) is informative but does not address the specific bias induced by the STRING partition or the DE prefilter. A permutation test that samples gene sets of equal size from the same filtered pool would strengthen the claim.
minor comments (5)
- [Appendix A] The training-curve figure is referenced as 'Fig.??'—the placeholder remains in the manuscript.
- [Table 6] The caption says 'dose rate I (6.66 mGy/min)' but the unit should be mGy/hr, consistent with the rest of the paper.
- [§4.1.2] The random-forest feature-selection threshold (20 of 25 folds) and the correlation baseline threshold (>50% folds) are arbitrary; please justify or perform sensitivity checks.
- [Fig. 15] The caption mentions '5 repeated runs' but the text does not specify how many random gene sets were drawn; clarify the procedure.
- [§5] The text states 'Differential expression identifies larger sets' but does not give the exact sizes of the causal gene sets at each dose rate; reporting these sizes (and the number of nodes in each consensus graph) would help interpret Venn diagrams and enrichment comparisons.
Circularity Check
STRING is used both to constrain the causal search space and to validate edge overlap, a partial circularity; the main enrichment and topology claims remain independent.
-
self definitional
[§4.1.3 (Causal Discovery) and §4.2.2 (Graph Structural Analysis), Table 2]
"We further partitioned the gene set according to a causal partition defined in Shah et al. (2025) using an initial undirected structure to obtain overlapping subsets of genes that retain consistency of causal discovery. For our work, we use the protein-protein interaction network in the STRING database as the initial undirected structure ... We measure the overlap of edges in the DAGs with known protein-protein interactions (STRING Mering et al. (2003) and CORUM ...)."
The STRING PPI network is used twice: first as the undirected skeleton that defines the causal partition into overlapping gene subsets, which determines which gene pairs can co-occur in any DAG-GNN subproblem and therefore which edges are learnable in the union graph; and second as an external knowledge graph against which the final consensus DAG's edges are scored in Table 2. Because the same network constrains the hypothesis space and then serves as the validation target, the reported 'STRING overlap' is not an independent confirmation; it partly measures how much the search space was already aligned with STRING. The F1 values are small (max 0.031), so the impact is limited, but the edge-overlap validation is not a free external check.
full rationale
The main derivation chain — DE prefilter, DAG-GNN on dose-rate-stratified TPM data with a cumulative-dose variable, consensus graphs, pathway enrichment, and topology analysis — is mostly self-contained. The causal gene sets are not identical to the DE gene sets by construction: causal filtering keeps genes with p<0.05 while DE additionally requires |LFC|>1, so the two sets can differ. The enrichment comparisons use gProfiler with external knowledge bases, random-gene controls, and independent TF/housekeeping annotations; the self-citation to Shah et al. (2025) is a method citation for partitioning/merging and does not import an unverified uniqueness claim. The one genuine circularity is the dual use of STRING as both the partition skeleton and the edge-validation target, which partially builds the overlap into the search space; however, this affects only the peripheral edge-overlap validation, and the reported overlap is small. The questionable pyDESeq2-on-LFC prefilter is a serious statistical-validity concern, but it is not a circularity: it does not make the outputs equal to the inputs by construction. Overall, the central claims about radiation-pathway enrichment, TF hubs, housekeeping sinks, and invariant-gene subgraphs are not reduced to their inputs, so the circularity score is moderate.
Assumptions & free parameters
free parameters (5)
- DE prefilter p-value threshold =
0.05
- Consensus edge threshold (bootstrap) =
0.5
- DAG-GNN adjacency threshold =
0.3
- DEG cutoffs for the comparison baseline =
|LFC|>1, FDR<0.05
- DAG-GNN hyperparameters =
lr=3e-3, epochs=300, embedding dim=64, batch=36, Lagrangian iters=100
assumptions (6)
- ad hoc to paper Log2-ratio-of-TPM matrix X_LFC is a valid input for pyDESeq2's negative-binomial test
- domain assumption Acyclic causal sufficiency holds for gene expression plus radiation: the observed joint distribution is generated by a DAG with no hidden confounders among genes
- domain assumption The STRING PPI network is a valid skeleton such that the causal partition (Shah et al. 2025) preserves causal consistency, and the union-merge reconstructs the true full-graph DAG
- domain assumption Bootstrap consensus over 10 resamples of n=36 approximates the sampling distribution of the DAG
- standard math gProfiler with the all-X_TPM background and term size <300 filter yields comparable, unbiased enrichment across gene lists of different sizes
- domain assumption TF/housekeeping annotations (TRRUST, ChIP-Atlas on HepG2; Hsiao 2001 housekeeping set) transfer to RPE1 cells
Cite this review
Pith. "Pith review of Causal Discovery of Radiation Response Mechanisms in Human Cells." pith.science (2026). https://pith.science/paper/XGPHRSJ3
@misc{pith2026260713994,
  author       = {Pith},
  title        = {Pith review of: Causal Discovery of Radiation Response Mechanisms in Human Cells},
  year         = {2026},
  howpublished = {\url{https://pith.science/paper/XGPHRSJ3}},
  note         = {Machine review of arXiv:2607.13994}
}
read the original abstract
Next-generation sequencing technologies, including RNA-sequencing, provide genome-wide measurements of gene expression and enable broad explorations of biomarkers and mechanisms underlying disease and treatment response. Bioinformatics tools for processing this data, such as differential expression analysis, are largely univariate, linear, and rely on predefined pathway knowledge annotations, which limits their ability to capture nonlinear and multivariate gene interactions. This paper explores the application of causal discovery to characterizing transcriptional responses to radiation as a function of dose rate in human cells. By jointly modeling radiation perturbations and gene expression, we learn directed gene networks that capture important regulatory relationships beyond correlation and exhibit significant enrichment of known radiation response pathways compared to baseline approaches. We find that inferred causal graphs reveal structured network features such as high in-degree housekeeping genes and high out-degree transcription factors. Further analysis suggests a hierarchical organization of stress response pathways and triggered cell death pathways. This work highlights the potential of causal discovery in healthcare settings with applications to understanding response mechanisms, identifying regulatory targets, and improving interpretation of complex genomic data.
Figures


Figures from the paper (15 more)


Reference graph
Works this paper leans on
-
[1]
bioRxiv , pages=
Interpretable transcriptome-to-phenotype modeling of cell-painting nuclear morphology features from RNA-seq under low-dose radiation exposure , author=. bioRxiv , pages=. 2026 , publisher=
2026
-
[2]
Frontiers in genetics , volume=
Using supervised learning methods for gene selection in RNA-Seq case-control studies , author=. Frontiers in genetics , volume=. 2018 , publisher=
2018
-
[3]
Nature methods , volume=
Wisdom of crowds for robust gene network inference , author=. Nature methods , volume=. 2012 , publisher=
2012
-
[4]
Bioinformatics , volume=
Graph attention network for link prediction of gene regulations from single-cell RNA-sequencing data , author=. Bioinformatics , volume=. 2022 , publisher=
2022
-
[5]
2000 , publisher=
Causation, prediction, and search , author=. 2000 , publisher=
2000
-
[6]
Journal of machine learning research , volume=
Learning equivalence classes of Bayesian-network structures , author=. Journal of machine learning research , volume=
-
[7]
Journal of Machine Learning Research-JMLR , volume=
DirectLiNGAM: A direct method for learning a linear non-Gaussian structural equation model , author=. Journal of Machine Learning Research-JMLR , volume=
-
[8]
International conference on machine learning , pages=
DAG-GNN: DAG structure learning with graph neural networks , author=. International conference on machine learning , pages=. 2019 , organization=
2019
Show all 50 references
-
[9]
Nucleic acids research , volume=
g: Profiler: a web server for functional enrichment analysis and conversions of gene lists (2019 update) , author=. Nucleic acids research , volume=. 2019 , publisher=
2019
-
[10]
Genome biology , volume=
Moderated estimation of fold change and dispersion for RNA-seq data with DESeq2 , author=. Genome biology , volume=. 2014 , publisher=
2014
-
[11]
Bioinformatics , volume=
Hotelling's T 2 multivariate profiling for detecting differential expression in microarrays , author=. Bioinformatics , volume=. 2005 , publisher=
2005
-
[12]
Journal of bioinformatics and computational biology , volume=
A multivariate extension of the gene set enrichment analysis , author=. Journal of bioinformatics and computational biology , volume=. 2007 , publisher=
2007
-
[13]
Bioinformatics , volume=
Unite and conquer: univariate and multivariate approaches for finding differentially expressed gene sets , author=. Bioinformatics , volume=. 2009 , publisher=
2009
-
[14]
Quantitative Biology , volume=
Gene regulatory network inference based on causal discovery integrating with graph neural network , author=. Quantitative Biology , volume=. 2023 , publisher=
2023
-
[15]
Nature Communications , volume=
Large-scale causal discovery using interventional data sheds light on gene network structure in k562 cells , author=. Nature Communications , volume=. 2025 , publisher=
2025
-
[16]
Communications Biology , volume=
A large-scale benchmark for network inference from single-cell perturbation data , author=. Communications Biology , volume=. 2025 , publisher=
2025
-
[17]
cell , volume=
Perturb-Seq: dissecting molecular circuits with scalable single-cell RNA profiling of pooled genetic screens , author=. cell , volume=. 2016 , publisher=
2016
-
[18]
Bioinformatics , volume=
ARACNe-AP: gene network reverse engineering through adaptive partitioning inference of mutual information , author=. Bioinformatics , volume=. 2016 , publisher=
2016
-
[19]
Advances in Neural Information Processing Systems , volume=
Permutation-based causal inference algorithms with interventions , author=. Advances in Neural Information Processing Systems , volume=
-
[20]
PLoS biology , volume=
Large-scale mapping and validation of Escherichia coli transcriptional regulation from a compendium of expression profiles , author=. PLoS biology , volume=. 2007 , publisher=
2007
-
[21]
Advances in neural information processing systems , volume=
Dags with no tears: Continuous optimization for structure learning , author=. Advances in neural information processing systems , volume=
-
[22]
ACM Computing Surveys , volume=
D’ya like dags? a survey on structure learning and causal discovery , author=. ACM Computing Surveys , volume=. 2022 , publisher=
2022
-
[23]
Nature methods , volume=
Benchmarking algorithms for gene regulatory network inference from single-cell transcriptomic data , author=. Nature methods , volume=. 2020 , publisher=
2020
-
[24]
Applied informatics , volume=
Causal discovery and inference: concepts and recent methodological advances , author=. Applied informatics , volume=. 2016 , organization=
2016
-
[25]
Bmj , volume=
Radiation exposure and circulatory disease risk: Hiroshima and Nagasaki atomic bomb survivor data, 1950-2003 , author=. Bmj , volume=. 2010 , publisher=
1950
-
[26]
Cell and tissue research , volume=
Radiation-induced apoptosis , author=. Cell and tissue research , volume=. 2000 , publisher=
2000
-
[27]
Computational and structural biotechnology journal , volume=
Differential gene expression analysis pipelines and bioinformatic tools for the identification of specific biomarkers: A review , author=. Computational and structural biotechnology journal , volume=. 2024 , publisher=
2024
-
[28]
arXiv preprint arXiv:2412.01953 , year=
The landscape of causal discovery data: Grounding causal discovery in real-world applications , author=. arXiv preprint arXiv:2412.01953 , year=
-
[29]
Transactions on Machine Learning Research , issn=
Causal Discovery over High-Dimensional Structured Hypothesis Spaces with Causal Graph Partitioning , author=. Transactions on Machine Learning Research , issn=. 2025 , url=
2025
-
[30]
Bioinformatics , volume=
TopHat: discovering splice junctions with RNA-Seq , author=. Bioinformatics , volume=. 2009 , publisher=
2009
-
[31]
Bioinformatics , volume=
GRNBoost2 and Arboreto: efficient and scalable inference of gene regulatory networks , author=. Bioinformatics , volume=. 2019 , publisher=
2019
-
[32]
bioRxiv , pages=
Comparison of Interventional Causal Structure Learning Algorithms for Gene Regulatory Network Inference , author=. bioRxiv , pages=. 2025 , publisher=
2025
-
[33]
Cell reports , volume=
Network inference with Granger causality ensembles on single-cell transcriptomics , author=. Cell reports , volume=. 2022 , publisher=
2022
-
[34]
Nucleic acids research , volume=
The gene ontology resource: 20 years and still GOing strong , author=. Nucleic acids research , volume=. 2019 , publisher=
2019
-
[35]
‘In silico’simulation of biological processes: Novartis Foundation Symposium 247 , volume=
The KEGG database , author=. ‘In silico’simulation of biological processes: Novartis Foundation Symposium 247 , volume=. 2002 , organization=
2002
-
[36]
Nucleic acids research , volume=
The reactome pathway knowledgebase 2024 , author=. Nucleic acids research , volume=. 2024 , publisher=
2024
-
[37]
Nucleic acids research , volume=
WikiPathways 2024: next generation pathway database , author=. Nucleic acids research , volume=. 2024 , publisher=
2024
-
[38]
The British journal of radiology , volume=
Radiation dose-rate: a factor of importance in radiobiology and radiotherapy , author=. The British journal of radiology , volume=. 1972 , publisher=
1972
-
[39]
Nucleic acids research , volume=
TRRUST v2: an expanded reference database of human and mouse transcriptional regulatory interactions , author=. Nucleic acids research , volume=. 2018 , publisher=
2018
-
[40]
Nucleic acids research , volume=
ChIP-Atlas 2021 update: a data-mining suite for exploring epigenomic landscapes by fully integrating ChIP-seq, ATAC-seq and Bisulfite-seq data , author=. Nucleic acids research , volume=. 2022 , publisher=
2021
-
[41]
Nucleic acids research , volume=
The Encyclopedia of DNA elements (ENCODE): data portal update , author=. Nucleic acids research , volume=. 2018 , publisher=
2018
-
[42]
Nucleic acids research , volume=
CORUM: the comprehensive resource of mammalian protein complexes—2019 , author=. Nucleic acids research , volume=. 2019 , publisher=
2019
-
[43]
Nucleic acids research , volume=
STRING: a database of predicted functional associations between proteins , author=. Nucleic acids research , volume=. 2003 , publisher=
2003
-
[44]
TRENDS in Genetics , volume=
Human housekeeping genes, revisited , author=. TRENDS in Genetics , volume=. 2013 , publisher=
2013
-
[45]
International journal of cell biology , volume=
Cellular stress responses: cell survival and cell death , author=. International journal of cell biology , volume=. 2010 , publisher=
2010
-
[46]
Cell death & differentiation , volume=
Classification of cell death: recommendations of the Nomenclature Committee on Cell Death 2009 , author=. Cell death & differentiation , volume=. 2009 , publisher=
2009
-
[47]
Journal of the Royal Statistical Society Series B: Statistical Methodology , volume=
Causal inference by using invariant prediction: identification and confidence intervals , author=. Journal of the Royal Statistical Society Series B: Statistical Methodology , volume=. 2016 , publisher=
2016
-
[48]
Physiological genomics , volume=
A compendium of gene expression in normal human tissues , author=. Physiological genomics , volume=. 2001 , publisher=
2001
-
[49]
Nonlinearity in biology, toxicology, medicine , volume=
Responses to low doses of ionizing radiation in biological systems , author=. Nonlinearity in biology, toxicology, medicine , volume=. 2004 , publisher=
2004
-
[50]
Mutation Research/Fundamental and Molecular Mechanisms of Mutagenesis , volume=
DNA damage response pathway in radioadaptive response , author=. Mutation Research/Fundamental and Molecular Mechanisms of Mutagenesis , volume=. 2002 , publisher=
2002
Reviewed August 2, 2026 · model on record in the stance chip above.
Discussion (0). Continue with ORCID to comment.