REVIEW 2 major objections 5 minor 35 references
AxoNet: an AI-based tool to count retinal ganglion cell axons
T0 review · 2 major / 5 minor · reviewed 2026-08-14 · deepseek-v4-flash
Pith's one-line read A neural network trained on rat optic nerves counts axons in rat and monkey tissue, outperforming existing tools.
desk verdict A solid, reproducible axon-counting tool whose rat evaluation split likely inflates the reported advantage; on NHP it is parity, not superiority. read the letter →
The pith
A machine-rendered reading of the paper's core claim, the machinery that carries it, and where it could break.
The reading
What carries the argument
The load-bearing mechanism is count-density regression by a U-Net convolutional network. Instead of segmenting individual axons, the network's final layer uses a ReLU activation to output a pixelwise density map; the axon count for an image is the sum of the density map divided by a learned scaling factor (m=1000). Training minimizes mean squared error between predicted and Gaussian-blurred manual annotation densities, with edge mirroring to avoid border artifacts. Because no hand-crafted features are used, the same network trained on rat data can be applied to monkey images.
What would settle it
Hold out whole optic nerves from training and test AxoNet on sub-images from those nerves; if mean absolute error rises from the reported 4.4 axons per image to the 8.6 level of AxonMaster or higher, the claimed accuracy is an artifact of the random sub-image split.
Extended reading notes
Core claim
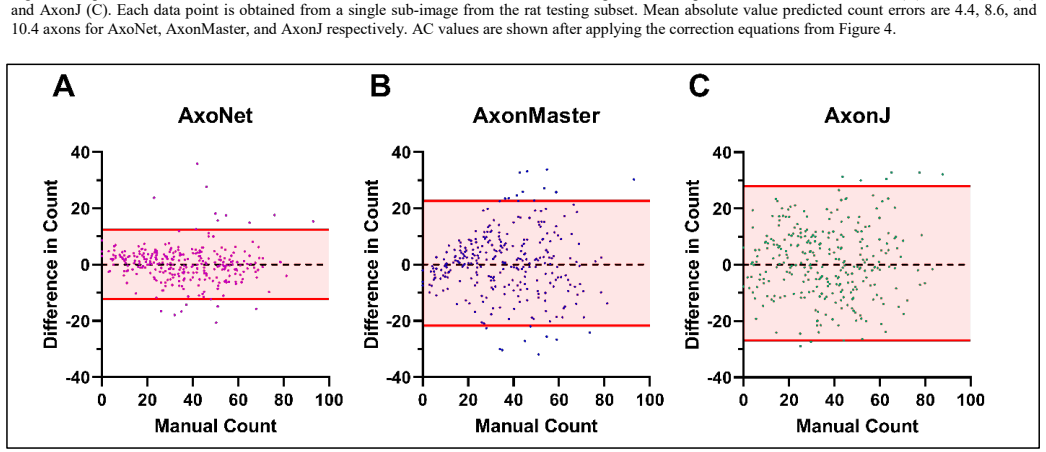
The paper claims that AxoNet, built by adapting the U-Net architecture to regress a pixelwise axon-count density, counts 'normal'-appearing retinal ganglion cell axons in light-microscopy optic nerve images with near-manual accuracy in rats (mean absolute error 4.4 axons per 12x12 µm sub-image after linear bias correction) and transfers to non-human primate images without retraining (R²=0.945 against semi-automated manual counts). On both datasets it outperforms the existing automated tools AxonMaster and AxonJ by mean absolute error, regression R², and Bland-Altman limits of agreement.
Load-bearing premise
The reported rat accuracy assumes that randomly splitting sub-images into training and test sets keeps test images independent, even though all 1,474 sub-images come from only 27 optic nerves, so images from the same nerve can appear in both sets.
Editorial extensions
If this is right
- AxoNet can replace fully manual axon counting in rat and NHP glaucoma studies, cutting analysis time to about 15 minutes per full nerve versus hours of manual counting.
- A rat-trained model works on monkey images, so the method does not require species-specific retraining to move between mammalian models.
- Because the network outputs a count density map rather than a segmentation, it can be extended to quantify other optic nerve features such as glial processes and nuclei.
- The reported 84% success rate for AxoNet counts falling within the 95% confidence interval of manual counters means automated counts are typically indistinguishable from a human counter within inter-observer variability.
- Full nerve counts around 80,000 'normal' axons in healthy rat nerves are consistent with published manual counts, validating the tool at the whole-nerve scale.
Reading between the lines
- A nerve-level validation study would determine whether the R²=0.901 rat result reflects true generalization to unseen tissue or memorization of the 27 source nerves.
- The same count-density approach could be retrained on transmission electron microscopy images to address the known ~30% underestimation of light microscopy counts.
- AxoNet's counts describe 'normal-appearing' axons, so it should not be read as a measure of total surviving retinal ganglion cells without checking how many abnormal-looking axons still function.
Signed reviews
Editorial analysis
A structured set of objections, weighed in public.
Referee Report
Summary. The paper presents AxoNet, a U-Net-based convolutional neural network that predicts pixelwise axon count density in light-microscopy images of optic nerve cross sections; the predicted density is integrated and divided by a learned scaling factor to produce an axon count. The network is trained on 1,474 manually annotated rat optic nerve sub-images drawn from 27 nerves of 14 rats, and is then applied without retraining to a separate non-human primate (NHP) dataset previously used to validate AxonMaster. The authors compare AxoNet against AxonMaster and AxonJ on both datasets, using linear bias-correction equations fitted on validation subsets, and report R², mean absolute error, and Bland-Altman limits of agreement. The central claims are that AxoNet outperforms the existing tools on both the rat and NHP datasets, and that it is robust to tissue damage, image quality, and species.
Significance. If the performance claims hold, AxoNet would be a practically useful, openly available tool for a labor-intensive neuroscience assay, and the count-density approach is a sensible alternative to per-axon segmentation. The paper's strengths are real: the code and training data are released, the tool is packaged as an ImageJ/Fiji plugin, the training procedure is described in enough detail to reproduce, the scaling-factor procedure in Eqs. (2)-(3) is an internal optimization device that is divided out of the final count and does not force agreement, and the limitation to 'normal'-appearing axons is explicitly disclosed. The main risk to the rat claim is the image-level rather than nerve-level split of the training/validation/testing data; the main risk to the NHP claim is that the reported statistics do not support the word 'outperformed.' These are load-bearing because the abstract and conclusion rest on them.
major comments (2)
- [II.A.3-II.A.4, II.B] The rat evaluation split is at the level of individual 12×12 µm sub-images, not at the level of optic nerves or animals, even though the 1,474 sub-images were sampled from only 27 nerves belonging to 14 rats. Because sub-images from the same nerve (and often the same animal) appear in both training and testing, the fully convolutional network can exploit nerve-specific staining intensity, section thickness, tissue processing, and damage level. This makes the reported rat test results (R²=0.901, MAE=4.4, and the claim that only AxoNet's limits of agreement fall within the manual-count threshold in Fig. 6) potentially inflated. The authors should re-evaluate with whole nerves (or whole animals) held out, for example via nested cross-validation over nerves, and report the range of performance across folds. The same image-level split is used for the NHP dataset, so the NHP comparisons may also be optimistic.
- [Abstract and III.B] The abstract states that AxoNet 'outperformed the existing tools on both the rat and NHP optic nerve datasets,' but the NHP results in Section III.B do not support this. AxoNet's NHP MAE was 17.8 versus AxonMaster's 18.2 with p=0.976 (not significant), and R² was 0.945 versus 0.938, with 'comparable limits of agreement.' At best, AxoNet ties with AxonMaster on the NHP dataset. The abstract and any summary statements should be revised to say that AxoNet performed comparably to AxonMaster on NHP and better than AxonMaster and AxonJ on rat, pending the nerve-level split analysis requested above.
minor comments (5)
- [Fig. 10 caption] The caption for Figure 10 says 'Each data point is a single sub-image from the rat testing subset,' but the figure shows the NHP testing subset; this should be corrected.
- [Fig. 4 caption] The caption for Figure 4 says 'Each data point is obtained from a single sub-image from the rat testing subset,' but the figure and the text indicate that the data are from the validation subset; this discrepancy should be fixed.
- [II.D.2] There is a typo: 'Kuskal-Wallis' should be 'Kruskal-Wallis.'
- [II.C.2] The sentence 'This including image mirroring and rotation...' should read 'This included image mirroring and rotation...'
- [II.B] The NHP dataset is not quantified in this manuscript (number of images, number of animals, selection procedure); since the split-level concern also applies there, the authors should provide these details or a clear reference to where they are reported.
Circularity Check
No significant circularity: AxoNet's test evaluation is independent of its training targets, and the cited prior work is an external benchmark rather than a load-bearing premise.
full rationale
AxoNet's central claim is an empirical comparison: the network is trained on manually annotated axon count density maps, and its predicted summed density is evaluated on a held-out test subset against manual counts. The density scaling factor m is explicitly divided out in Eq. 3, so it does not force the reported counts. The linear bias correction (Eqs. 4-5) is fitted on the validation subset and then applied to the testing subset, so the test-set R2 and mean absolute error are not optimized by construction on the test images. The NHP benchmark and the AxonMaster baseline come from Reynaud et al., a prior paper with overlapping authors, but the comparison target is the semi-automated manual counts from that dataset, not an unverified claim imported from that paper; thus the self-citation is not load-bearing. The U-Net and count-density ideas are cited to external sources (Ronnenberger et al., Lempitsky et al.), not to the authors' own prior work. The only substantive concern is that the rat dataset was randomly split at the sub-image level rather than at the nerve or animal level, so images from the same optic nerve may appear in both training and testing; this is a potential independence/validation flaw that could inflate the reported rat accuracy, but it is not a circularity of the derivation. No predicted quantity is defined in terms of the target by construction, and no fitted parameter is renamed as a prediction. Therefore no circular step is present.
Assumptions & free parameters
free parameters (4)
- Gaussian blur sigma and filter size =
sigma = 8 px; filter size = 33 px
- Density scaling factor m =
1000
- Training hyperparameters =
learning rate = 1e-4; 500 epochs; 100 steps/epoch; batch size = 1; dropout rate = 0.5
- Network architecture modifications =
filter count halved; ReLU final layer; same padding; input resized to 192x192 and padded to 224x224
assumptions (4)
- domain assumption Manual counts are the gold standard for axon quantification.
- domain assumption Only normal-appearing axons, defined as having an intact continuous myelin sheath, homogenous light interior, and no obvious swelling or shrinkage, are counted.
- domain assumption Sub-images randomly split into training, validation, and testing are independent observations.
- ad hoc to paper A Gaussian blur with sigma = 8 and filter size 33 converts point annotations into a valid continuous count density.
Cite this review
Pith. "Pith review of AxoNet: an AI-based tool to count retinal ganglion cell axons." pith.science (2026). https://pith.science/paper/XJCCWDJK
@misc{pith2026190802919,
  author       = {Pith},
  title        = {Pith review of: AxoNet: an AI-based tool to count retinal ganglion cell axons},
  year         = {2026},
  howpublished = {\url{https://pith.science/paper/XJCCWDJK}},
  note         = {Machine review of arXiv:1908.02919}
}
read the original abstract
Goal: In this work, we develop a robust, extensible tool to automatically and accurately count retinal ganglion cell axons in images of optic nerve tissue from various animal models of glaucoma. Methods: The U-Net convolutional neural network architecture was adapted to learn pixelwise axon count density estimates, which were then integrated over the image area to determine axon counts. The tool, termed AxoNet, was trained and evaluated using a dataset containing images of optic nerve regions randomly selected from complete cross sections of intact rat optic nerves and manually annotated for axon count and location. Both control and damaged optic nerves were used. This rat-trained network was then applied to a separate dataset of non-human primate (NHP) optic nerve images. AxoNet was then compared to two existing automated axon counting tools, AxonMaster and AxonJ, using both datasets. Results: AxoNet outperformed the existing tools on both the rat and NHP optic nerve datasets as judged by mean absolute error, R2 values when regressing automated vs. manual counts, and Bland-Altman analysis. Conclusion: The proposed tool allows for accurate quantification of axon numbers as a measure of glaucomatous damage. AxoNet is robust to variations in optic nerve tissue damage extent, image quality, and species of mammal. Significance: The deep learning method does not rely on hand-crafted image features for axon recognition. Therefore, this approach is not species-specific and can be extended to quantify additional optic nerve features. It will aid evaluation of optic nerve changes in glaucoma and potentially other neurodegenerative diseases.
Figures


Figures from the paper (5 more)




Reference graph
Works this paper leans on
-
[1]
Emerging Concepts in Glaucoma and Review of the Literature,
A. Greco et al., "Emerging Concepts in Glaucoma and Review of the Literature," Am J Med, vol. 129, no. 9, pp. 1000 e7-1000 e13, Sep 2016
work page 2016
-
[2]
Y. H. Kwon et al., "Primary open -angle glaucoma," N Engl J Med, vol. 360, no. 11, pp. 1113-24, Mar 12 2009
work page 2009
-
[3]
The normal human optic nerve. Axon count and axon diameter distribution,
F. S. Mikelberg et al., "The normal human optic nerve. Axon count and axon diameter distribution," Ophthalmology, vol. 96, no. 9, pp. 1325 -8, Sep 1989
work page 1989
-
[4]
Glaucoma drops control intraocular pressure and protect optic nerves in a rat model of glaucoma,
J. C. Morrison et al., "Glaucoma drops control intraocular pressure and protect optic nerves in a rat model of glaucoma," Invest Ophthalmol Vis Sci, vol. 39, no. 3, pp. 526-31, Mar 1998
work page 1998
-
[5]
N. Marina et al., "A semiautomated targeted sampling method to assess optic nerve axonal loss in a rat model of glaucoma," Nat Protoc, vol. 5, no. 10, pp. 1642-51, Sep 2010
work page 2010
-
[6]
Age related optic nerve axonal loss in adult Brown Norway rats,
W. O. Cepurna et al., "Age related optic nerve axonal loss in adult Brown Norway rats," Exp Eye Res, vol. 80, no. 6, pp. 877-84, Jun 2005
work page 2005
-
[7]
The number and diameter distribution of axons in the monkey optic nerve,
R. M. Sanchez et al., "The number and diameter distribution of axons in the monkey optic nerve," Invest Ophthalmol Vis Sci, vol. 27, no. 9, pp. 1342-50, Sep 1986
work page 1986
-
[8]
B. C. Chauhan et al., "Semiquantitative optic nerve grading scheme for determining axonal loss in experimental optic neuropathy," Invest Ophthalmol Vis Sci, vol. 47, no. 2, pp. 634-40, Feb 2006
work page 2006
Show all 35 references
-
[9]
Patterns of intraocular pressure elevation after aqueous humor outflow obstruction in rats,
L. Jia et al., "Patterns of intraocular pressure elevation after aqueous humor outflow obstruction in rats," Invest Ophthalmol Vis Sci, vol. 41, no. 6, pp. 1380-5, May 2000
2000
-
[10]
Efficient determination of axon number in the optic nerve: A stereological approach,
S. E. Koschade et al., "Efficient determination of axon number in the optic nerve: A stereological approach," Exp Eye Res, vol. 186, p. 107710, Jun 27 2019
2019
-
[11]
Estimating normal optic nerve axon numbers in non - human primate eyes,
G. Cull et al., "Estimating normal optic nerve axon numbers in non - human primate eyes," J Glaucoma, vol. 12, no. 4, pp. 301-6, Aug 2003
2003
-
[12]
Automated quantification of optic nerve axons in primate glaucomatous and normal eyes --method and comparison to semi-automated manual quantification,
J. Reyn aud et al., "Automated quantification of optic nerve axons in primate glaucomatous and normal eyes --method and comparison to semi-automated manual quantification," Invest Ophthalmol Vis Sci, vol. 53, no. 6, pp. 2951-9, May 1 2012
2012
-
[13]
Au tomated Axon Counting in Rodent Optic Nerve Sections with AxonJ,
K. Zarei et al., "Au tomated Axon Counting in Rodent Optic Nerve Sections with AxonJ," Sci Rep, vol. 6, p. 26559, May 26 2016
2016
-
[14]
A Novel Tree Shrew (Tupaia belangeri) Model of Glaucoma,
B. C. Samuels et al., "A Novel Tree Shrew (Tupaia belangeri) Model of Glaucoma," Invest Ophthalmol Vis Sci, vol. 59, no. 7, pp. 3136 -3143, Jun 1 2018
2018
-
[15]
U -Net: Convolutional Networks for Biomedical Image Segmentation,
O. Ronneberger et al., "U -Net: Convolutional Networks for Biomedical Image Segmentation," (in English), Medical Image Computing and Computer-Assisted Intervention, Pt Iii, vol. 9351, pp. 234-241, 2015
2015
-
[16]
Learni ng To Count Objects in Images,
V. Lempitsky and A. Zisserman, "Learni ng To Count Objects in Images," Advances in Neural Information Processing Systems 31 (Nips 2018), 2010
2018
-
[17]
Rodent models of glaucoma,
T. V. Johnson and S. I. Tomarev, "Rodent models of glaucoma," Brain Res Bull, vol. 81, no. 2-3, pp. 349-58, Feb 15 2010
2010
-
[18]
NIH Image to ImageJ: 25 years of image analysis,
C. A. Schneider et al ., "NIH Image to ImageJ: 25 years of image analysis," Nat Methods, vol. 9, no. 7, pp. 671-5, Jul 2012
2012
-
[19]
A novel method for the induction of experimental glaucoma using magnetic microspheres,
P. A. Samsel et al., "A novel method for the induction of experimental glaucoma using magnetic microspheres," Invest Ophthalmol Vis Sci, vol. 52, no. 3, pp. 1671-5, Mar 25 2011
2011
-
[20]
Experimental glaucoma induced by ocular injection of magnetic microspheres,
S. Bunker et al., "Experimental glaucoma induced by ocular injection of magnetic microspheres," J Vis Exp, no. 96, Feb 2 2015
2015
-
[21]
Early deficits in visual and retinal function in the rat microbead model of glaucoma,
B. G. Hannon et al., "Early deficits in visual and retinal function in the rat microbead model of glaucoma," in ISER Biennial Meeting, Belfast, Northern Ireland, UK, 2018
2018
-
[22]
Menopause exacerbates visual dysfunction in experimental glaucoma,
A. J. Feola et al., "Menopause exacerbates visual dysfunction in experimental glaucoma," Exp Eye Res, vol. 186, p. 107706, Jun 18 2019
2019
-
[23]
Fiji : an open -source platform for biological -image analysis,
J. Schindelin et al., "Fiji : an open -source platform for biological -image analysis," Nat Methods, vol. 9, no. 7, pp. 676-82, Jun 28 2012
2012
-
[24]
B. D. Ripley, Pattern recognition and neural networks. Cambridge ; New York: Cambridge University Press, 1996, pp. xi, 403 p
1996
-
[25]
F. Chollet. (2015). Keras. Available: https://keras.io
2015
-
[26]
TensorFlow: Large -Scale Machine Learning on Heterogeneous Distributed Systems,
M. Abadi et al., "TensorFlow: Large -Scale Machine Learning on Heterogeneous Distributed Systems," ArXiv, vol. abs/1603.04467, 2015
2015 arXiv
-
[27]
Adam: A Method for Stochastic Optimization,
D. P. Kingma and J. Ba, "Adam: A Method for Stochastic Optimization," ArXiv, vol. abs/1412.6980, 2014
2014 arXiv
-
[28]
Measuring agreement in method comparison studies,
J. M. Bland and D. G. Altman, "Measuring agreement in method comparison studies," (in English), Statistical Methods in Medical Research, vol. 8, no. 2, pp. 135-160, Jun 1999
1999
-
[29]
Assump tions of multiple regression: correcting two misconceptions,
M. N. Williams et al., "Assump tions of multiple regression: correcting two misconceptions," Practical Assessment, Research & Evaluation, vol. 18, no. 11, 2013
2013
-
[30]
Four assumptions of multiple regression that researchers should always test,
J. W. Osborne and E. Waters, "Four assumptions of multiple regression that researchers should always test," Practical Ass essment, Research & Evaluation, vol. 8, no. 2, 2002
2002
-
[31]
Translimbal laser photocoagulation to the trabecular meshwork as a model of glaucoma in rats,
H. Levkovitch-Verbin et al., "Translimbal laser photocoagulation to the trabecular meshwork as a model of glaucoma in rats," Invest Ophthalmol Vis Sci, vol. 43, no. 2, pp. 402-10, Feb 2002
2002
-
[32]
Ilastik: Interactive learning and segmentation toolkit,
C. Sommer et al., "Ilastik: Interactive learning and segmentation toolkit," in 2011 IEEE International Symposium on Biomedical Imaging: From Nano to Macro, 2011, pp. 230-233
2011
-
[33]
Crowd Counting with Density Adaption Networks,
L. G. Wang et al., "Crowd Counting with Density Adaption Networks," ArXiv, vol. abs/1806.10040, 2018
2018 arXiv
-
[34]
W-Net: Reinforced U-Net for Density Map Estimation,
V. K. Valloli and K. Mehta, "W-Net: Reinforced U-Net for Density Map Estimation," ArXiv, vol. abs/1903.11249, 2019
1903 arXiv
-
[35]
AxonDeepSeg: automatic axon and myelin segmentation from microscopy data using convolutio nal neural networks,
A. Zaimi et al., "AxonDeepSeg: automatic axon and myelin segmentation from microscopy data using convolutio nal neural networks," Sci Rep, vol. 8, no. 1, p. 3816, Feb 28 2018
2018
Reviewed August 14, 2026 · model on record in the stance chip above.
Discussion (0). Continue with ORCID to comment.