REVIEW 4 major objections 5 minor 37 references
Vector fields as a framework for modelling the mobility of commodities
T0 review · 4 major / 5 minor · reviewed 2026-08-07 · deepseek-v4-flash
Pith's one-line read A vector-field model recovers cattle trade flow directions from sparse origin-destination data.
desk verdict A transparent application of an existing vector-field idea to cattle trade, with a robustness test that is weaker than claimed; the inference claim needs external or clustered-missing validation. read the letter →
The pith
A machine-rendered reading of the paper's core claim, the machinery that carries it, and where it could break.
The reading
What carries the argument
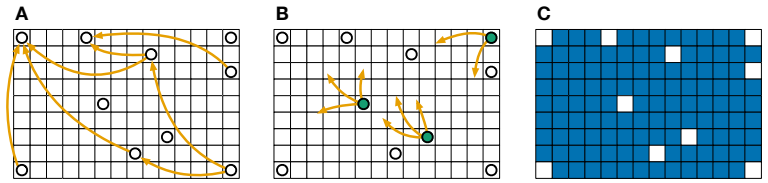
The load-bearing object is the resultant vector per spatial cell: every outgoing origin-destination trade is drawn as a vector from the cell's centre to the destination's centre, and the vectors are averaged or summed into one arrow representing that cell's dominant flow. Missing arrows are then produced by triangle-based interpolation, which triangulates the known cell centres (with boundary points set to zero vectors to limit edge artefacts) and assigns each new point a barycentric blend of the vectors at the three vertices of the triangle it falls in, $v_p = \frac{h_1 v_1 + h_2 v_2 + h_3 v_3}{h_1 + h_2 + h_3}$. This machinery carries the whole argument because the robustness result—that most interpolated directions stay within 15 degrees until over 60% of sites are removed—is a property of this interpolation scheme on the Minas Gerais data. Supporting analyses use Shannon entropy on binned monthly directions, cosine similarity between consecutive months, Moran's I on vector magnitudes, and eigenvalue classification of critical points to label sinks and sources.
What would settle it
Hold out a contiguous block of municipalities from the Minas Gerais records, rebuild the field from the remaining data, and compare interpolated vectors with the actual resultant vectors at the held-out municipalities; if more than half of the comparisons deviate by more than 15 degrees, the smoothness assumption that carries the method is false for this dataset.
Extended reading notes
Core claim
The central claim is that an origin-destination network can be re-expressed as a continuous vector field without losing the essential spatial structure of commodity flows, and that this representation supports inference where the original data are silent. Each cell's outgoing trades are summed into one resultant vector; triangle-based interpolation then fills cells with no outgoing edges, producing a field over the whole region. The authors demonstrate on Minas Gerais cattle trade that these inferred fields preserve direction under heavy data removal, reveal regions of stable versus shifting direction via entropy and cosine similarity, cluster municipalities by trade distance using Moran's I, and locate sinks and sources that coincide with slaughterhouses and breeding-season supply hubs. They present the method as a complement to network models, aimed at applications such as foot-and-mouth disease surveillance in data-poor areas.
Load-bearing premise
The load-bearing premise is that neighbouring locations influence one another's trade, so flow directions change smoothly across space; if real trade is sharp-edged, with markets and slaughterhouses pulling traffic in isolated ways, interpolated vectors at unrepresented locations will be unreliable.
Editorial extensions
If this is right
- Spatially incomplete OD datasets, common for livestock and other commodities, can still yield complete directional fields, so unrepresented municipalities get first-pass flow estimates rather than blanks.
- Public-health applications could use the interpolated directions and the seasonal sinks and sources to target foot-and-mouth-disease surveillance at places that never appear as origins or destinations.
- Because robustness is nearly invariant across years, the method can be applied to short windows such as monthly or seasonal fields, which is precisely the resolution needed to track disease-relevant movements.
- The pipeline transfers directly to other OD-format movement data, including human mobility records, without changing the core method.
Reading between the lines
- A natural stress test the paper does not run is block removal: deleting contiguous municipalities rather than random ones would probe whether the smoothness assumption holds across real market boundaries, and could overestimate robustness if field gradients are steep there.
- If the method were applied to multi-commodity or multimodal data, critical points could be compared with infrastructure maps such as slaughterhouses, ports, and warehouses; coincidences would validate the field, while mismatches would reveal where interpolation smears local structure.
- The angular-deviation statistic could be turned into a surveillance metric: a region whose interpolated direction disagrees strongly with newly collected OD records would flag anomalies such as diversions or unreported trade.
Editorial analysis
A structured set of objections, weighed in public.
Referee Report
Summary. The paper proposes a vector-field framework for commodity mobility, in which origin-destination trade records are aggregated into per-cell resultant vectors and triangle-based interpolation (Eq. 1) fills in cells lacking data. The method is applied to cattle trade in Minas Gerais, Brazil, for 2013-2016 at municipality and micro-region scales. The authors assess robustness by randomly removing spatial cells and measuring angular deviations, then analyze temporal direction diversity via Shannon entropy, temporal regularity via cosine similarity, spatial autocorrelation via Moran's I, and topology via critical points (sinks and sources). The central claims are that the vector-field approach reveals fundamental patterns in commodity mobility and can infer movement information for unrepresented locations.
Significance. If the central claim were firmly established, the framework would provide a useful alternative to network-based models, enabling interpolation, visualization, and topological analysis of commodity flows from incomplete OD data. The paper has clear strengths: the data and code are publicly available, the interpolation pipeline is explicitly specified, the leave-some-out robustness check is a reasonable internal diagnostic, and the Moran's I significance test is correctly framed with simulations. However, the validation is internal and uses a favorable random-missingness mechanism, so the paper does not currently establish the key claim about inferring flow for truly unrepresented locations. The critical-point analysis also rests on a smoothness assumption that is inconsistent with the piecewise-linear interpolation. These issues are fixable within the manuscript's scope, but they require substantive additional analysis.
major comments (4)
- [Robustness of vector fields (Fig. 3)] The robustness test only removes randomly chosen spatial cells. The stated use case is inference for locations absent from OD records, which in real data are likely to be peripheral, low-density, and spatially clustered rather than randomly scattered. Under clustered removal, the Delaunay triangles used in Eq. (1) become much larger, and interpolated vectors rely on distant vertices, so angular errors can grow substantially beyond the reported 15 degrees. To support the central claim, the authors should add experiments with spatially clustered removal (e.g., contiguous blocks or peripheral zones) and report error statistics conditioned on distance to the nearest observed cell or on triangle size. This is load-bearing because the abstract and Discussion explicitly claim inference for unrepresented locations.
- [Appendix, Interpolation of vector fields] The interpolation assigns zero vectors to selected boundary points 'to mitigate boundary effects', but this modeling choice is neither varied nor tested. Zero-vector boundary conditions pull interpolated directions toward the border and can bias fields precisely in peripheral areas where unrepresented cells are most likely to lie. This also affects the location and classification of critical points. The authors should provide a sensitivity analysis over boundary treatments (e.g., no boundary points, extrapolation, or different boundary values) or otherwise justify that the boundary choice does not drive the reported patterns.
- [Appendix, Critical points (Eqs. 4-6)] The critical-point classification uses a Taylor expansion and Jacobian eigenvalues that assume a smooth, differentiable vector field. However, the triangle-based interpolation of Eq. (1) produces a piecewise-linear field that is continuous but not differentiable along triangle edges. Critical points lying on edges have undefined Jacobians, and classifications may be artifacts of the triangulation rather than properties of the flow. The analysis should be restricted to critical points interior to triangles, or the topological analysis should use a smooth interpolation method (e.g., radial basis functions). At minimum, this limitation must be stated explicitly in the critical-points section.
- [Discussion, robustness claim] The statement that even when more than 50% of the data is removed the deviation remains below 15 degrees is presented without a precise definition of 'any change' or a confidence interval, and it is derived from the random-removal experiment only. Because the evaluation compares interpolated vectors with the original vectors from the same dataset used to construct the field, it is an internal consistency check, not an external validation. The Discussion should qualify the claim accordingly and report the full error distribution (e.g., median and quantiles) for both random and clustered missingness.
minor comments (5)
- [Appendix, Moran's I] The text refers to 'as shown in Fig. A 7A', but the relevant figure is Fig. 7A in the main text; please correct the reference.
- [Diversity and regularity of (cattle) commodity flows] The sentence containing 'commodity 1 flow direction' appears to have a stray footnote marker and should be reworded for clarity.
- [Fig. 3 caption] The caption does not define how a vector is considered to 'experience any change'; please define the threshold used in the main text.
- [Appendix, Shannon entropy (Eq. 3)] For outcomes with zero probability, the term p_i log p_i is undefined unless the convention 0 log 0 = 0 is explicitly stated; please add this convention.
- [Appendix, Moran's I (Eq. 7)] The text says z_i is the standardized value and then defines z_i = y_i - ybar, which is a centered value rather than a standardized one; please reconcile the notation.
Circularity Check
No significant circularity: the interpolation and robustness tests are internally consistent and do not reduce to fitted inputs or self-citation.
full rationale
The paper's derivation chain is self-contained and does not exhibit a circular step. Origin-destination records are aggregated into per-cell resultant vectors, and missing vectors are obtained by triangle-based interpolation using barycentric weights (Eq. 1), an externally established method cited to [23,24]. No parameter is fitted to the held-out cells during the robustness test: cells are randomly removed, the remaining known vectors are used to interpolate, and the original vectors at removed cells serve only as ground truth. This is standard cross-validation, not a case where a fitted input is renamed as a prediction. The only self-citation, [25], provides detailed cosine similarity values and is not load-bearing for the central claim; it is not used to justify an ansatz, uniqueness theorem, or modeling choice. The Appendix's zero-vector boundary assignment and the smoothness assumption are modeling limitations that may affect accuracy, but they are not definitional equivalences between input and output. Thus no specific reduction of the claimed result to its own inputs can be quoted, and the paper's inference has independent methodological content despite the absence of an external benchmark.
Assumptions & free parameters
free parameters (3)
- Number of clusters k in k-medoids =
4
- Boundary vector values in interpolation =
0
- Quadrant discretization for entropy =
4 quadrants
assumptions (3)
- domain assumption Neighboring locations exhibit similar commodity flow patterns (spatial smoothness)
- domain assumption The interpolated vector field is smooth and differentiable for critical point analysis
- ad hoc to paper Zero-vector boundary conditions mitigate edge effects
Cite this review
Pith. "Pith review of Vector fields as a framework for modelling the mobility of commodities." pith.science (2026). https://pith.science/paper/XKTANHF6
@misc{pith2026250602047,
  author       = {Pith},
  title        = {Pith review of: Vector fields as a framework for modelling the mobility of commodities},
  year         = {2026},
  howpublished = {\url{https://pith.science/paper/XKTANHF6}},
  note         = {Machine review of arXiv:2506.02047}
}
read the original abstract
Commodities, including livestock, flow through trade networks globally, with trajectories that can be effectively captured using mobility pattern modelling approaches similar to those used in human mobility studies. However, documenting these movements comprehensively presents significant challenges; it can be unrealistic, costly, and may conflict with data protection regulations. As a result, mobility datasets typically contain uncertainties due to sparsity and limitations in data collection. Origin-destination (OD) representations offer a powerful framework for modelling movement patterns and are widely adopted in mobility studies. However, these matrices possess inherent limitations: locations absent from the OD framework lack spatial information on potential mobility directions and intensities. This spatial incompleteness creates analytical gaps across different geographical scales, constraining our ability to characterise movement patterns in underrepresented areas. In this study, we introduce a vector-field-based method to address these data challenges, transforming OD data into vector fields capturing spatial flow patterns comprehensively enabling us to study mobility directions solidly. We use cattle trade data from Minas Gerais, Brazil, as our case study for commodity flows. This region's large livestock trading network makes it an ideal test case. Cattle movements are significant as they affect disease transmission, including foot-and-mouth disease. Accurately modelling these flows allows better surveillance and control strategies. Our vector-field approach reveals fundamental patterns in commodity mobility and can infer movement information for unrepresented locations. Our approach offers an alternative to traditional network-based models, enhancing our capacity to infer mobility patterns from incomplete datasets and advancing our understanding of large-scale commodity trades.
Figures


Figures from the paper (5 more)


Reference graph
Works this paper leans on
-
[1]
Human mobility: Models and applications
Barbosa H, Barthelemy M, Ghoshal G, James CR, Lenormand M, Louail T, et al. Human mobility: Models and applications. Physics Reports. 2018;734:1–74
work page 2018
-
[2]
Mobility network models of COVID-19 explain inequities and inform reopening
Chang S, Pierson E, Koh PW, Gerardin J, Redbird B, Grusky D, et al. Mobility network models of COVID-19 explain inequities and inform reopening. Nature. 2021;589(7840):82–87
work page 2021
-
[3]
Cities and countries in the global scientist mobility network
Verginer L, Riccaboni M. Cities and countries in the global scientist mobility network. Applied Network Science. 2020;5:1–16
work page 2020
-
[4]
Urban Human Mobility: Data-Driven Modeling and Prediction
Wang J, Kong X, Xia F, Sun L. Urban Human Mobility: Data-Driven Modeling and Prediction. SIGKDD Explor Newsl. 2019;21(1):1–19. doi:10.1145/3331651.3331653
-
[5]
Modeling communicable diseases, human mobility, and epidemics: A review
Soriano-Pa˜ nos D, Cota W, Ferreira SC, Ghoshal G, Arenas A, G´ omez-Garde˜ nes J. Modeling communicable diseases, human mobility, and epidemics: A review. Annalen der Physik. 2022;534(6):2100482
work page 2022
-
[6]
Optimizing surveillance for livestock disease spreading through animal movements
Bajardi P, Barrat A, Savini L, Colizza V. Optimizing surveillance for livestock disease spreading through animal movements. Journal of the Royal Society Interface. 2012;9(76):2814–2825
work page 2012
-
[7]
Lentz HH, Koher A, H¨ ovel P, Gethmann J, Sauter-Louis C, Selhorst T, et al. Disease spread through animal movements: a static and temporal network analysis of pig trade in Germany. PloS one. 2016;11(5):e0155196
work page 2016
-
[8]
A Data-Driven Approach to Cattle Epidemic Modelling Under Uncertainty
Farokhnejad S, Cardoso D, Rocha C, da Mata AS, Menezes R. A Data-Driven Approach to Cattle Epidemic Modelling Under Uncertainty. In: Pacheco D, Teixeira AS, Barbosa H, Menezes R, Mangioni G, editors. Complex Networks XIII. Cham: Springer International Publishing; 2022. p. 55–67
work page 2022
Show all 37 references
-
[9]
Trajectory data mining: An overview
Zheng Y. Trajectory data mining: An overview. ACM Transactions on Intelligent Systems and Technology (TIST). 2015;6(3):1–41
2015
-
[10]
Understanding individual human mobility patterns
Gonzalez MC, Hidalgo CA, Barabasi AL. Understanding individual human mobility patterns. nature. 2008;453(7196):779–782
2008
-
[11]
Human mobility, social ties, and link prediction
Wang D, Pedreschi D, Song C, Giannotti F, Barabasi AL. Human mobility, social ties, and link prediction. In: Proceedings of the 17th ACM SIGKDD international conference on Knowledge discovery and data mining; 2011. p. 1100–1108
2011
-
[12]
A survey of results on mobile phone datasets analysis
Blondel VD, Decuyper A, Krings G. A survey of results on mobile phone datasets analysis. EPJ data science. 2015;4:1–55
2015
-
[13]
Evaluating origin– destination matrices obtained from CDR data
Mamei M, Bicocchi N, Lippi M, Mariani S, Zambonelli F. Evaluating origin– destination matrices obtained from CDR data. Sensors. 2019;19(20):4470
2019
-
[14]
Patterns of ocean current variability on the West Florida Shelf using the self-organizing map
Liu Y, Weisberg RH. Patterns of ocean current variability on the West Florida Shelf using the self-organizing map. Journal of Geophysical Research: Oceans. 2005;110(C6)
2005
-
[15]
Glyphs for visualizing uncertainty in vector fields
Wittenbrink CM, Pang AT, Lodha SK. Glyphs for visualizing uncertainty in vector fields. IEEE transactions on Visualization and Computer Graphics. 1996;2(3):266– 279
1996
-
[16]
Visual analytics of movement: An overview of methods, tools and procedures
Andrienko N, Andrienko G. Visual analytics of movement: An overview of methods, tools and procedures. Information visualization. 2013;12(1):3–24. June 4, 2025 14/19
2013
-
[17]
Livestock infectious diseases and zoonoses; 2009
Tomley FM, Shirley MW. Livestock infectious diseases and zoonoses; 2009
2009
-
[18]
Potential for transmission of infections in networks of cattle farms
Volkova V, Howey R, Savill N, Woolhouse M. Potential for transmission of infections in networks of cattle farms. Epidemics. 2010;2(3):116–122
2010
-
[19]
The foot-and-mouth epidemic in Great Britain: pattern of spread and impact of interventions
Ferguson NM, Donnelly CA, Anderson RM. The foot-and-mouth epidemic in Great Britain: pattern of spread and impact of interventions. Science. 2001;292(5519):1155–1160
2001
-
[20]
A mathematical theory of communication
Shannon CE. A mathematical theory of communication. The Bell system technical journal. 1948;27(3):379–423
1948
-
[21]
Being critical of criticality in the brain
Beggs JM, Timme N. Being critical of criticality in the brain. Frontiers in physiology. 2012;3:163
2012
-
[22]
Vector field interpolation with radial basis functions
Smolik M, Skala V. Vector field interpolation with radial basis functions. In: Proceedings of SIGRAD 2016, May 23rd and 24th, Visby, Sweden. 127. Link¨ oping University Electronic Press; 2016. p. 15–21
2016
-
[23]
Triangle based interpolation
Watson D, Philip G. Triangle based interpolation. Journal of the International Association for Mathematical Geology. 1984;16(8):779–795
1984
-
[24]
A refinement of inverse distance weighted interpolation
Watson DF, Philip G. A refinement of inverse distance weighted interpolation. Geo-processing. 1985;2(4):315–327
1985
-
[25]
Using Vector Fields in the Mod- elling of Movements as Flows
Farokhnejad S, Oliveira M, Ribeiro E, Menezes R. Using Vector Fields in the Mod- elling of Movements as Flows. In: Teixeira AS, Botta F, Mendes JF, Menezes R, Mangioni G, editors. Complex Networks XIV. Cham: Springer Nature Switzerland
-
[26]
Brazilian beef production
Paulino P, Duarte M, Kahn L, Cottle D. Brazilian beef production. Beef cattle production and trade. 2014;107
2014
-
[27]
Regional expansion of the beef industry in Brazil: from the coast to the Amazon, 1966–2017
Vale R, Vale P, Gibbs H, Pedr´ on D, Engelmann J, Pereira R, et al. Regional expansion of the beef industry in Brazil: from the coast to the Amazon, 1966–2017. Regional Studies, Regional Science. 2022;9(1):641–664
1966
-
[28]
Introduction to nonextensive statistical mechanics: approaching a complex world
Tsallis C. Introduction to nonextensive statistical mechanics: approaching a complex world. vol. 1. Springer; 2009
2009
-
[29]
Geographic data science with python
Rey S, Arribas-Bel D, Wolf LJ. Geographic data science with python. CRC Press; 2023
2023
-
[30]
workshop-python-spatial-stats; 2021
Kawano Y. workshop-python-spatial-stats; 2021. https://github.com/yohman/ workshop-python-spatial-stats . Accessed 2025-05-10
2021
-
[31]
Local indicators of spatial association—LISA
Anselin L. Local indicators of spatial association—LISA. Geographical analysis. 1995;27(2):93–115
1995
-
[32]
Spatial analysis for the social sciences
Darmofal D. Spatial analysis for the social sciences. Cambridge University Press; 2015
2015
-
[33]
Spatial analysis: a reader in statistical geography
Berry BJL, Marble DF. Spatial analysis: a reader in statistical geography. Englewood Cliffs, NJ, Prentice-Hall. 1968;. June 4, 2025 15/19 Appendix Dataset and code availability This study examines cattle movement in Minas Gerais, Brazil, using data from the Institute of Agricu...
1968
-
[34]
Generating multiple vector fields over predetermined time intervals ( e.g., months over four years)
-
[35]
Computing cosine similarity values between consecutive intervals for each region
-
[36]
June 4, 2025 17/19
Constructing feature vectors for each region based on these similarity values. June 4, 2025 17/19
2025
-
[37]
Applying clustering methods to group regions with similar temporal mobility patterns. This approach allows us to categorise regions based on the stability and evolution of their commodity flow directions, offering insights into the persistence and variability of trade movement...
2025
Reviewed August 7, 2026 · model on record in the stance chip above.
Discussion (0). Sign in to comment.