Slowing-down reduction and Possible Reversal Trend of Tropospheric NO2 over China during 2016 to 2019
Pith reviewed 2026-05-24 21:04 UTC · model grok-4.3
The pith
Satellite observations indicate that NO2 reduction over China slowed or reversed after 2016 in many provinces.
A machine-rendered reading of the paper's core claim, the machinery that carries it, and where it could break.
Core claim
After 2016 a significant slowing-down of the reduction trend and/or even a reversal trend were found in numerous provinces, particularly in those with heavy NO2 level, based on satellite observations. Error analysis on satellite data excluded cloud contamination and instrument anomalies as the main reasons. Ground-based measurements show strong positive correlations with satellite observations and similar patterns of year-to-year changes of NO2 in 2018 and 2019 winter time. The temporal variations of satellite NO2 over China are believed largely determined by surface emission from power plant and transportation.
What carries the argument
Time series of satellite-retrieved tropospheric NO2 column densities analyzed at provincial and national scales to detect changes in linear trend slope after 2016.
If this is right
- Emission inventories must be extended past 2015 to identify which source sectors produced the observed change.
- Air-quality control policies may require revision if the new trend persists.
- Ground and satellite data should be compared routinely in future winters to confirm the pattern.
- Provincial-level trend monitoring becomes necessary because the national average masks regional reversals.
Where Pith is reading between the lines
- If the slowdown reflects relaxed enforcement or renewed economic activity, similar reversals could appear in other rapidly developing regions once inventories catch up.
- Routine intercomparison of multiple satellite products after 2016 would test whether the trend shift is retrieval-specific.
Load-bearing premise
Satellite NO2 retrieval accuracy remained constant after 2016 once obvious cloud and instrument problems are removed.
What would settle it
An updated national emission inventory through 2019 or extended ground-station records that show continued steady NO2 reductions without slowdown or reversal would contradict the reported trend change.
Figures
read the original abstract
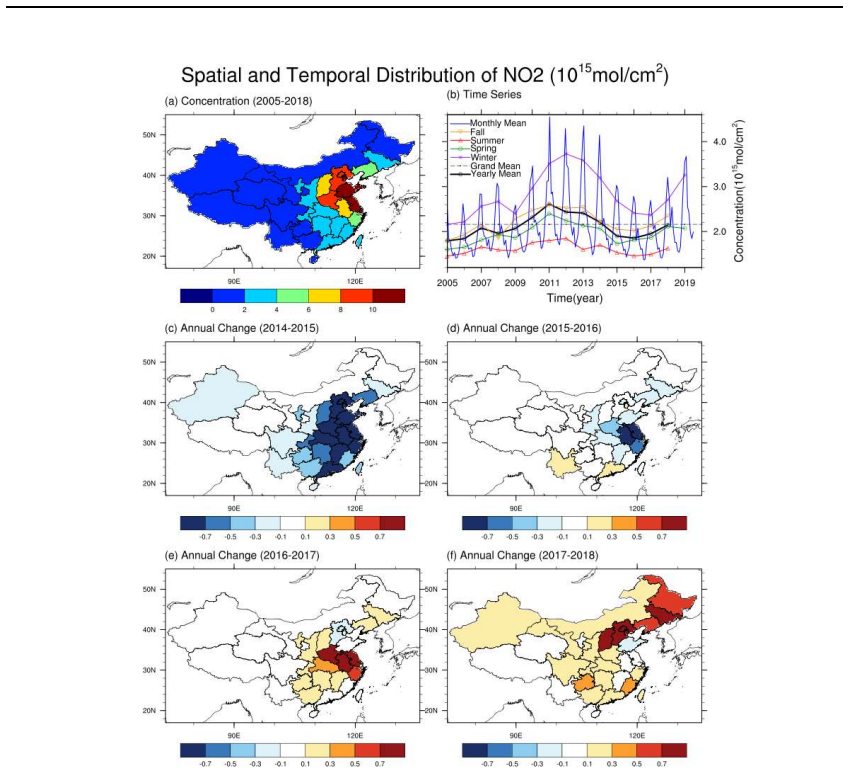
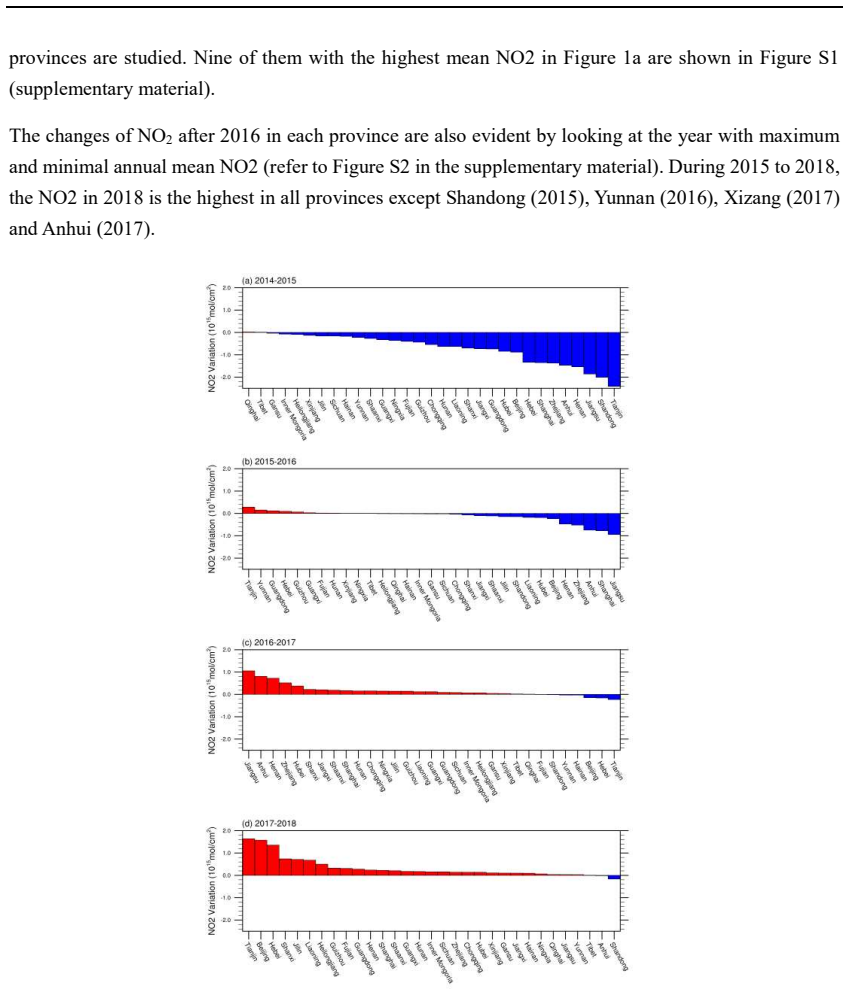
Atmospheric nitrogen dioxide (NO2) over China at national level has been kept reducing since 2011 as seen from both satellite observations, ground-based measurements and bottom-up emission inventory (Liu et al., 2016; Irie et al., 2016; Krotkov et al., 2016; Foy et al., 2016; Liu et al 2017). These studies used data before 2015-2016. After 2016, however, a significant slowing-down of the reduction trend and/or even a reversal trend were found in numerous provinces, particularly in those with heavy NO2 level, based on satellite observations. Error analysis on satellite data excluded cloud contamination, instrument anomalies from the main reasons of this change. Ground-based measurements show strong positive correlations with satellite observations and similar patterns of year-to-year changes of NO2 in 2018 and 2019 winter time. The temporal variations of Satellite NO2 over China are believed largely determined by surface emission from power plant and transportation. The reason for the recent change from emission perspective cannot be traced down since the national emission inventory was not updated since 2015. We therefore call on immediate attentions from both scientist community and policy makers to this phenomenon. Further efforts should be made to understand the reasons causing this change and to make associated air pollution controlling actions.
Editorial analysis
A structured set of objections, weighed in public.
Referee Report
Summary. The manuscript reports that tropospheric NO2 over China exhibited a national-level reduction trend from 2011 onward based on satellite, ground, and inventory data, but after 2016 satellite observations show a significant slowing-down of this reduction or even a reversal trend in numerous provinces (especially high-NO2 ones). Error analysis rules out cloud contamination and instrument anomalies as causes; ground measurements correlate with satellite patterns in 2018-2019 winters; variations are attributed to surface emissions from power plants and transport, but the lack of post-2015 emission inventories prevents tracing the cause, prompting a call for attention and further study.
Significance. If substantiated with quantitative detail, the reported post-2016 trend break would be significant for air-quality policy, as it could indicate changes in emission controls or unaccounted sources after the period covered by existing inventories, highlighting the value of continued satellite-ground monitoring for detecting such shifts.
major comments (3)
- [Abstract] Abstract: the central claim of a 'significant slowing-down of the reduction trend and/or even a reversal trend' after 2016 provides no quantitative trend slopes, break-point statistics, confidence intervals, or province-level values, so the magnitude and robustness of the reported change cannot be assessed from the given information.
- [Abstract] Abstract: ground-based measurements are stated to 'show strong positive correlations with satellite observations and similar patterns of year-to-year changes' in 2018-2019, yet no correlation coefficients, regression slopes, R² values, or province-specific agreement metrics are supplied to support this validation.
- [Abstract] Abstract: the error analysis is said to have 'excluded cloud contamination, instrument anomalies from the main reasons,' but supplies neither the quantitative error bars, the specific tests performed, nor any discussion of whether a priori NO2 profiles, surface albedo, or aerosol assumptions in the retrieval remained constant across the 2016 boundary.
minor comments (1)
- [Abstract] Abstract contains minor grammatical and capitalization inconsistencies (e.g., 'kept reducing', 'Satellite NO2').
Simulated Author's Rebuttal
We thank the referee for the constructive comments on the abstract. We agree that quantitative details are needed to strengthen the presentation of our findings and will revise the abstract accordingly in the next version of the manuscript.
read point-by-point responses
-
Referee: [Abstract] Abstract: the central claim of a 'significant slowing-down of the reduction trend and/or even a reversal trend' after 2016 provides no quantitative trend slopes, break-point statistics, confidence intervals, or province-level values, so the magnitude and robustness of the reported change cannot be assessed from the given information.
Authors: We agree that the abstract lacks the requested quantitative support for the central claim. The main text contains the underlying trend calculations from satellite data (including pre- and post-2016 slopes, break-point detection, and province-specific values with uncertainties), but these were not summarized in the abstract. In the revised manuscript we will insert concise quantitative statements (e.g., national and selected provincial trend slopes before/after 2016, break-point years with p-values or confidence intervals) directly into the abstract. revision: yes
-
Referee: [Abstract] Abstract: ground-based measurements are stated to 'show strong positive correlations with satellite observations and similar patterns of year-to-year changes' in 2018-2019, yet no correlation coefficients, regression slopes, R² values, or province-specific agreement metrics are supplied to support this validation.
Authors: We acknowledge the omission. The main text reports the correlation analysis between satellite and ground-based NO2 for the 2018–2019 winter period, including coefficients and province-level comparisons, but these statistics were not included in the abstract. We will add representative correlation coefficients, R² values, and a brief statement on the spatial agreement to the revised abstract. revision: yes
-
Referee: [Abstract] Abstract: the error analysis is said to have 'excluded cloud contamination, instrument anomalies from the main reasons,' but supplies neither the quantitative error bars, the specific tests performed, nor any discussion of whether a priori NO2 profiles, surface albedo, or aerosol assumptions in the retrieval remained constant across the 2016 boundary.
Authors: We agree that the abstract should be more explicit. The main text describes the error analysis (cloud filtering tests, instrument stability checks, and sensitivity to retrieval assumptions), but the abstract condenses this to a single sentence. In revision we will add brief quantitative error estimates and note that the key retrieval inputs (a priori profiles, albedo, aerosols) were held consistent across the 2016 boundary according to the QA4ECV OMI product documentation. If space constraints remain, we will move the expanded error discussion to the main text while retaining a concise statement in the abstract. revision: yes
Circularity Check
No circularity: purely observational trend report
full rationale
The paper reports observed trends in satellite NO2 data post-2016 and compares them to ground measurements without any derivation, fitted parameters presented as predictions, or load-bearing self-citations. The central claim rests on direct data analysis (satellite retrievals and ground correlations) rather than any equation or model that reduces to its own inputs by construction. Error analysis is mentioned only at a high level to exclude specific artifacts, with no mathematical steps or ansatzes involved. This is a standard observational report whose validity depends on data quality, not on circular reasoning.
Axiom & Free-Parameter Ledger
axioms (1)
- domain assumption Satellite NO2 columns after 2016 remain comparably accurate to pre-2016 retrievals once clouds and instrument anomalies are excluded.
Lean theorems connected to this paper
-
IndisputableMonolith/Foundation/RealityFromDistinction.leanreality_from_one_distinction unclear?
unclearRelation between the paper passage and the cited Recognition theorem.
After 2016, however, a significant slowing-down of the reduction trend and/or even a reversal trend were found in numerous provinces... based on satellite observations.
What do these tags mean?
- matches
- The paper's claim is directly supported by a theorem in the formal canon.
- supports
- The theorem supports part of the paper's argument, but the paper may add assumptions or extra steps.
- extends
- The paper goes beyond the formal theorem; the theorem is a base layer rather than the whole result.
- uses
- The paper appears to rely on the theorem as machinery.
- contradicts
- The paper's claim conflicts with a theorem or certificate in the canon.
- unclear
- Pith found a possible connection, but the passage is too broad, indirect, or ambiguous to say the theorem truly supports the claim.
Reference graph
Works this paper leans on
-
[1]
School of Earth and Space Science, University of Science and Technology of China
-
[2]
Comparative Planetary Excellence Innovation Center, Chinese Academy of Sciences , Hefei,230026, China * Corresponding Author: wangyu09@ustc.edu.cn R. Li and H. Bo made equal contribution to this study Atmospheric nitrogen dioxide (NO2) over China at national level has been kept reducing since 2011 as seen from both satellite observations, ground-based mea...
work page 2011
-
[3]
Results The column density of NO2 in China mainly is determined by anthropogenic emission
and NO2 concentration from ground sites (2015-2019) to study the trend of NO2 in the recent years. Results The column density of NO2 in China mainly is determined by anthropogenic emission. Therefore, its spatial and temporal distribution is closely related to the status of the development and perturbations of economy. From the map of long-term mean NO2 d...
work page 2015
-
[4]
shows clear interannual variation of increasing from 2005 to 2011 and decreasing from 2011 to 2015/2016. The general pattern and this long-term trend of NO2 are consistent with the results from previous studies as mentioned in the introduction. However, there is a change of trend in Figure 1b by looking at the time series after 2015-2016. First, the decre...
work page 2005
-
[5]
Nitrogen dioxide concentrations in the atmosphere
Brewer AC, McElroy CT, Kerr JB. Nitrogen dioxide concentrations in the atmosphere. Nature 1973;246:129–33. doi: 10.1038/246129a0 . https://doi.org/10. 1038/246129a0
-
[6]
The Chinese Government Website
Circular of the State Council on the Issuance of the Comprehensive Work Plan on Energy Saving and Emission Reduction in the Thirteenth Five-Year Plan, 2016. The Chinese Government Website. Available online: http://www.gov.cn/zhengce/content/2017-01/05/content_5156789.htm (accessed on 15 June 2018). (In Chinese)
work page 2016
-
[7]
de Foy, B., Lu, Z., and Streets, D. G.: Satellite NO2 retrievals suggest China has exceeded its NOx reduction goals from the twelfth Five-Year Plan, Scientific Reports, 6, 35912, https://doi.org/10.1038/srep35912, 2016
-
[8]
Irie, H., Muto, T., Itahashi, S., Kurokawa, J., and Uno, I.: Turnaround of tropospheric nitrogen dioxide pollution trends in China, Japan, and South Korea, SOLA, 12, 170–174, doi:10.2151/sola.2016-035, 2016
-
[9]
Krotkov, N. A., McLinden, C. A., Li, C., Lamsal, L. N., Celarier, E. A., Marchenko, S. V ., Swartz, W. H., Bucsela, E. J., Joiner, J., Duncan, B. N., Boersma, K. F., Veefkind, J. P., Levelt, P. F., Fioletov, V . E., Dickerson, R. R., He, H., Lu, Z., and Streets, D. G.: Aura OMI observations of regional SO2 and NO2 pollution changes from 2005 to 2015, Atmo...
-
[10]
F., Hilsenrath, E., Leppelmeier, G
Levelt, P. F., Hilsenrath, E., Leppelmeier, G. W., van den Oord, G. B. J., Bhartia, P. K., Tamminen, J., de Haan, J. F., and Veefkind, J. P.: Science objectives of the Ozone Monitoring Instrument, IEEE Trans. Geosci. Remote Sens., 44, 1199–1208, doi:10.1109/TGRS.2006.872336, 2006
-
[11]
F., Joiner, J., Tamminen, J., Veefkind, J
Levelt, P. F., Joiner, J., Tamminen, J., Veefkind, J. P., Bhartia, P. K., Stein Zweers, D. C., Duncan, B. N., Streets, D. G., Eskes, H., van der A, R., McLinden, C., Fioletov, V ., Carn, S., de Laat, J., DeLand, M., Marchenko, S., McPeters, R., Ziemke, J., Fu, D., Liu, X., Pickering, K., Apituley, A., González Abad, G., Arola, A., Boersma, F., Chan Miller...
-
[12]
Liu, F., Zhang, Q., van der A, R. J., Zheng, B., Tong, D., Yan, L., Zheng, Y ., and He, K.: Recent reduction in NOx emissions over China: synthesis of satellite observations and emission inventories, Environ. Res. Lett., 11, 114002, https://doi.org/10.1088/1748-9326/11/11/114002, Liu, F., Beirle, S., Zhang, Q., van der A, R. J., Zheng, B., Tong, D., and H...
-
[13]
Mills, I. C., Atkinson, R. W., Kang, S., Walton, H. & Anderson, H. R. Quantitative systematic review of the associations between
-
[14]
Richter, A., Burrows, J. P., Nuss, H., Granier, C., and Niemeier, U.: Increase in tropospheric nitrogen dioxide over China observed from space, Nature, 437(7055), 129–132, 2005
work page 2005
-
[15]
BMJ open 5, doi: 10.1136/bmjopen-2014-006946
short-term exposure to nitrogen dioxide and mortality and hospital admissions. BMJ open 5, doi: 10.1136/bmjopen-2014-006946
-
[16]
Solomon, S. et al. On the role of nitrogen dioxide in the absorption of solar radiation. J. Geophys. Res. 104 (D10), 12047–12058 (1999) Supplementary Material Figure S1: Time series of monthly mean NO2 column density from Aura OMI in nine provinces in China. Figure S2: The distribution of the years with maximum and minimum NO2 column density from Aura OMI...
work page 1999
discussion (0)
Sign in with ORCID, Apple, or X to comment. Anyone can read and Pith papers without signing in.