Spatial Principal Component Analysis and Moran Statistics for Multivariate Functional Areal Data
Pith reviewed 2026-05-23 22:22 UTC · model grok-4.3
The pith
Multivariate functional Moran's I and mfasPCA measure spatial autocorrelation in functional areal data.
A machine-rendered reading of the paper's core claim, the machinery that carries it, and where it could break.
Core claim
Multivariate functional Moran's I, mfasPCA, and the integrated permutation testing framework accurately assess spatial autocorrelation and structural patterns in functional areal data.
What carries the argument
multivariate functional Moran's I and mfasPCA, which extend Moran's I and PCA to handle multivariate functional observations on spatial areal units while preserving the functional and spatial structure.
If this is right
- The omnibus tests can detect dependence in both positive and negative spatial subspaces.
- Component-wise tests with Holm adjustment control the family-wise error rate across eigencomponents.
- The sequential rank-wise procedure orders components by strength of spatial signal.
- The methods apply directly to empirical functional areal datasets to reveal hidden spatial structures.
Where Pith is reading between the lines
- The same permutation framework could be reused to compare different spatial weight matrices without new theory.
- mfasPCA scores might serve as low-dimensional inputs for subsequent spatial regression models on the same areal units.
- Extension to non-areal domains such as point-referenced functional data would require only changes to the weight matrix definition.
Load-bearing premise
The simulation studies and empirical application are representative enough to establish the accuracy and general utility of the new statistics and testing procedures for functional areal data.
What would settle it
A new simulation study in which the proposed statistics and tests fail to detect planted spatial autocorrelation patterns of known strength in multivariate functional areal data would falsify the efficacy claim.
Figures
read the original abstract
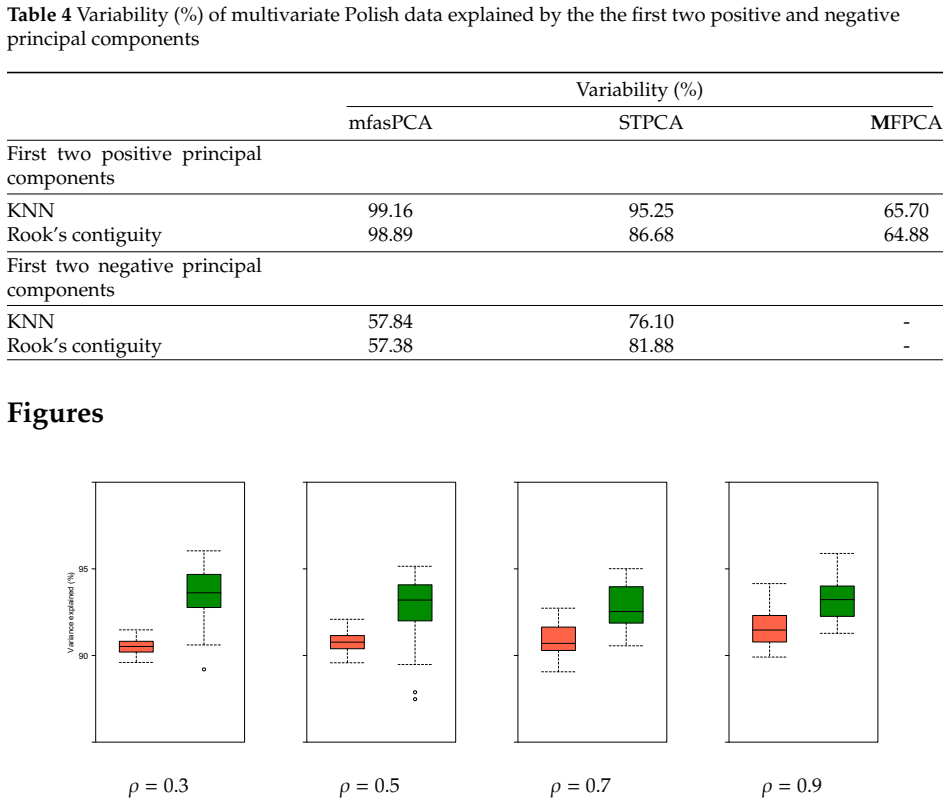
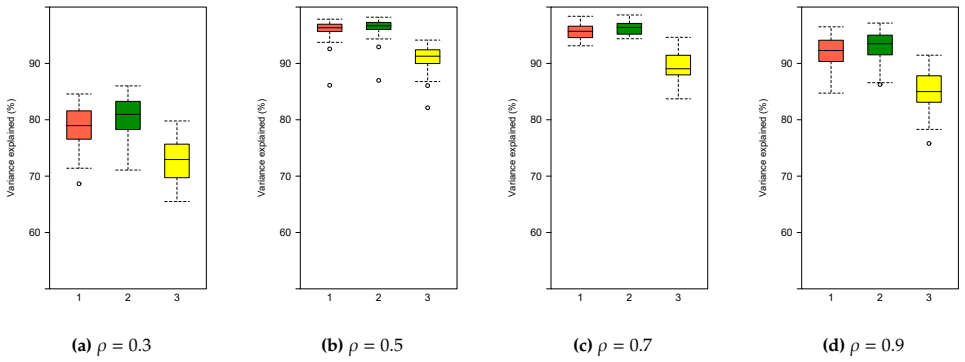
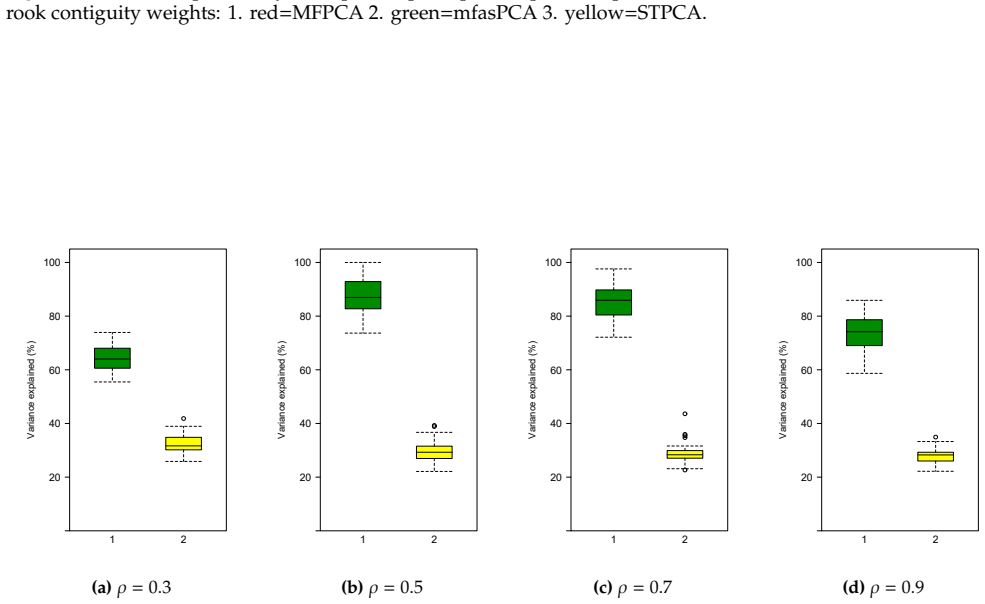
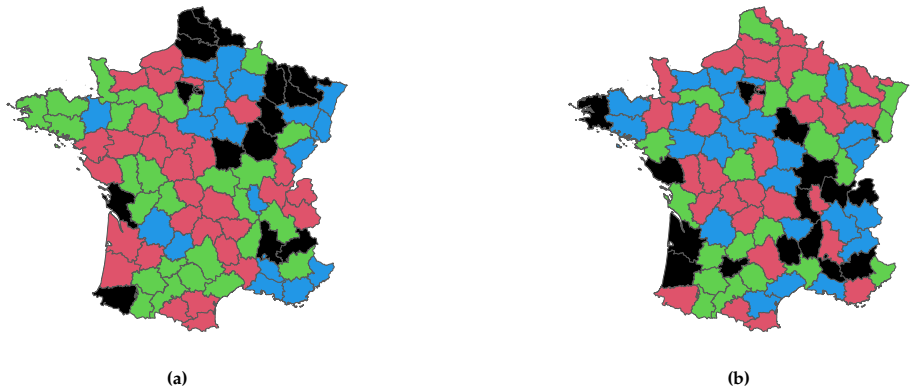
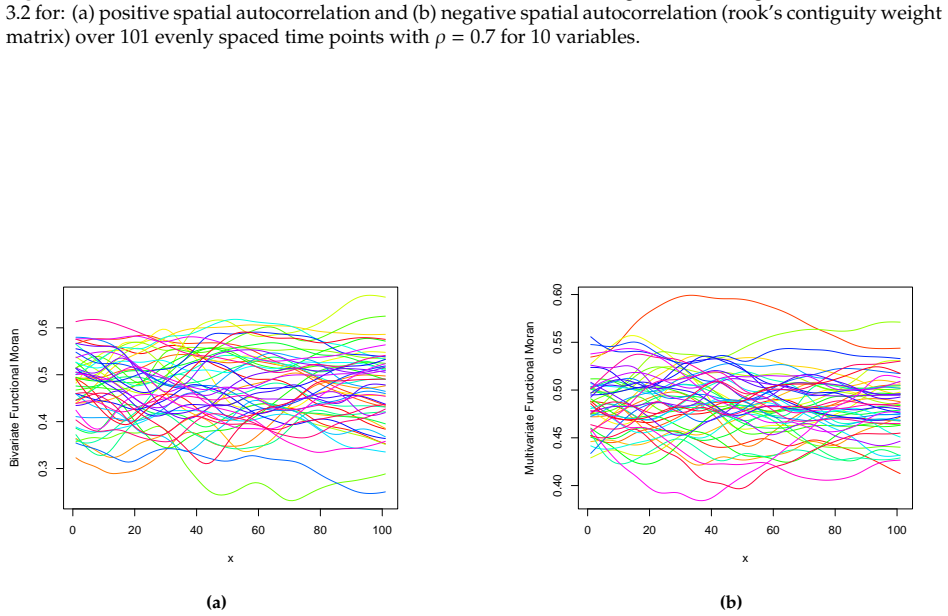
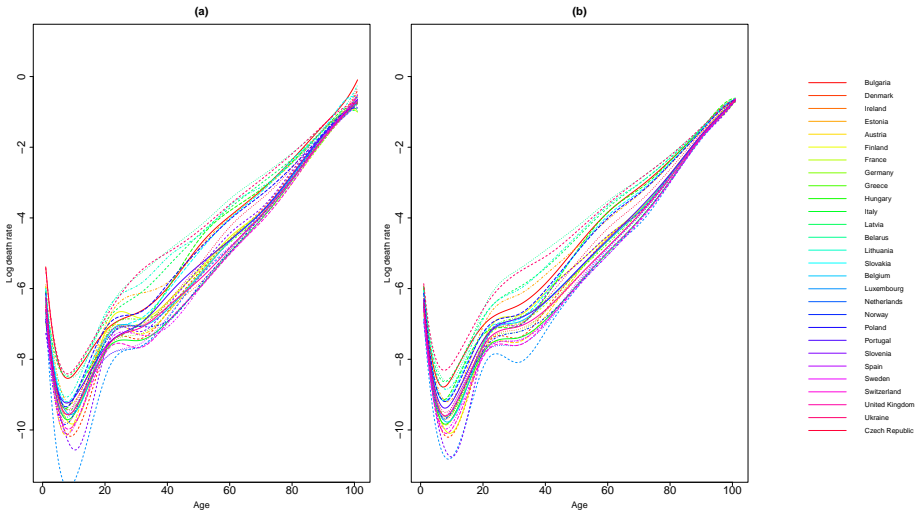
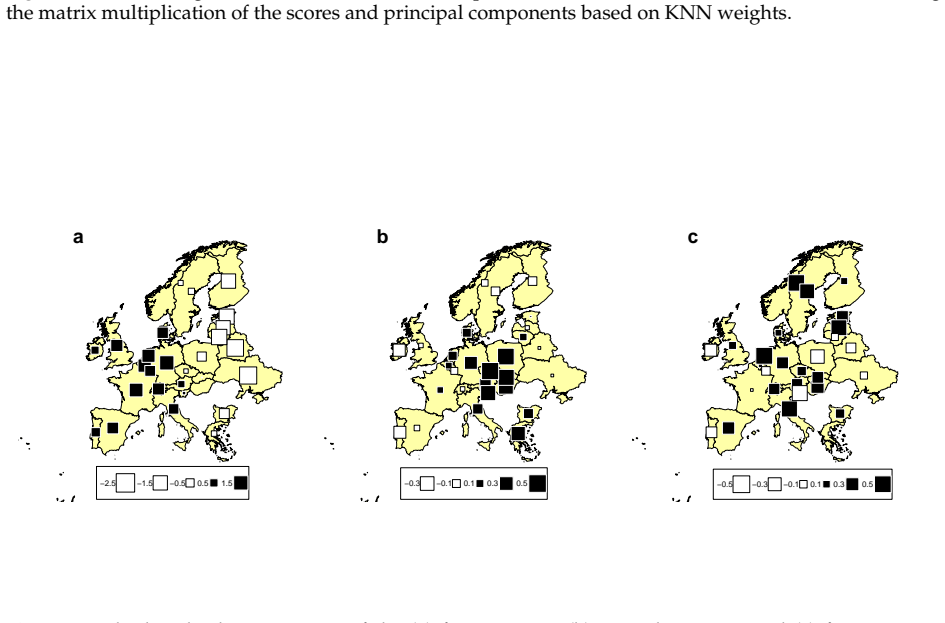
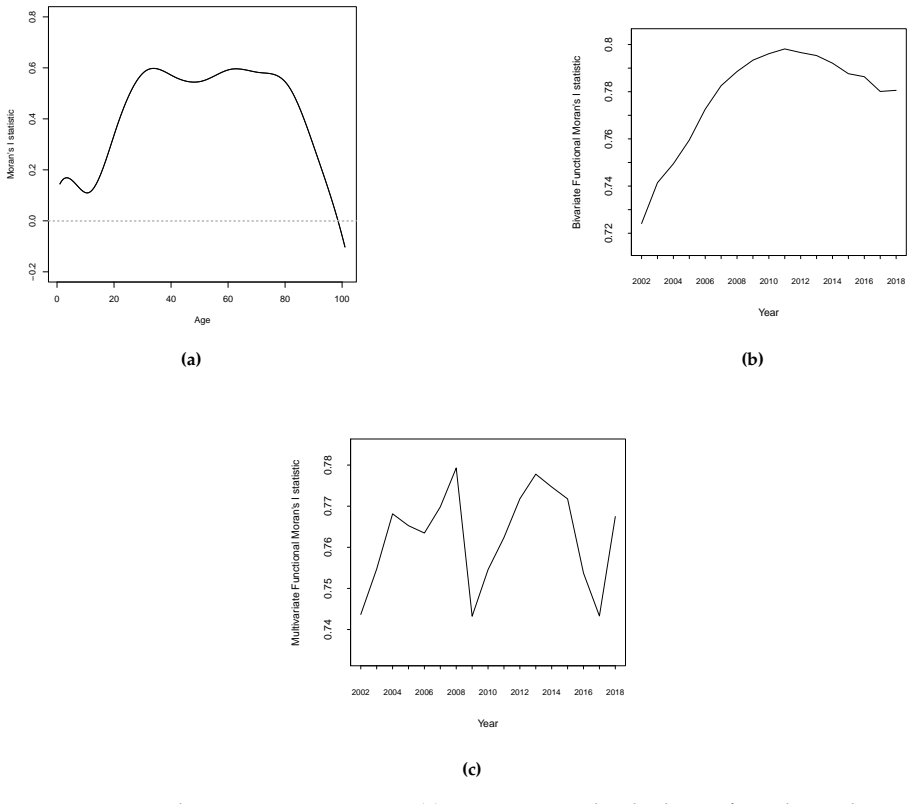
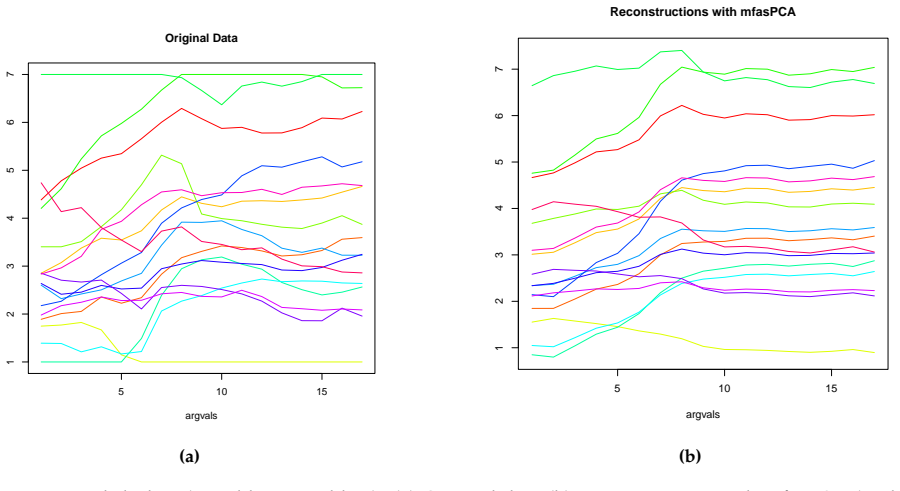
The paper introduces a multivariate functional areal spatial principal component analysis (mfasPCA) framework, together with multivariate functional Moran's I statistics, to enable the assessment of spatial autocorrelation and dimension reduction for multivariate functional data observed over areal units. The proposed framework is spatial-functional in scope: the functional argument may represent time, age, wavelength, or another ordered continuum, while spatial dependence is introduced across areal units through a spatial weight matrix. The principal component method is defined through a Moran-type spatially weighted criterion. We propose eigenvalue-based permutation tests to assess the significance of spatially structured components. The testing framework includes omnibus tests, componentwise tests with Holm adjustment, and sequential rank-wise tests based on tail sums of eigenvalues. Simulation studies show that mfasPCA captures positive and negative spatial-functional structures and concentrates them in the leading components under the respective autocorrelation regimes. A real-data application illustrates how mfasPCA identifies spatially structured modes of multivariate functional variation.
Editorial analysis
A structured set of objections, weighed in public.
Referee Report
Summary. The paper develops multivariate functional Moran's I along with multivariate functional areal spatial principal component analysis (mfasPCA) for functional areal data. It also introduces a permutation-based testing framework that includes omnibus tests for spatial dependence in positive and negative subspaces, component-wise per-eigen tests with Holm correction for family-wise error rate control, and a sequential rank-wise testing procedure. Efficacy is asserted via comprehensive simulation studies and an empirical application demonstrating accurate assessment of spatial autocorrelation and structural patterns.
Significance. If the derivations, simulation designs, and empirical results hold, the work extends classical spatial statistics (Moran's I and PCA) to the multivariate functional areal setting and supplies a coherent testing framework; this could fill a methodological gap for data types common in environmental and geographic applications.
minor comments (1)
- The abstract asserts efficacy from simulations and an application but provides no quantitative details (e.g., power curves, type-I error rates, or data characteristics); the full manuscript should supply these in a dedicated simulation section with explicit design parameters.
Simulated Author's Rebuttal
We thank the referee for their summary of the manuscript. The recommendation is listed as uncertain, yet the report contains no specific major comments to address. We remain available to provide clarifications or revisions should any particular concerns arise.
Circularity Check
No significant circularity identified
full rationale
The paper introduces new methodological contributions—multivariate functional Moran's I, mfasPCA, and a permutation-based testing framework—explicitly presented as developments for functional areal data. Validation occurs via simulation studies and empirical application, which constitute independent empirical checks rather than reductions of predictions to fitted inputs or self-citations. No load-bearing steps in the abstract or described structure equate outputs to inputs by construction, self-definition, or imported uniqueness theorems; the evidentiary chain remains self-contained against external benchmarks.
Axiom & Free-Parameter Ledger
Lean theorems connected to this paper
-
IndisputableMonolith/Foundation/RealityFromDistinction.leanreality_from_one_distinction unclear?
unclearRelation between the paper passage and the cited Recognition theorem.
multivariate functional Moran's I ... mfasPCA ... permutation-based testing framework
-
IndisputableMonolith/Cost/FunctionalEquation.leanwashburn_uniqueness_aczel unclear?
unclearRelation between the paper passage and the cited Recognition theorem.
In(S(x)) = ... trace functional Moran’s index ... mfasPCA decomposition
What do these tags mean?
- matches
- The paper's claim is directly supported by a theorem in the formal canon.
- supports
- The theorem supports part of the paper's argument, but the paper may add assumptions or extra steps.
- extends
- The paper goes beyond the formal theorem; the theorem is a base layer rather than the whole result.
- uses
- The paper appears to rely on the theorem as machinery.
- contradicts
- The paper's claim conflicts with a theorem or certificate in the canon.
- unclear
- Pith found a possible connection, but the passage is too broad, indirect, or ambiguous to say the theorem truly supports the claim.
discussion (0)
Sign in with ORCID, Apple, or X to comment. Anyone can read and Pith papers without signing in.