REVIEW 3 major objections 5 minor 88 references
Texture: Structured Exploration of Text Datasets
T0 review · 3 major / 5 minor · reviewed 2026-08-16 · deepseek-v4-flash
Pith's one-line read One tool, ten datasets: configurable attributes speed text exploration
desk verdict Solid systems contribution with a credibly expressive schema, but the effectiveness claims outrun a non-counterbalanced, self-reported study. read the letter →
The pith
A machine-rendered reading of the paper's core claim, the machinery that carries it, and where it could break.
The reading
What carries the argument
The central object is the five-type attribute schema (text, single-value, list, span list, and embedding) that lets any text dataset be described at arbitrary granularity. The load-bearing mechanism is normalization: multi-valued list attributes are split into separate tables linked back to documents, and span lists additionally store the character positions of each occurrence. That layout lets every overview chart, filter, and search be executed as relational SQL queries over joined tables, which is what makes cross-filtering between word-level and document-level attributes fast and makes span highlighting unambiguous. Embeddings are treated as a first-class attribute type so that projection overviews and similarity search plug into the same filtering pipeline as any other attribute.
What would settle it
A counterbalanced study where each participant analyzes the same dataset twice, once with Texture and once with their usual workflow, would settle the central claim: if the usual-workflow second session produces comparable new insights at comparable speed, the reported gains are repeated-exposure effects, not tool effects.
Extended reading notes
Core claim
The paper's central discovery is that a text exploration tool can be made general-purpose by separating what an analyst derives from how it is explored. It defines five attribute types (text, single-value, list, span list, and embedding) and prescribes storing multi-valued attributes in normalized tables linked to documents by foreign keys, with span lists keeping character offsets. Around this schema the interface combines automatic per-attribute overview charts, cross-filtering across any combination of attributes, an embedding projection with similarity search, and a document view that highlights matching spans. The user study with ten participants and ten distinct datasets is offered as evidence that this design is expressive enough to absorb all the attributes analysts already use, fast enough to shorten the iteration loop, and capable of surfacing new findings such as duplicate-heavy clusters in a corpus.
Load-bearing premise
The evaluation assumes that the faster iteration and new insights seen in the second session came from the tool rather than from participants having already spent a session thinking about the same familiar dataset, because the baseline always came first and the sessions were not counterbalanced.
Editorial extensions
If this is right
- Analysts can move between datasets from different domains (research abstracts, song lyrics, Reddit posts, chatbot logs) without switching tools, as long as they can express their attributes in the five-type schema.
- Because attribute derivation is decoupled from exploration, any attribute computable in code can be explored immediately, including LLM-derived topics or custom metadata.
- Embedding overviews and similarity search become routine rather than expert-only, letting users find duplicate clusters and outliers even when they would not have computed embeddings themselves.
- Cross-filtering across granularities lets a user start from a word-level filter and immediately see document-level distributions (for example, the years or authors associated with that word), supporting top-down and bottom-up analysis paths.
Reading between the lines
- The schema's normalized table layout implies a direct path to scaling, because all filters compile to joins over indexed tables; the approach could likely extend well beyond the 16,000-document maximum in the study.
- The two data-quality discoveries (duplicate posts and near-duplicate prompts) suggest that embedding-based exploration doubles as a corpus audit tool, a use the paper documents but does not frame as a primary contribution.
- A natural, untested extension is bringing attribute derivation into the interface (for example, LLM-generated attributes verified immediately), which would close the loop the paper identifies as future work and could make the reported iteration gains larger.
Signed reviews
Editorial analysis
A structured set of objections, weighed in public.
Referee Report
Summary. Texture proposes a configurable data schema for text datasets (text, single-value, list, span-list, and embedding attribute types) and an interactive tool that combines automatic attribute overview visualizations, cross-filtering, embedding-based overview and similarity search, and document-level contextualization. The paper reports a two-part user study with 10 participants, each of whom first demonstrated their baseline analysis workflow on their own dataset and later explored the same dataset with Texture. The central claims are that the schema is expressive enough to represent all participant-derived attributes, that Texture enables users to iterate more quickly, and that it leads to new insights about their data.
Significance. If the effectiveness claims held, this would be a solid contribution to text visualization: the attribute schema is a simple and sensible formalization that covers common granularities, and the system integrates familiar interaction techniques in a coherent, open-source implementation. The use of ten real datasets contributed by participants is a real strength, and the direct demonstration that all participant attributes fit the schema is convincing. However, the comparative evaluation is not strong enough to support the speed and insight-discovery claims, because the design conflates the interface with added attributes and with mere repeated exposure. The core conceptual and engineering contribution is defensible, but the empirical claims as stated in the abstract require either stronger evidence or careful tempering.
major comments (3)
- [Section 4.1 and Section 6.4] The evaluation does not control for learning or order effects. All participants completed the baseline session before the Texture session on the same dataset, with no counterbalancing and no control condition. The baseline session was an active think-aloud interview that required participants to re-articulate their analysis questions, demonstrate their workflow, and reflect on the data; that process alone can generate additional insights on a second encounter. Section 6.4 acknowledges this possibility ('additional insights could come simply from additional exposure') but dismisses it because participants already knew their datasets, without any test or evidence. This assumption is load-bearing for the abstract claims that Texture 'enabled participants to more quickly iterate' and 'discover new insights.' As written, the observed differences could be explained by repeated exposure or by the added baseline reflection, so the comparative claims are not supported.
- [Section 4.1 and Section 6.3] The Texture session introduced new analytical attributes not present in the baseline condition. Section 4.1 states that the research team 'derived words from the text attributes with the spans if words were discussed in the baseline interview, and added document embeddings for the text using the OpenAI text-embedding-3-small model if participants did not already provide them.' The headline discoveries in Section 6.3 (P9's duplicate Reddit posts and P10's near-duplicate training prompts) are both based on the embedding projection, which was not part of the baseline workflow. The comparison therefore conflates the interface design with the addition of embedding-based overview and search capabilities. While Texture provides the interaction scaffolding, the claim that 'TEXTURE enabled participants to discover new insights' cannot be cleanly attributed to the system's interaction design rather than to the new embedding attributes that were precomputed and inserted into the data before the session.
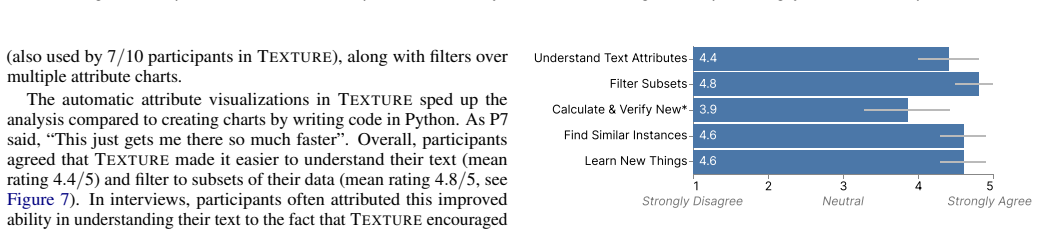
- [Section 6.2 and Figure 7] The 'more quickly iterate' claim is not directly measured. The survey items in Appendix A ask participants whether tasks were 'easier' on a 5-point Likert scale, not whether they were faster; no objective timing data, interaction logs, or behavioral measures are reported. The paper's abstract states that 'TEXTURE enabled participants to more quickly iterate,' but the only quantitative evidence is self-reported comparative ease (Figure 7), and the supporting quotes such as 'This just gets me there so much faster' are anecdotal. Even if the order and attribute confounds were resolved, the current data would not support a quantitative speed claim. The claims should be tempered to self-reported ease and perceived speed, with the absence of objective measures noted in the abstract and conclusion.
minor comments (5)
- [Throughout] There are many missing spaces after the product name (e.g., 'TEXTUREhelps', 'TEXTUREis', 'TEXTUREdata') in the figure captions, abstract, and body text; these should be fixed in proofreading.
- [Section 2.2.3] The heading 'Corpus Overview Methods and Embedddings' contains a typo: 'Embedddings' should be 'Embeddings.'
- [Section 3.4] The substring-highlighting example is confusing because both sentences in the sentence 'This way “we won the wonderful match” is highlighted and not “we won the wonderful match”' are identical. The second example presumably should contain a different word (e.g., 'wonderful') to illustrate that the substring 'won' inside 'wonderful' is not highlighted.
- [Reference [14]] The journal name and volume in the Evans and Aceves reference are typeset with an unusual space ('V olume 42'), which should be corrected.
- [Figure 7] The note for 'Calculate & Verify New*' says the item reflects the seven participants who provided ratings; it would be helpful to state briefly why three participants did not provide ratings so readers can judge the coverage.
Circularity Check
No significant circularity: the central claims are empirical system and usability findings, and the only self-cited dependency (Mosaic) is implemented as prior infrastructure rather than as a definitional input.
full rationale
The paper does not present a mathematical derivation or a fitted prediction; it presents a configurable schema, an implemented tool, and a two-session user study. The central effectiveness claims rest on observed participant behavior, self-reported ratings, and qualitative insights, not on equations whose outputs duplicate their inputs. The one overlapping-author dependency, Mosaic [22], is used as an implementation substrate for coordinated queries and is cited as prior published work; no uniqueness claim or fitted parameter is imported from that citation. The expressiveness claim that all participant attributes fit the TEXTURE schema is partly a consequence of the study procedure, since the research team formatted each dataset into the schema before the Texture session (Section 4.1), but this is a methodological limitation of a case study rather than a circular derivation: the schema was defined before the datasets were encoded, and the study demonstrates the encoding on ten external datasets. Section 6.4 explicitly concedes that repeated exposure to the same dataset could explain additional insights; that is a validity threat to the comparative effectiveness claim, not a circularity in the argument. Mosaic and other prior systems are cited contextually and do not carry the load of the effectiveness conclusion. Overall, no step reduces by construction to its input, and no load-bearing self-citation chain is present.
Assumptions & free parameters
assumptions (3)
- domain assumption First normal form normalization into relational tables enables scalable interactive filtering.
- domain assumption Document embeddings and cosine similarity meaningfully capture document similarity for overview and search.
- ad hoc to paper Self-reported ratings and thematic analysis of 10 participants provide valid evidence for the system's effectiveness.
invented entities (1)
-
Texture five-type attribute schema (text, single-value, list, span list, embedding)
independent evidence
Cite this review
Pith. "Pith review of Texture: Structured Exploration of Text Datasets." pith.science (2026). https://pith.science/paper/YGSLISLP
@misc{pith2026250416898,
  author       = {Pith},
  title        = {Pith review of: Texture: Structured Exploration of Text Datasets},
  year         = {2026},
  howpublished = {\url{https://pith.science/paper/YGSLISLP}},
  note         = {Machine review of arXiv:2504.16898}
}
read the original abstract
Exploratory analysis of a text corpus is essential for assessing data quality and developing meaningful hypotheses. Text analysis relies on understanding documents through structured attributes spanning various granularities of the documents such as words, phrases, sentences, topics, or clusters. However, current text visualization tools typically adopt a fixed representation tailored to specific tasks or domains, requiring users to switch tools as their analytical goals change. To address this limitation, we present Texture, a general-purpose interactive text exploration tool. Texture introduces a configurable data schema for representing text documents enriched with descriptive attributes. These attributes can appear at arbitrary levels of granularity in the text and possibly have multiple values, including document-level attributes, multi-valued attributes (e.g., topics), fine-grained span-level attributes (e.g., words), and vector embeddings. The system then combines existing interactive methods for text exploration into a single interface that provides attribute overview visualizations, supports cross-filtering attribute charts to explore subsets, uses embeddings for a dataset overview and similar instance search, and contextualizes filters in the actual documents. We evaluated Texture through a two-part user study with 10 participants from varied domains who each analyzed their own dataset in a baseline session and then with Texture. Texture was able to represent all of the previously derived dataset attributes, enabled participants to more quickly iterate during their exploratory analysis, and discover new insights about their data. Our findings contribute to the design of scalable, interactive, and flexible exploration systems that improve users' ability to make sense of text data.
Figures


Figures from the paper (4 more)


Reference graph
Works this paper leans on
-
[1]
Alexander, J
E. Alexander, J. Kohlmann, R. Valenza, M. Witmore, and M. Gleicher. Serendip: Topic model-driven visual exploration of text corpora. In2014 IEEE Conference on Visual Analytics Science and Technology (VAST), pp. 173–182. IEEE, 2014. 3, 5
2014
-
[2]
J. Alsakran, Y . Chen, Y . Zhao, J. Yang, and D. Luo. Streamit: Dy- namic visualization and interactive exploration of text streams. In2011 IEEE Pacific Visualization Symposium, pp. 131–138, 2011. doi: 10.1109/ PACIFICVIS.2011.5742382 2
arXiv 2011
-
[3]
H. An, A. Narechania, E. Wall, and K. Xu. vitality 2: Reviewing academic literature using large language models. Presented at the NLVIZ Workshop, IEEE VIS 2024, 2024. 2
2024
-
[4]
D. M. Blei, A. Y . Ng, and M. I. Jordan. Latent dirichlet allocation.Journal of machine Learning research, 3(Jan):993–1022, 2003. 3
2003
-
[5]
Bosch, D
H. Bosch, D. Thom, F. Heimerl, E. Püttmann, S. Koch, R. Krüger, M. Wörner, and T. Ertl. Scatterblogs2: Real-time monitoring of mi- croblog messages through user-guided filtering.IEEE Transactions on Visualization and Computer Graphics, 19(12):2022–2031, 2013. 2
2022
-
[6]
A. A. Cabrera, E. Fu, D. Bertucci, K. Holstein, A. Talwalkar, J. I. Hong, and A. Perer. Zeno: An interactive framework for behavioral evaluation of machine learning. InProceedings of the 2023 CHI Conference on Human Factors in Computing Systems, CHI ’23, article no. 419, 14 pages. Association for Computing Machinery, New York, NY , USA, 2023. doi: 10.1145...
arXiv 2023
-
[7]
E. F. Codd. A relational model of data for large shared data banks.Com- mun. ACM, 13(6):377–387, 11 pages, June 1970. doi: 10.1145/362384. 362685 4
-
[8]
C. Collins, F. B. Viegas, and M. Wattenberg. Parallel tag clouds to explore and analyze faceted text corpora. In2009 IEEE Symposium on Visual Analytics Science and Technology, pp. 91–98, 2009. doi: 10.1109/V AST. 2009.5333443 2
arXiv 2009
Show all 88 references
-
[9]
Correll, M
M. Correll, M. Witmore, and M. Gleicher. Exploring collections of tagged text for literary scholarship.Computer Graphics Forum, 30(3):731–740,
-
[10]
Devlin, M
J. Devlin, M. Chang, K. Lee, and K. Toutanova. BERT: pre-training of deep bidirectional transformers for language understanding. In J. Burstein, C. Doran, and T. Solorio, eds.,Proceedings of the 2019 Conference of the North American Chapter of the Association for Computational...
2019 doi
-
[11]
A. Don, E. Zheleva, M. Gregory, S. Tarkan, L. Auvil, T. Clement, B. Shnei- derman, and C. Plaisant. Discovering interesting usage patterns in text collections: integrating text mining with visualization. InProceedings of the sixteenth ACM conference on Conference on informatio...
2007
-
[12]
Elazar, A
Y . Elazar, A. Bhagia, I. Magnusson, A. Ravichander, D. Schwenk, A. Suhr, P. Walsh, D. Groeneveld, L. Soldaini, S. Singh, et al. What’s in my big data?arXiv preprint arXiv:2310.20707, 2023. 2
2023 arXiv
-
[13]
Epperson, V
W. Epperson, V . Gorantla, D. Moritz, and A. Perer. Dead or alive: Con- tinuous data profiling for interactive data science.IEEE Transactions on Visualization and Computer Graphics, 30(1):197–207, 2024. doi: 10. 1109/TVCG.2023.3327367 2, 4
2024
-
[14]
J. A. Evans and P. Aceves. Machine translation: Mining text for social theory.Annual Review of Sociology, 42(V olume 42, 2016):21–50, 2016. doi: 10.1146/annurev-soc-081715-074206 1
2016 doi
-
[15]
E. Fast, B. Chen, and M. S. Bernstein. Empath: Understanding topic signals in large-scale text. InProceedings of the 2016 CHI conference on human factors in computing systems, pp. 4647–4657, 2016. 2, 3
2016
-
[16]
Felix, S
C. Felix, S. Franconeri, and E. Bertini. Taking word clouds apart: An empirical investigation of the design space for keyword summaries.IEEE Transactions on Visualization and Computer Graphics, 24(1):657–666,
-
[17]
Felix, A
C. Felix, A. V . Pandey, and E. Bertini. Texttile: An interactive visualization tool for seamless exploratory analysis of structured data and unstructured text.IEEE Transactions on Visualization and Computer Graphics, 23:161– 170, 2017. 3
2017
-
[18]
Gentzkow, B
M. Gentzkow, B. Kelly, and M. Taddy. Text as data.Journal of Economic Literature, 57(3):535–574, 2019. 1
2019
-
[19]
Github copilot - your ai pair programmer
Github. Github copilot - your ai pair programmer. https://github. com/features/copilot. Accessed 03-2025. 9
2025
-
[20]
Griggs, C
P. Griggs, C. Demiralp, and S. Rahman. Towards integrated, interactive, and extensible text data analytics with leam. In E. Dragut, Y . Li, L. Popa, and S. Vucetic, eds.,Proceedings of the Second Workshop on Data Science with Human in the Loop: Language Advances, pp. 52–58. As...
2021 doi
-
[21]
Gururaja, N
S. Gururaja, N. Gandhi, J. Milbauer, and E. Strubell. Beyond text: Expert needs in document research.ACL, 2025. 2
2025
-
[22]
Heer and D
J. Heer and D. Moritz. Mosaic: An architecture for scalable & interop- erable data views.IEEE Transactions on Visualization and Computer Graphics, 30(1):436–446, 2024. doi: 10.1109/TVCG.2023.3327189 4, 5, 12
2024
-
[23]
Heimerl, M
F. Heimerl, M. John, Q. Han, S. Koch, and T. Ertl. Docucompass: Effective exploration of document landscapes. In2016 IEEE conference on visual analytics science and technology (VAST), pp. 11–20. IEEE, 2016. 3, 5
2016
-
[24]
E. Horvitz. Principles of mixed-initiative user interfaces. InProceedings of the SIGCHI conference on Human Factors in Computing Systems, pp. 159–166, 1999. 9
1999
-
[25]
Huggingface datasets
Huggingface. Huggingface datasets. https://huggingface.co/ datasets, 2024. Accessed 03-2025. 6
2024
-
[26]
Ittoo, A
A. Ittoo, A. van den Bosch, et al. Text analytics in industry: Challenges, desiderata and trends.Computers in Industry, 78:96–107, 2016. 2
2016
-
[27]
Kahng, I
M. Kahng, I. Tenney, M. Pushkarna, M. X. Liu, J. Wexler, E. Reif, K. Kallarackal, M. Chang, M. Terry, and L. Dixon. Llm comparator: Interactive analysis of side-by-side evaluation of large language models. IEEE Transactions on Visualization and Computer Graphics, 2024. 1, 2, 3, 4
2024
-
[28]
Kandel, R
S. Kandel, R. Parikh, A. Paepcke, J. M. Hellerstein, and J. Heer. Profiler: Integrated statistical analysis and visualization for data quality assessment. InProceedings of the International Working Conference on Advanced Vi- sual Interfaces, A VI ’12, 8 pages, p. 547–554. Asso...
2012
-
[29]
M. B. Kery, D. Ren, F. Hohman, D. Moritz, K. Wongsuphasawat, and K. Patel. Mage: Fluid moves between code and graphical work in compu- tational notebooks. InProceedings of the 33rd Annual ACM Symposium on User Interface Software and Technology, UIST ’20, 12 pages, p. 140–151. ...
2020
-
[30]
M. S. Lam, J. Teoh, J. A. Landay, J. Heer, and M. S. Bernstein. Concept induction: Analyzing unstructured text with high-level concepts using lloom. InProceedings of the CHI Conference on Human Factors in Computing Systems, CHI ’24, article no. 766, 28 pages. Association for C...
2024 doi
-
[31]
Lance db
Lance DB. Lance db. https://lancedb.com/, 2024. Accessed 03-2025. 5
2024
-
[32]
D. Lange. Vispubs: A visualization publications repository, 2024. doi: 10. 31219/osf.io/dg3p2 4
2024
-
[33]
B. Lee, M. Czerwinski, G. Robertson, and B. B. Bederson. Understanding research trends in conferences using paperlens. InCHI’05 extended abstracts on Human factors in computing systems, pp. 1969–1972, 2005. 3
1969
-
[34]
S. Liu, X. Wang, C. Collins, W. Dou, F. Ouyang, M. El-Assady, L. Jiang, and D. A. Keim. Bridging text visualization and mining: A task-driven survey.IEEE transactions on visualization and computer graphics, 25(7):2482–2504, 2018. 2
2018
-
[35]
S. Liu, M. X. Zhou, S. Pan, Y . Song, W. Qian, W. Cai, and X. Lian. Tiara: Interactive, topic-based visual text summarization and analysis.ACM Transactions on Intelligent Systems and Technology (TIST), 3(2):1–28,
-
[36]
S. Loria. textblob documentation.Release 0.15, 2, 2018. 7
2018
-
[37]
McInnes, J
L. McInnes, J. Healy, N. Saul, and L. Grossberger. Umap: Uniform manifold approximation and projection.The Journal of Open Source Software, 3(29):861, 2018. 3, 4
2018
-
[38]
Muralidharan and M
A. Muralidharan and M. A. Hearst. Supporting exploratory text analysis in literature study.Literary and linguistic computing, 28(2):283–295, 2012. 2
2012
-
[39]
Narechania, A
A. Narechania, A. Karduni, R. Wesslen, and E. Wall. Vitality: Promoting serendipitous discovery of academic literature with transformers & visual analytics.IEEE Transactions on Visualization and Computer Graphics, 28(1):486–496, 2022. doi: 10.1109/TVCG.2021.3114820 2, 3, 4
2022
-
[40]
Nomic atlas
Nomic AI. Nomic atlas. https://github.com/nomic-ai/nomic,
-
[41]
Oelke, D
D. Oelke, D. Spretke, A. Stoffel, and D. A. Keim. Visual readability analysis: How to make your writings easier to read.IEEE Transactions on Visualization and Computer Graphics, 18(5):662–674, 2011. 2
2011
-
[42]
Openai vector embeddings, 2025
OpenAI. Openai vector embeddings, 2025. Accessed 03-25. 6
2025
-
[43]
Pandas: Python data analysis library
Pandas. Pandas: Python data analysis library. https://pandas.pydata. org, 2024. Accessed 03-2025. 4
2024
-
[44]
Pennington, R
J. Pennington, R. Socher, and C. D. Manning. Glove: Global vectors for word representation. InEmpirical Methods in Natural Language Processing (EMNLP), pp. 1532–1543, 2014. 3
2014
-
[45]
E. Reif, M. Kahng, and S. Petridis. Visualizing linguistic diversity of text datasets synthesized by large language models. In2023 IEEE Visualization and Visual Analytics (VIS), Melbourne, Australia, October 21-27, 2023, pp. 236–240. IEEE, New York, NY , USA, 2023. doi: 10.110...
2023
-
[46]
E. Reif, C. Qian, J. Wexler, and M. Kahng. Automatic histograms: Lever- aging language models for text dataset exploration. In F. F. Mueller, P. Kyburz, J. R. Williamson, and C. Sas, eds.,Extended Abstracts of the CHI Conference on Human Factors in Computing Systems, CHI EA 20...
2024
-
[47]
Reimers and I
N. Reimers and I. Gurevych. Sentence-bert: Sentence embeddings us- ing siamese bert-networks. In K. Inui, J. Jiang, V . Ng, and X. Wan, eds., Proceedings of the 2019 Conference on Empirical Methods in Natural Lan- guage Processing and the 9th International Joint Conference on ...
2019 doi
-
[48]
Robertson, Z
S. Robertson, Z. J. Wang, D. Moritz, M. B. Kery, and F. Hohman. Angler: Helping machine translation practitioners prioritize model improvements. InProceedings of the 2023 CHI Conference on Human Factors in Comput- ing Systems, CHI ’23, article no. 832, 20 pages. Association fo...
2023
-
[49]
everyone wants to do the model work, not the data work
N. Sambasivan, S. Kapania, H. Highfill, D. Akrong, P. Paritosh, and L. M. Aroyo. “everyone wants to do the model work, not the data work”: Data cascades in high-stakes ai. InProceedings of the 2021 CHI Conference on Human Factors in Computing Systems, CHI ’21, article no. 39, ...
2021
-
[50]
Sievert and K
C. Sievert and K. Shirley. Ldavis: A method for visualizing and inter- preting topics. InProceedings of the workshop on interactive language learning, visualization, and interfaces, pp. 63–70, 2014. 2
2014
-
[51]
G. Staff. Octoverse: Ai leads python to top language as the number of global developers surges, 2024. Published 10-29-24. 5
2024
-
[52]
Stasko, C
J. Stasko, C. Gorg, Z. Liu, and K. Singhal. Jigsaw: supporting investigative analysis through interactive visualization. In2007 IEEE Symposium on Visual Analytics Science and Technology, pp. 131–138. IEEE, 2007. 3
2007
-
[53]
Strobelt, D
H. Strobelt, D. Oelke, B. C. Kwon, T. Schreck, and H. Pfister. Guidelines for effective usage of text highlighting techniques.IEEE transactions on visualization and computer graphics, 22(1):489–498, 2015. 2
2015
-
[54]
Swayamdipta, R
S. Swayamdipta, R. Schwartz, N. Lourie, Y . Wang, H. Hajishirzi, N. A. Smith, and Y . Choi. Dataset cartography: Mapping and diagnosing datasets with training dynamics. InProceedings of the 2020 Conference on Empir- ical Methods in Natural Language Processing (EMNLP), pp. 9275...
2020
-
[55]
J. W. Tukey.Exploratory data analysis / John W. Tukey.Addison-Wesley series in behavioral science. Addison-Wesley Pub. Co., Reading, Mass,
-
[56]
J. W. Tukey. We need both exploratory and confirmatory.The American Statistician, 34:23–25, 1980. doi: 10.2307/2682991 2, 9
1980 doi
-
[57]
F. B. Viégas and M. Wattenberg. Timelines tag clouds and the case for vernacular visualization.interactions, 15(4):49–52, 2008. 2
2008
-
[58]
Z. J. Wang, F. Hohman, and D. H. Chau. WizMap: Scalable Interactive Visualization for Exploring Large Machine Learning Embeddings.arXiv 2306.09328, 2023. 3, 5
2023 arXiv
-
[59]
Wanner, A
F. Wanner, A. Stoffel, D. Jäckle, B. C. Kwon, A. Weiler, D. A. Keim, K. E. Isaacs, A. Giménez, I. Jusufi, T. Gamblin, et al. State-of-the-art report of visual analysis for event detection in text data streams. InEuroVis (STARs),
-
[60]
Wongsuphasawat, Y
K. Wongsuphasawat, Y . Liu, and J. Heer. Goals, process, and challenges of exploratory data analysis: An interview study, 2019. 2
2019
-
[61]
Wongsuphasawat, D
K. Wongsuphasawat, D. Moritz, A. Anand, J. Mackinlay, B. Howe, and J. Heer. V oyager: Exploratory analysis via faceted browsing of visual- ization recommendations.IEEE Trans. Visualization & Comp. Graphics (Proc. InfoVis), 2016. doi: 10.1109/TVCG.2015.2467191 2
2016
-
[62]
T. Wu, K. Wongsuphasawat, D. Ren, K. Patel, and C. DuBois. Tempura: Query analysis with structural templates. InProceedings of the 2020 CHI Conference on Human Factors in Computing Systems, pp. 1–12, 2020. 3
2020
-
[63]
Ziegler, E
A. Ziegler, E. Kalliamvakou, X. A. Li, A. Rice, D. Rifkin, S. Simister, G. Sittampalam, and E. Aftandilian. Productivity assessment of neural code completion. InProceedings of the 6th ACM SIGPLAN International Symposium on Machine Programming, MAPS 2022, 9 pages, p. 21–29. Ass...
2022
-
[66]
How would your rate your experience with Python?
-
[67]
How many years have you been using Python?
-
[68]
How often do you work with text data?
-
[69]
When was the last time you worked with this dataset in particular?
-
[70]
What are the analysis questions you were trying to answer with this data? A.2 Session 1: baseline exploration questions Discussion questions:
-
[71]
How did you understand what is in the dataset? Can you show us which code or visualizations you used?
-
[72]
Were all these attributes already present in the data? If not, how did you derive them?
-
[73]
How did you verify or explore the results after adding a new attribute?
-
[74]
What kind of filtering or subset analysis did you do of this dataset?
-
[75]
Do you look at similar instances or use embeddings as part of your exploration / how?
-
[76]
What was the hardest part about this task and working with this text data for you?
-
[77]
If you had a tool to help you understand the text data, what do you wish it could do? A.3 Session 2: TEXTUREusage questions We asked the following Likert-scale questions in a survey immediately after the task:
-
[78]
I found it easier to understand the text attributes in my dataset with Texture than the last session (5 point Likert scale)
-
[79]
I found it easier to filter to subsets of my dataset with Texture than the last session (5 point Likert scale)
-
[80]
I found it easier to calculate a new attribute and verify its correct- ness with Texture than the last session (5 point Likert scale)
-
[81]
I found it easier to find similar instances in my dataset with Texture than the last session (5 point Likert scale)
-
[82]
I learned new things about my dataset while exploring it with Texture (5 point Likert scale) Discussion questions:
-
[83]
Talk me through your rating on how TEXTUREimpacted your understanding of your text attributes
-
[84]
Talk me through your rating on how TEXTUREimpacted your ability to filter to subsets
-
[85]
Talk me through your rating on how TEXTUREimpacted your ability to add a new attribute and verify
-
[86]
Talk me through your rating on how TEXTUREimpacted your ability to make sense of similar instances
-
[87]
Talk me through your rating on how you learned new things about your dataset with TEXTURE
-
[88]
Therefore we must be able to filter across joined tables to enable interactive cross-filtering
What other features would better support your workflow? B TECHNICALDETAILS: FILTERSACROSSMULTIPLETABLES In TEXTURE, attributes may come from different tables. Therefore we must be able to filter across joined tables to enable interactive cross-filtering. In Mosaic, filters are...
-
[2011]
doi: 10.1111/j.1467-8659.2011.01922.x 2
2011
-
[2018]
doi: 10.1109/TVCG.2017.2746018 2
2017
Reviewed August 16, 2026 · model on record in the stance chip above.
Discussion (0). Continue with ORCID to comment.