REVIEW 5 major objections 5 minor 84 references
Total Power and Low-energy Cut-off Time Evolution of Solar Flare Accelerated Electrons Using X-Ray Observations and Warm-Target Model
T0 review · 5 major / 5 minor · reviewed 2026-08-07 · deepseek-v4-flash
Pith's one-line read During solar flare hard X-ray bursts, the low-energy cut-off of accelerated electrons dips while the injection rate peaks.
desk verdict A useful multi-flare application of the warm-target model, but the headline high-low-high Ec pattern rests on a sharp-cutoff assumption and interpolated peak values, so treat it as suggestive rather than settled. read the letter →
The pith
A machine-rendered reading of the paper's core claim, the machinery that carries it, and where it could break.
The reading
What carries the argument
The carrying object is the warm-target model of Kontar et al. (2015, 2019), implemented as the `f_thick-warm` spectral function in OSPEX. Equation (1) gives the density-averaged mean electron flux as the sum of a thermalized Maxwellian component and a cold-target contribution, so electrons with energies of a few $k_B T$ are treated as thermalizing inside the warm coronal plasma instead of being lost instantly. The injected spectrum is assumed to be a power law with a sharp low-energy cut-off $E_c$ (Eq. 3), and imaging supplies the loop half-length $L$, source volume $V$, temperature $T$, and density $n$; the model then returns $E_c$, $\dot{N}_0$, $\delta$, power $P$, and the excess emission measure $\Delta\mathrm{EM}$. This machinery matters because the cold-target model leaves $E_c$ essentially undetermined, whereas the warm-target approach constrains it, allowing the energetics to be computed.
What would settle it
Fit the same three flares' hard X-ray spectra with an injected spectrum that has a smooth low-energy turnover rather than a sharp cutoff (for example a kappa distribution or a broken power law) and check whether $E_c$ still shows a high-low-high pattern around the hard X-ray peaks; if the inferred cutoff becomes flat or the pattern inverts, the reported behavior is an artifact of the sharp-cutoff assumption.
Extended reading notes
Core claim
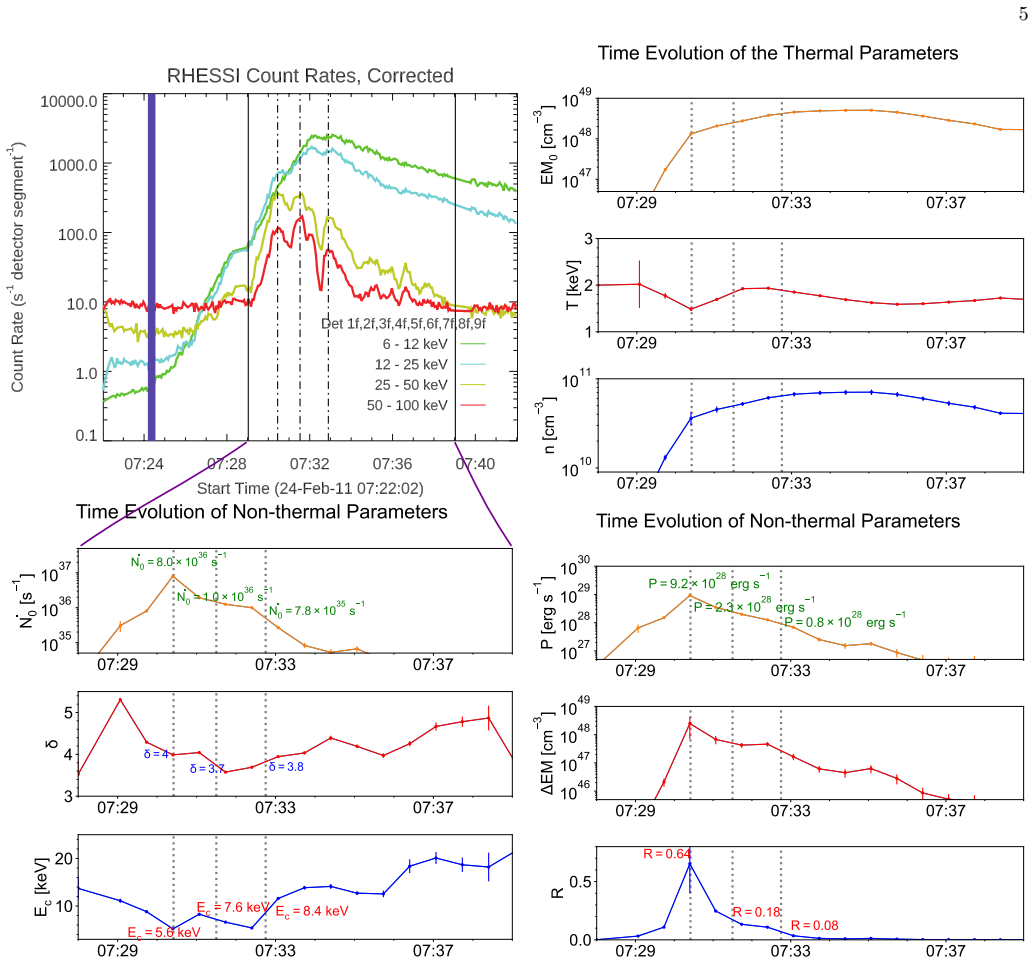
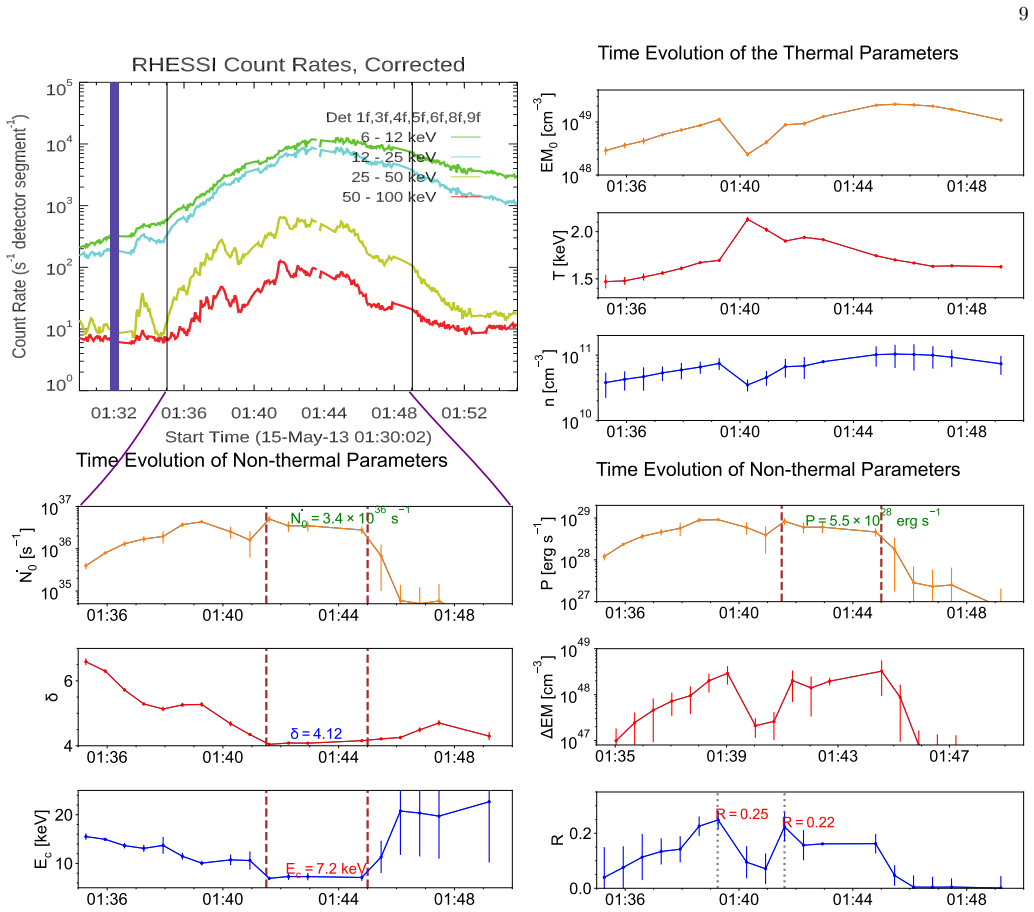
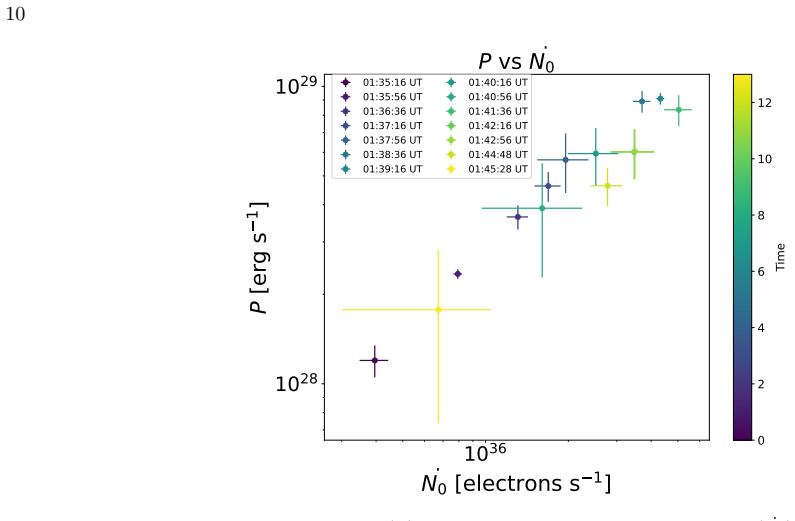
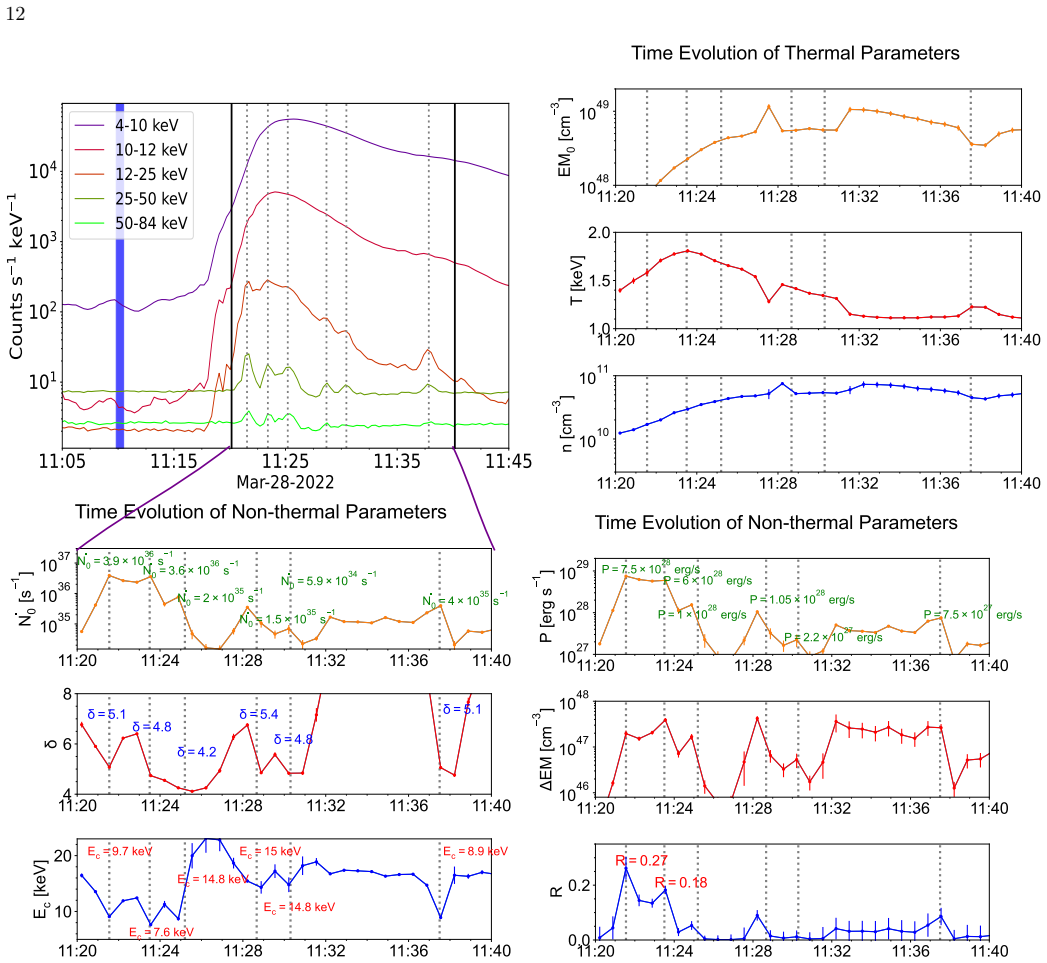
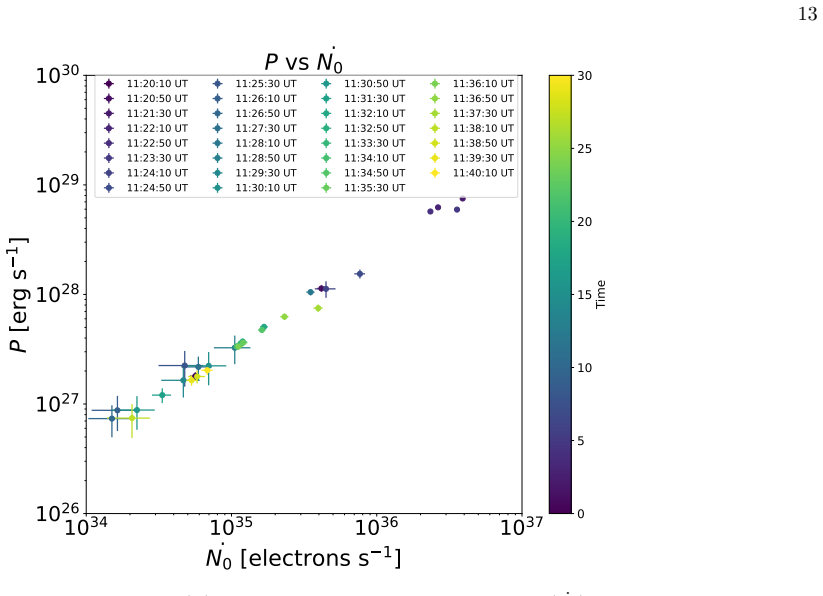
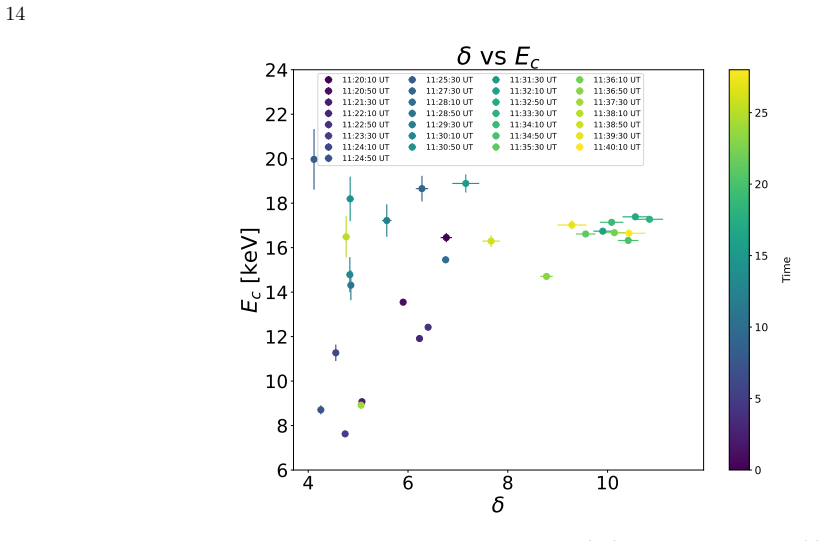
Working with the warm-target model, the paper's central result is empirical: in all three flares, the low-energy cut-off $E_c$ of the assumed power-law injected electron spectrum shows a high-low-high temporal pattern around each hard X-ray burst, the spectral index $\delta$ shows the familiar soft-hard-soft variation, and $\dot{N}_0$ shows the opposite low-high-low pattern. The total nonthermal power $P$ is proportional to $\dot{N}_0 E_c (\delta-1)/(\delta-2)$, but the observed time variation of $P$ is dominated by $\dot{N}_0$: on a log-log plot $P$ tracks $\dot{N}_0$ linearly. The excess emission measure $\Delta\mathrm{EM}$ from thermalized injected electrons, and its ratio $R$ to the total emission measure, reach their largest values near the first hard X-ray peak and then decay as the flare progresses.
Load-bearing premise
The analysis assumes the injected electron spectrum is a single power law with a sharp low-energy cutoff and that the plasma temperature and thermal emission measure measured in the 40 seconds before each burst stay unchanged during the burst itself.
Editorial extensions
If this is right
- The temporal variation of nonthermal power in a flare can be read directly from the acceleration rate, not from the low-energy cut-off.
- Hard X-ray peaks correspond to periods of enhanced acceleration efficiency: electrons are injected at lower energies and at higher rates, with harder spectra.
- The excess thermal emission measure from thermalized injected electrons is significant in the impulsive phase, so soft X-ray emission measure there is not purely chromospheric evaporation.
- Warm-target determinations of $E_c$ allow flare energetics to be estimated with far better accuracy than cold-target fits, which leave $E_c$ effectively unconstrained.
- The reported high-low-high pattern in $E_c$ resembles the energy dependence seen in stochastic acceleration simulations, linking the observations to acceleration models.
Reading between the lines
- If the pattern holds across a larger sample, the low-energy cut-off could serve as a direct observable proxy for acceleration efficiency, allowing time-resolved studies of the acceleration process without full spectral modeling.
- The 40-second binning likely smooths the true cut-off variations; higher-cadence instruments like STIX could reveal sharper dips or lag times between $\dot{N}_0$ maxima and $E_c$ minima.
- A testable extension is to compare the warm-target $\Delta\mathrm{EM}$ against soft X-ray observations of the same loops to see whether the predicted thermalization signature appears as an impulsive-phase emission measure enhancement.
- The correlation between $\delta$ and $E_c$ suggests a single accelerator parameter controls both; modeling the acceleration region could predict a quantitative $\delta$-$E_c$ relation.
Editorial analysis
A structured set of objections, weighed in public.
Referee Report
Summary. The paper applies the warm-target electron transport model (Kontar et al. 2015, 2019) to hard X-ray observations of three solar flares (two with RHESSI, one with STIX/Solar Orbiter) and extracts time-resolved values of the injected electron rate Ndot0, spectral index delta, low-energy cut-off Ec, total nonthermal power P, excess thermal emission measure Delta-EM, and the ratio R = Delta-EM/(EM0+Delta-EM). The central empirical claims are that Ec shows a high-low-high pattern around hard X-ray peaks, that Ndot0 shows the opposite low-high-low pattern, and that the time evolution of P follows the time evolution of Ndot0 rather than the variations of Ec. The paper also reports that the thermalized-electron contribution to the total emission measure peaks near the first hard X-ray peak. The analysis uses 40 s spectral bins, with thermal parameters fixed from the preceding 40 s pre-burst interval, and assumes constant loop half-length L and source volume V for each event.
Significance. If the results hold, the paper provides one of the first systematic time-resolved determinations of the low-energy cut-off in flare-accelerated electron distributions, using a model that can in principle constrain Ec rather than treating it as an unknown. The combination of RHESSI and STIX events, the explicit reporting of uncertainties for most fitted points, and the comparison with stochastic-acceleration simulations are useful contributions. However, several load-bearing aspects need to be strengthened before the central temporal claims can be considered secure: the peak values of Ec that shape the high-low-high pattern are partly obtained by linear interpolation without error bars, the constant-L/V assumption is untested, and the reported correlations and P-Ndot0 relation require more careful statistical treatment. The paper would be a solid observational contribution after these points are addressed.
major comments (5)
- [§3.1, §3.3, Figures 2 and 10] Several values at the hard X-ray peaks that support the central high-low-high Ec trend are linearly interpolated and presented without error bars. For the 2011 February 24 flare, the text states explicitly that no data points exist at the second and third HXR peaks and that the quoted Ndot0 and Ec values there are linearly interpolated; the same appears to be true for the third and fourth peaks of the 2022 March 28 flare (Ec = 14.8 and 15.1 keV without uncertainties). Because the temporal shape of Ec is the main claim of the paper, interpolated points cannot serve as evidence for that shape. The authors should either perform fits in intervals centered on the peak times, propagate the interpolation uncertainty, or explicitly base the qualitative trend only on directly fitted points.
- [§3.1-§3.3, Equations (1), (6)] The assumption that the half-loop length L and source volume V are constant in time is stated but never examined, even though the warm-target model depends on L through E_min and on V through n = sqrt(EM0/V). If the coronal source grows or the loop geometry changes during the flare, the inferred thermal density and the thermalization efficiency change, which can systematically shift Ec and Ndot0. A sensitivity test using image-derived L and V at several times, or a plausible range of V(t)/L(t), is needed to establish that the reported temporal patterns are not artifacts of this assumption.
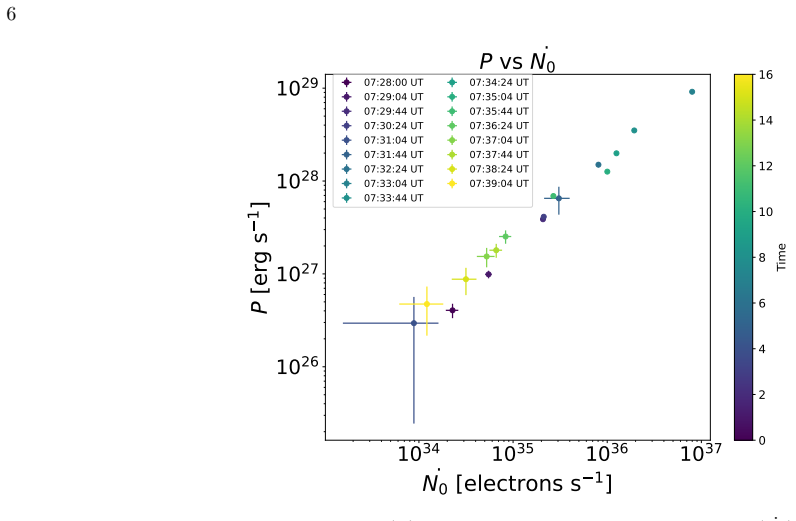
- [Equation (5), Figures 3, 7, 11] The claimed linear relationship between P and Ndot0 on logarithmic scales is largely a structural consequence of Equation (5), P = ((delta-1)/(delta-2)) Ndot0 Ec, because P is computed from Ndot0 and the fitted delta and Ec. The paper does not quantify how much of the variance in P is driven by Ndot0 versus Ec and delta, so the conclusion that 'the temporal variation of the flare power follows the temporal variation of the acceleration rate' is not an independent empirical test. A variance decomposition or a comparison of the observed P/Ndot0 ratio with the fitted (delta-1)/(delta-2)*Ec factor would make the claim meaningful.
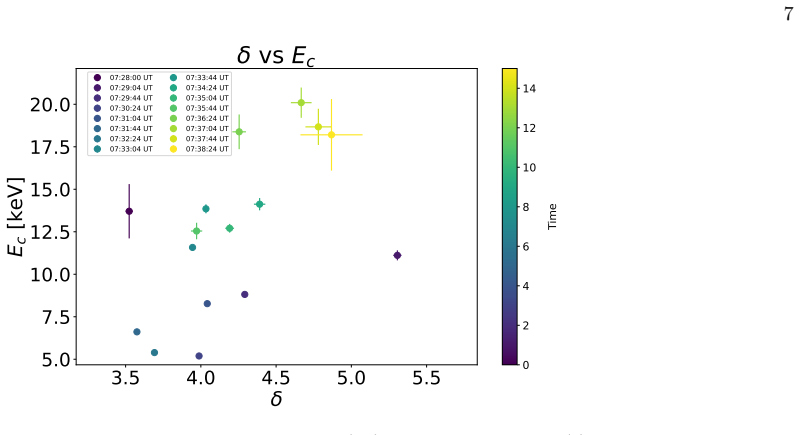
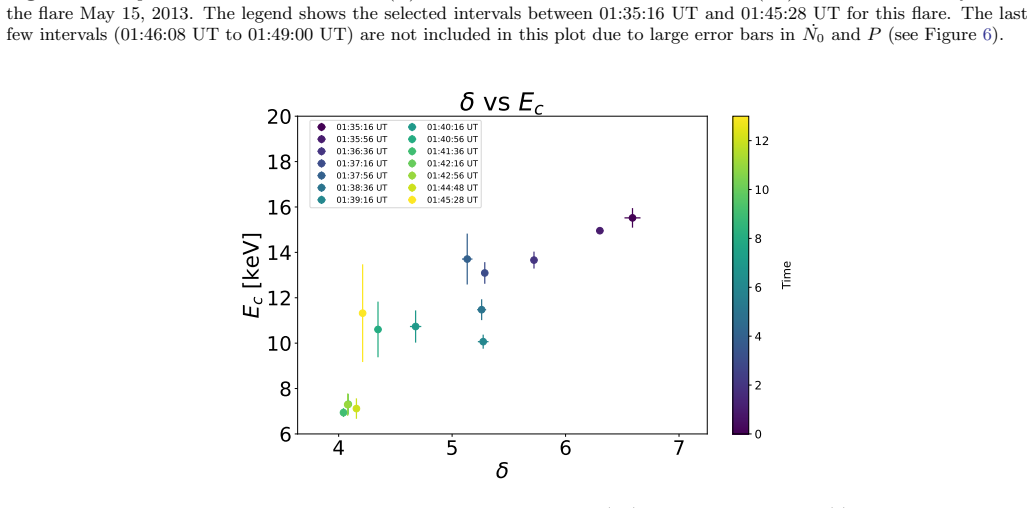
- [§3.1-§3.3, Figures 4, 8, 12] The Pearson correlation coefficients between Ec and delta (r about 0.39-0.53) are reported with p-values based on the number of time bins, but the 40 s time series are strongly autocorrelated, so the effective number of independent samples is far smaller than the nominal bin count. The p-values therefore overstate the statistical significance of the correlations. The authors should account for autocorrelation, for example by estimating the effective sample size, prewhitening, or using a block bootstrap, before claiming 95% confidence in the correlation.
- [Equation (3), §4] The physical interpretation that Ec(t) is the low-energy cutoff of the accelerated electron distribution rests on the assumed sharp power-law cutoff in Equation (3). If the true injection spectrum has a smooth low-energy rollover, as expected in several acceleration models, the fitted Ec may simply track local spectral curvature and become partially degenerate with delta. The reported r values around 0.4-0.5 are consistent with such a degeneracy. A forward-model test using a smooth-rollover injection spectrum (for example, a broken power law or a kappa-like distribution) would show whether the high-low-high Ec pattern is robust, and should be included or the interpretation should be explicitly softened.
minor comments (5)
- [Abstract] The sentence beginning 'While hard X-Ray observation...' is grammatically incomplete and should be revised.
- [Figure 2 caption] The units of excess thermal emission measure are printed as 'cm^-1' in the Figure 2 caption; this should almost certainly be 'cm^-3' as in the corresponding caption of Figure 6.
- [Figure 8 caption] The caption refers to the 'flare May 15, 2015'; this should be 2013.
- [§4] The phrase 'intriguingly resembling a the spectrum of acceleration electrons' contains a typo ('a the') and should be corrected.
- [§3.1, §3.2] The text says the second and third HXR peak values 'are estimated using the linear interpolation method' but does not state whether the quoted uncertainties for the first peak include systematic contributions from the fixed thermal parameters; a brief statement of how systematic uncertainties from EM0 and T were propagated would be helpful.
Circularity Check
The Ec(t) high-low-high trend is an empirical fitting result, but the companion claim that P follows Ndot0 is a direct algebraic consequence of Eq. (5), making that part of the abstract self-definitional.
-
self definitional
[Sec. 2, Eq. (5); Sec. 3.1, P vs Ndot0; Abstract]
"P= Z ∞ Ec E ˙N(E)dE= δ−1 δ−2 ˙N0Ec. ... The powerPshows a linear relationship with the time profile of ˙N0 on the log-log scale. ... Although the total power of nonthermal electrons is sensitive to the cut-off energy, the temporal variation of the flare power follows the temporal variation of the acceleration rate."
P is not an independent observable; it is evaluated from the same best-fit parameters (Ndot0, δ, Ec) using Eq. (5). Since Eq. (5) is the definition of P for the assumed sharp-cutoff power law, log P = log Ndot0 + log[(δ−1)/(δ−2)] + log Ec; hence the reported log-log linear relationship with slope 1 and the temporal tracking are algebraic identities. The only non-tautological content is that the time-dependent coefficient varies more slowly than Ndot0, but the paper does not test this separately from the fit. The abstract's statement that 'the temporal variation of the flare power follows the temporal variation of the acceleration rate' is therefore a restatement of the model's definition rather than an independent empirical discovery.
full rationale
The paper's main novel claim is the high-low-high time dependence of the fitted low-energy cutoff Ec and the opposite low-high-low behavior of Ndot0. This is an empirical pattern in the best-fit parameters of the assumed sharp-cutoff power-law injection model (Eq. 3); it is not forced by the model because the parameters are free and the pattern could have been otherwise. The warm-target model (Kontar et al. 2015, 2019) is prior work by the authors, but it is implemented in OSPEX, externally used, and not invoked as a uniqueness theorem; the cited '7% uncertainty' is a simulation-based result, so those self-citations are not load-bearing in a circular sense. The one genuinely definitional element is the reported linear relation between P and Ndot0: P is computed from the same fitted Ndot0, δ, Ec via Eq. (5), so log P = log Ndot0 + log c(t) is an identity rather than an independent observed relation. This reduces part of the abstract's conclusion to a restatement of the model's definitions, but the central Ec(t) trend remains an independent empirical result. Hence partial circularity, score 4.
Assumptions & free parameters
free parameters (8)
- low-energy cutoff Ec =
5.6-15.1 keV across flares
- spectral index delta =
approximately 3.5-5.5
- total injected electron rate Ndot0 =
10^34 to 10^37 s^-1
- thermal emission measure EM0 =
of order 10^48 cm^-3
- plasma temperature T =
keV range
- plasma density n =
derived from EM0/V
- half-loop length L =
13.9-18.6 Mm
- source volume V =
0.9-3.1 x 10^27 cm^3
assumptions (5)
- domain assumption Warm-target model formula (Eq. 1) for the mean electron flux spectrum, including the thermalization term and the integral term.
- domain assumption The injected electron spectrum is a single power law with a sharp low-energy cutoff (Eq. 3).
- domain assumption Thermal parameters EM0 and T measured in the 40 s pre-burst interval are constant during the following 40 s burst interval.
- domain assumption L and V are constant during the flare.
- domain assumption Elemental abundances are coronal (default OSPEX value).
Cite this review
Pith. "Pith review of Total Power and Low-energy Cut-off Time Evolution of Solar Flare Accelerated Electrons Using X-Ray Observations and Warm-Target Model." pith.science (2026). https://pith.science/paper/YHYOF3SR
@misc{pith2026250608310,
  author       = {Pith},
  title        = {Pith review of: Total Power and Low-energy Cut-off Time Evolution of Solar Flare Accelerated Electrons Using X-Ray Observations and Warm-Target Model},
  year         = {2026},
  howpublished = {\url{https://pith.science/paper/YHYOF3SR}},
  note         = {Machine review of arXiv:2506.08310}
}
read the original abstract
A primary characteristic of solar flares is the efficient acceleration of electrons to nonthermal deka-keV energies. While hard X-Ray (HXR) observation of bremsstrahlung emission serves as the key diagnostic of these electrons. In this study, we investigate the time evolution of flare-accelerated electrons using the warm-target model. This model, unlike the commonly used cold-target model, can determine the low-energy cut-off in the nonthermal electron distribution, so that the energetics of nonthermal electrons can be deduced more accurately. Here, we examine the time-evolution of nonthermal electrons in flares well-observed by the RHESSI and the Solar Orbiter (SolO, using the STIX instrument) spacecrafts. Using spectroscopic and imaging HXR observations, the time evolution of the low-energy cut-off of the accelerated electron distribution, the total power of nonthermal electrons, total rate of nonthermal electrons, and excess thermal emission measure from the nonthermal electrons, are investigated. We find that the time profile of the low-energy cut-off of the accelerated electron distribution shows a high-low-high trend around the HXR bursts of flares, while the time evolution of the total rate of injected electrons shows a low-high-low behavior. Although the total power of nonthermal electrons is sensitive to the cut-off energy, the temporal variation of the flare power follows the temporal variation of the acceleration rate. We further find that the highest contribution of the excess thermal emission measure coming from thermalization of injected electrons takes place around the hard X-ray peak.
Figures

Figures from the paper (9 more)


Reference graph
Works this paper leans on
-
[1]
, " * write output.state after.block = add.period write newline
ENTRY address archivePrefix author booktitle chapter doi edition editor eprint howpublished institution journal key month number organization pages publisher school series title misctitle type volume year version url label extra.label sort.label short.list INTEGERS output.state before.all mid.sentence after.sentence after.block FUNCTION init.state.consts ...
-
[2]
write newline
" write newline "" before.all 'output.state := FUNCTION format.url url empty "" new.block "" url * "" * if FUNCTION format.eprint eprint empty "" archivePrefix empty "" archivePrefix "arXiv" = new.block " " eprint * " " * new.block " " eprint * " " * if if if FUNCTION format.doi doi empty "" " " doi * " " * if FUNCTION format.pid doi empty eprint empty ur...
-
[3]
Lx H. n O N .w u G 7'IHc6ztݑ7jb ; / `s5` H UB8DwB !>0 )>^B jQL瑆& Aq3 #q n b 2jm`
thebibliography [1] 20pt to REFERENCES 6pt =0pt -12pt 10pt plus 3pt =0pt =0pt =1pt plus 1pt =0pt =0pt -12pt =13pt plus 1pt =20pt =13pt plus 1pt \@M =10000 =-1.0em =0pt =0pt 0pt =0pt =1.0em @enumiv\@empty 10000 10000 `\.\@m \@noitemerr \@latex@warning Empty `thebibliography' environment \@ifnextchar \@reference \@latexerr Missing key on reference command E...
2021
-
[4]
Alaoui , M., Holman , G. D., & Swisdak , M. 2024, , 974, 177, 10.3847/1538-4357/ad71cb
-
[5]
2019, , 294, 105, 10.1007/s11207-019-1495-6
Alaoui , M., Krucker , S., & Saint-Hilaire , P. 2019, , 294, 105, 10.1007/s11207-019-1495-6
-
[6]
Antonucci , E., Gabriel , A. H., Acton , L. W., et al. 1982, , 78, 107, 10.1007/BF00151147
-
[7]
Arnold , H., Drake , J. F., Swisdak , M., et al. 2021, , 126, 135101, 10.1103/PhysRevLett.126.135101
-
[8]
Arnoldy , R. L., Kane , S. R., & Winckler , J. R. 1967, , 2, 171, 10.1007/BF00155917
Show all 84 references
-
[9]
J., Brown , J
Aschwanden , M. J., Brown , J. C., & Kontar , E. P. 2002, , 210, 383, 10.1023/A:1022472319619
2002 doi
-
[10]
J., Kontar , E
Aschwanden , M. J., Kontar , E. P., & Jeffrey , N. L. S. 2019, , 881, 1, 10.3847/1538-4357/ab2cd4
2019 doi
-
[11]
J., Caspi , A., Cohen , C
Aschwanden , M. J., Caspi , A., Cohen , C. M. S., et al. 2017, , 836, 17, 10.3847/1538-4357/836/1/17
2017 doi
-
[12]
Ashfield , W., Polito , V., Yu , S., Collier , H., & Hayes , L. A. 2024, , 973, 96, 10.3847/1538-4357/ad64ca
2024 doi
- [13]
-
[14]
Battaglia , M., & Kontar , E. P. 2011, , 533, L2, 10.1051/0004-6361/201117605
2011 doi
-
[15]
Benz , A. O. 1977, , 211, 270, 10.1086/154928
1977 doi
-
[16]
2017, Living Reviews in Solar Physics, 14, 2, 10.1007/s41116-016-0004-3
---. 2017, Living Reviews in Solar Physics, 14, 2, 10.1007/s41116-016-0004-3
2017 doi
-
[17]
H., Kontar , E
Bian , N. H., Kontar , E. P., & Emslie , A. G. 2016, , 824, 78, 10.3847/0004-637X/824/2/78
2016 doi
-
[18]
Brown , J. C. 1971, , 18, 489, 10.1007/BF00149070
1971 doi
-
[19]
C., Aschwanden , M
Brown , J. C., Aschwanden , M. J., & Kontar , E. P. 2002, , 210, 373, 10.1023/A:1022469402781
2002 doi
-
[20]
Dennis , B. R. 1985, , 100, 465, 10.1007/BF00158441
1985 doi
- [21]
-
[22]
Dickson , E. C. M., & Kontar , E. P. 2013, , 284, 405, 10.1007/s11207-012-0178-3
2013 doi
-
[23]
Emslie , A. G. 1978, , 224, 241, 10.1086/156371
1978 doi
-
[24]
G., Allred , J
Emslie , A. G., Allred , J. C., & Alaoui , M. 2024, , 977, 246, 10.3847/1538-4357/ad919c
2024 doi
-
[25]
G., Kontar , E
Emslie , A. G., Kontar , E. P., Krucker , S., & Lin , R. P. 2003, , 595, L107, 10.1086/378931
2003 doi
-
[26]
G., Dennis , B
Emslie , A. G., Dennis , B. R., Shih , A. Y., et al. 2012, , 759, 71, 10.1088/0004-637X/759/1/71
2012 doi
-
[27]
R., Hudson , H
Fletcher , L., Dennis , B. R., Hudson , H. S., et al. 2011, , 159, 19, 10.1007/s11214-010-9701-8
2011 doi
-
[28]
1998, Solar Physics, 182, 497
Freeland, S., & Handy, B. 1998, Solar Physics, 182, 497
1998
-
[29]
Gordovskyy , M., & Browning , P. K. 2011, , 729, 101, 10.1088/0004-637X/729/2/101
2011 doi
-
[30]
K., Kusano , K., Inoue , S., & Vekstein , G
Gordovskyy , M., Browning , P. K., Kusano , K., Inoue , S., & Vekstein , G. E. 2023, , 952, 75, 10.3847/1538-4357/acdb4d
2023 doi
-
[31]
C., & Benz , A
Grigis , P. C., & Benz , A. O. 2004, , 426, 1093, 10.1051/0004-6361:20041367
2004 doi
-
[32]
G., Kontar , E
Hannah , I. G., Kontar , E. P., & Reid , H. A. S. 2013, , 550, A51, 10.1051/0004-6361/201220462
2013 doi
-
[33]
G., Kontar , E
Hannah , I. G., Kontar , E. P., & Sirenko , O. K. 2009, , 707, L45, 10.1088/0004-637X/707/1/L45
2009 doi
-
[34]
D., Sui , L., Schwartz , R
Holman , G. D., Sui , L., Schwartz , R. A., & Emslie , A. G. 2003, , 595, L97, 10.1086/378488
2003 doi
-
[35]
D., Aschwanden , M
Holman , G. D., Aschwanden , M. J., Aurass , H., et al. 2011, , 159, 107, 10.1007/s11214-010-9680-9
2011 doi
-
[36]
Hung, H. M. J., O'Neill, R. T., Bauer, P., & Köhne, K. 1997, Biometrics, 53, 11. http://www.jstor.org/stable/2533093
1997
-
[37]
J., Schmahl , E
Hurford , G. J., Schmahl , E. J., Schwartz , R. A., et al. 2002, , 210, 61, 10.1023/A:1022436213688
2002 doi
-
[38]
K., Schwartz , R
Ireland , J., Tolbert , A. K., Schwartz , R. A., Holman , G. D., & Dennis , B. R. 2013, , 769, 89, 10.1088/0004-637X/769/2/89
2013 doi
-
[39]
Jeffrey , N. L. S., Saint-Hilaire , P., & Kontar , E. P. 2020, , 642, A79, 10.1051/0004-6361/202038626
2020 doi
-
[40]
Jeffrey , N. L. S., Krucker , S., Stores , M., et al. 2024, , 964, 145, 10.3847/1538-4357/ad236f
2024 doi
- [41]
-
[42]
Karlick \'y , M., & Kontar , E. P. 2012, , 544, A148, 10.1051/0004-6361/201219400
2012 doi
- [43]
-
[44]
P., Hannah , I
Kontar , E. P., Hannah , I. G., & MacKinnon , A. L. 2008, , 489, L57, 10.1051/0004-6361:200810719
2008 doi
-
[45]
P., Jeffrey , N
Kontar , E. P., Jeffrey , N. L. S., & Emslie , A. G. 2019, , 871, 225, 10.3847/1538-4357/aafad3
2019 doi
-
[46]
P., Jeffrey , N
Kontar , E. P., Jeffrey , N. L. S., Emslie , A. G., & Bian , N. H. 2015, , 809, 35, 10.1088/0004-637X/809/1/35
2015 doi
-
[47]
P., MacKinnon , A
Kontar , E. P., MacKinnon , A. L., Schwartz , R. A., & Brown , J. C. 2006, , 446, 1157, 10.1051/0004-6361:20053672
2006 doi
-
[48]
P., Perez , J
Kontar , E. P., Perez , J. E., Harra , L. K., et al. 2017, , 118, 155101, 10.1103/PhysRevLett.118.155101
2017 doi
-
[49]
P., Ratcliffe , H., & Bian , N
Kontar , E. P., Ratcliffe , H., & Bian , N. H. 2012, , 539, A43, 10.1051/0004-6361/201118216
2012 doi
-
[50]
P., Brown , J
Kontar , E. P., Brown , J. C., Emslie , A. G., et al. 2011, , 159, 301, 10.1007/s11214-011-9804-x
2011 doi
- [51]
-
[52]
Kowalski , A. F. 2023, , 943, L23, 10.3847/2041-8213/acb144
2023 doi
-
[53]
J., Grimm, O., et al
Krucker, S., Hurford, G. J., Grimm, O., et al. 2020, Astronomy & Astrophysics, 642, A15
2020
-
[54]
2020, Astrophysics and Space Science, 365, 18
Kumar, P., Choudhary, R., Sampathkumaran, P., & Mandal, S. 2020, Astrophysics and Space Science, 365, 18
2020
-
[55]
R., Dere , K
Landi , E., Young , P. R., Dere , K. P., Del Zanna , G., & Mason , H. E. 2013, , 763, 86, 10.1088/0004-637X/763/2/86
2013 doi
-
[56]
T., Petrosian , V., & McTiernan , J
Lee , T. T., Petrosian , V., & McTiernan , J. M. 1995, , 448, 915, 10.1086/176020
1995 doi
-
[57]
R., Title , A
Lemen , J. R., Title , A. M., Akin , D. J., et al. 2012, , 275, 17, 10.1007/s11207-011-9776-8
2012 doi
- [58]
-
[59]
P., Dennis , B
Lin , R. P., Dennis , B. R., Hurford , G. J., et al. 2002, , 210, 3, 10.1023/A:1022428818870
2002 doi
-
[60]
P., & Bhattacharjee , D
Luo , Y., Kontar , E. P., & Bhattacharjee , D. 2024, , 974, 119, 10.3847/1538-4357/ad6a59
2024 doi
-
[61]
E., Duijveman, A., & Dennis, B
Machado, M. E., Duijveman, A., & Dennis, B. R. 1982, Solar Physics, 79, 85
1982
-
[62]
A., Larosa , T
Miller , J. A., Larosa , T. N., & Moore , R. L. 1996, , 461, 445, 10.1086/177072
1996 doi
-
[63]
2022, , 659, A60, 10.1051/0004-6361/202039598
Mrozek , T., Falewicz , R., Ko oma \'n ski , S., & Litwicka , M. 2022, , 659, A60, 10.1051/0004-6361/202039598
2022 doi
-
[64]
M \"u ller , D., St. Cyr , O. C., Zouganelis , I., et al. 2020, , 642, A1, 10.1051/0004-6361/202038467
2020 doi
-
[65]
Pallister , R., & Jeffrey , N. L. S. 2023, , 958, 18, 10.3847/1538-4357/ad0035
2023 doi
-
[66]
Pallister , R., Jeffrey , N. L. S., & Stores , M. 2025, , 983, 58, 10.3847/1538-4357/adbaf4
2025 doi
-
[67]
Phillips , K. J. H., & Dennis , B. R. 2012, , 748, 52, 10.1088/0004-637X/748/1/52
2012 doi
-
[68]
M., Dickson , E
Purkhart , S., Veronig , A. M., Dickson , E. C. M., et al. 2023, , 679, A99, 10.1051/0004-6361/202346354
2023 doi
-
[69]
2020, , 642, A8, 10.1051/0004-6361/201936663
Rochus , P., Auch \`e re , F., Berghmans , D., et al. 2020, , 642, A8, 10.1051/0004-6361/201936663
2020 doi
-
[70]
Schwartz , R. A. 2020, SPEX: Spectral Executive , Astrophysics Source Code Library, record ascl:2007.017. https://www.ascl.net/2007.017
2020
-
[71]
1996, Advances in Space Research, 17, 9, 10.1016/0273-1177(95)00534-L
Shibata , K. 1996, Advances in Space Research, 17, 9, 10.1016/0273-1177(95)00534-L
1996 doi
-
[72]
2011, Living Reviews in Solar Physics, 8, 6, 10.12942/lrsp-2011-6
Shibata , K., & Magara , T. 2011, Living Reviews in Solar Physics, 8, 6, 10.12942/lrsp-2011-6
2011 doi
-
[73]
M., Lin , R
Smith , D. M., Lin , R. P., Turin , P., et al. 2002, , 210, 33, 10.1023/A:1022400716414
2002 doi
-
[74]
Stores , M., Jeffrey , N. L. S., & Kontar , E. P. 2021, , 923, 40, 10.3847/1538-4357/ac2c65
2021 doi
-
[75]
Stores , M., Jeffrey , N. L. S., & McLaughlin , J. A. 2023, , 946, 53, 10.3847/1538-4357/acb7dc
2023 doi
-
[76]
Sylwester , J., Sylwester , B., Phillips , K. J. H., & Kepa , A. 2022, , 930, 77, 10.3847/1538-4357/ac5b0d
2022 doi
-
[77]
I., & Shmeleva , O
Syrovatskii , S. I., & Shmeleva , O. P. 1972, , 16, 273
1972
-
[78]
M., Brown , J
Thompson , A. M., Brown , J. C., Craig , I. J. D., & Fulber , C. 1992, , 265, 278
1992
-
[79]
2020, OSPEX: Object Spectral Executive , Astrophysics Source Code Library, record ascl:2007.018
Tolbert , K., & Schwartz , R. 2020, OSPEX: Object Spectral Executive , Astrophysics Source Code Library, record ascl:2007.018. https://www.ascl.net/2007.018
2020
-
[80]
2020, , 644, A172, 10.1051/0004-6361/202039529
Warmuth , A., & Mann , G. 2020, , 644, A172, 10.1051/0004-6361/202039529
2020 doi
- [81]
-
[82]
2021, , 908, 111, 10.3847/1538-4357/abce5c
Xia , F., Su , Y., Wang , W., et al. 2021, , 908, 111, 10.3847/1538-4357/abce5c
2021 doi
-
[83]
V., & Gordovskyy , M
Zharkova , V. V., & Gordovskyy , M. 2005, , 432, 1033, 10.1051/0004-6361:20041102
2005 doi
- [84]
Reviewed August 7, 2026 · model on record in the stance chip above.
Discussion (0). Sign in to comment.