REVIEW 3 major objections 6 minor 42 references
The Correlation Thresholding Algorithm for Exploratory Factor Analysis
T0 review · 3 major / 6 minor · reviewed 2026-08-07 · deepseek-v4-flash
Pith's one-line read The Correlation Thresholding algorithm recovers factor structure with average F1 0.901 and stays competitive when its assumptions are violated.
desk verdict Solid sensitivity analysis of CT for EFA; the low-dimensional claims hold up, but the high-dimensional robustness conclusion rests on oracle selection and is overstated as written. read the letter →
The pith
A machine-rendered reading of the paper's core claim, the machinery that carries it, and where it could break.
The reading
What carries the argument
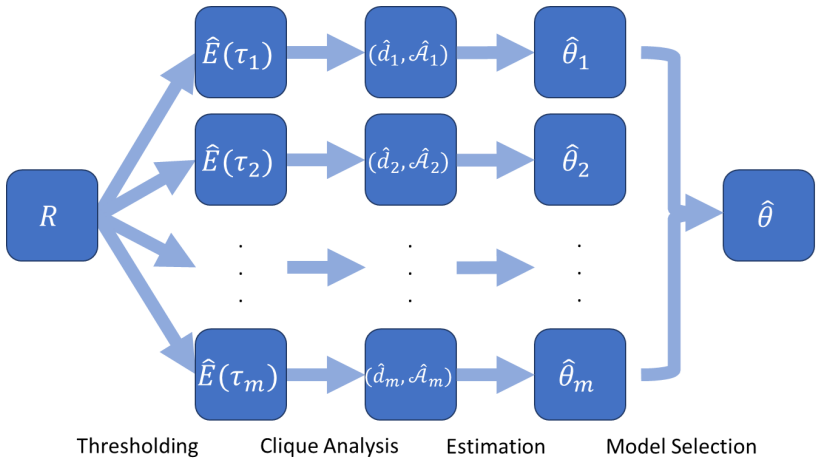
The central object is the thresholded correlation graph G(X, E(τ)), whose edge set contains pairs with |ρ_ij| > τ. Under thresholdability, a suitable τ separates within-factor from between-factor correlations; the independent maximal cliques of this graph then correspond one-to-one to the latent factors' child sets, provided the unique child condition holds. The algorithm searches over all distinct sample correlations as candidate thresholds, proposes a structure for each threshold, estimates each structure by MLE, and selects the final model with BIC.
What would settle it
Re-running the CT algorithm on datasets where thresholdability fails through a mechanism not captured by α or β, such as correlated residuals or strongly non-Gaussian ordinal items while the factor structure is known, and observing a large drop in F1 score would falsify the robustness claim. A direct check is to compare CT's recovered structure against the known model in such data; if average F1 falls materially below the reported 0.901 range, the claim is not general.
Extended reading notes
Core claim
The central claim is that the CT algorithm—which thresholds a sample correlation matrix at all distinct values, extracts independent maximal cliques, and uses those cliques to propose factor structures—recovers the true loading support and factor count accurately even when thresholdability and the unique child condition are violated. In the paper's simulations, violations induced by increasing factor correlation through α and by adding random cross-loadings through β degrade performance gradually: structural accuracy stays high until α equals 1, and it remains moderate when up to half the latent variables lose their unique child. On the real ABCD UPPS-P data, CT is claimed to be the only method that recovers the hypothesized five-factor structure, with F1 0.974, while evaluating 24 models versus 1350 for EFA-MCP.
Load-bearing premise
The load-bearing premise is that the simulation design—Gaussian data, loadings and factor correlations in [0.6, 0.8], and violations induced only through the α and β parameters—is representative of how real factor analysis data depart from the algorithm's assumptions.
Editorial extensions
If this is right
- If the simulations are right, practitioners can recover the number of factors and loading support in one step instead of combining separate eigenvalue, thresholding, and rotation decisions.
- Average F1 of 0.901 across low-dimensional conditions means CT tends to outperform EFA, EFA-LASSO, and EFA-MCP in structural accuracy.
- Accuracy remains high unless thresholdability fails strongly (α close to 1), so mild violations are not fatal.
- With up to half of latent variables violating the unique child condition, CT stays competitive with the penalized alternatives, though it tends to over-extract factors.
- In high-dimensional settings where n is less than p, CT remains a practical structure-learning option where penalized EFA is computationally prohibitive.
Reading between the lines
- The paper defines sortability as a continuous measure of how separable within- and between-factor correlations are; an extension it does not develop is to estimate sortability on real data as a pre-hoc diagnostic, so users can know when CT's output should be trusted.
- Because CT only needs a correlation matrix for structure learning, it could be applied to ordinal or non-linear items by replacing Pearson correlations with polychoric correlations; the paper mentions this as future work, implying the robustness findings might transfer to item-response-theory settings, though this is not tested.
- The factor-splitting pattern when the unique child condition fails suggests a practical warning sign: if CT selects more factors than theory expects, checking whether the estimated maximal cliques are much smaller than the theoretical child-set size could indicate over-extraction rather than true structure.
- The computational comparison counts models evaluated, not the cost of clique enumeration; in very large p settings the real bottleneck may shift to the threshold search and clique extraction, so the advantage over penalized EFA could be smaller than the model count alone suggests.
Editorial analysis
A structured set of objections, weighed in public.
Referee Report
Summary. This paper evaluates the Correlation Thresholding (CT) algorithm of Kim and Zhou (2023) for exploratory factor analysis, which simultaneously determines the number of factors, loading constraints, and rotational identifiability from thresholded correlation graphs. The authors review the two key assumptions (thresholdability and the unique child condition), discuss their implications, and report simulation studies in low-dimensional settings (d = 2-5, n = 250, 500, 1000) and high-dimensional settings (n < p), along with an ABCD UPPS-P real-data example. CT is compared with standard EFA, EFA-LASSO, and EFA-MCP. The main claims are that CT shows reasonable robustness to assumption violations, competitive or superior structural accuracy and fit, and high-dimensional viability while evaluating far fewer candidate models than penalized alternatives.
Significance. If the claims hold, the paper provides a practically valuable validation of a unified EFA procedure that avoids separate steps for factor-count determination, loading-sparsity learning, and rotation selection. The low-dimensional simulation design is thorough (100 datasets per condition, multiple d and n), with a sensible 'sortability' diagnostic, and the real-data example is instructive. The paper also ships reproducible code and supplementary materials, which strengthens its contribution. The significance is tempered by the fact that the high-dimensional results are based on oracle selection of the best candidate structure rather than the algorithm's full model-selection step, so the paper's strongest general claim is not yet fully supported.
major comments (3)
- [Section 4.4 and Figure 10] The high-dimensional results are oracle quantities. The text states 'we focused on only studying the structural accuracy of the CT algorithm. We did this by running the CT algorithm except for the estimation and model selection steps. Doing this yields a set of proposed structures, from which we examined the structure closest to the true structure.' Hence the reported F1, HD, and d_hat values do not describe the model that Algorithm 1's Step 10 (BIC) would return, and the Section 6 claim that 'The CT algorithm also showed viability as a structure learning method in high-dimensional settings' is not backed by an end-to-end run in n < p. This is especially concerning because Section 4.3 already documents cases in which BIC selects a worse structure than available candidates; if BIC behaves similarly in high dimensions, the oracle-best F1 could overstate practical accuracy. The authors should either run the full algorithm in high dimensions (possibly with a coarser threshold grid and a scalable estimation/selection procedure) or explicitly reclassify the high-dimensional results as an upper bound on structural accuracy.
- [Sections 4.2-4.3 and Abstract] The robustness conclusions are specific to a narrow perturbation family. Thresholdability violations are induced only by scaling factor correlations (alpha) and unique-child violations only by adding random cross-loadings (beta), all on Gaussian data with loadings and factor correlations in [0.6, 0.8]. Real EFA settings also involve ordinal/non-Gaussian items, correlated residuals, and structural misspecifications that are not spanned by alpha and beta. The abstract's blanket statement that the CT algorithm 'shows reasonable robustness against violating these assumptions' should be qualified to the simulated violation space, or additional simulations covering these other violation types should be added.
- [Section 4.3] The paper reports that 'the candidate set of structures included solutions with d and F1 scores closer to the true model than the one selected by BIC' when the unique child condition is violated. Since Step 10 of Algorithm 1 is an integral part of the CT procedure, the finding that BIC sometimes selects a worse model is load-bearing for the algorithm's practical recommendation. The manuscript would be stronger if it (i) examined alternative selection criteria (e.g., cross-validation or stability selection) and (ii) reported how often BIC misses the best candidate in the simulation conditions.
minor comments (6)
- [Equation (B1)] The function h in the Hamming distance definition is not defined; please define h(A,B) as the cardinality of the symmetric difference.
- [Section 2.1, Equation (5) area] The non-redundant elements of eSigma contain typos; for example, the (1,1) entry shows eomega_1^2 (and elsewhere eomega_i^2) although eOmega is a diagonal matrix with entries eomega_i, so the diagonal of eSigma should be elambda^2 + eomega_i. In addition, the (5,2) entry appears to read elambda_21 elambda_45 phi_12 but should likely be elambda_21 elambda_52 phi_12.
- [Table 1 caption] The word 'threshsoldable' should be 'thresholdable'.
- [Section 4.1] The counting convention for the number of models for the EFA variants is briefly stated but could be clearer; in particular, it should state explicitly whether the same thresholds are applied to each EFA method or whether the unique structures/d values are pooled.
- [Sections 4.2 and 4.3] The phrase 'we will only examine the results for the n=1000 case' is repeated without a summary of the n=250/500 patterns in the main text; please add a brief description of how those results differ, either in the main text or in the supplement.
- [Section 4.4] The high-dimensional threshold grid uses 50 equidistant values, whereas the low-dimensional grid uses all unique sample correlations; the possible effect of this different granularity on the high-dimensional results should be discussed.
Circularity Check
No circularity found: the CT robustness claims are evaluated on independently simulated data and an external real-data benchmark, not derived from the algorithm's own fitted inputs.
full rationale
This paper is an empirical sensitivity analysis of an existing algorithm. The CT algorithm and its theoretical guarantees are cited from Kim and Zhou (2023), but the simulations are generated independently of that theory: data are drawn from Gaussian factor models with known loading matrices, factor correlations, and error variances, and the recovered structure is compared to the true support (Section 4). No parameter is fitted to the target outcome and then renamed a prediction; the reported F1, Hamming distance, BIC, TLI, and RMSEA values come from actual runs of the specified procedures or from the explicitly stated oracle-best candidate in the high-dimensional setting. The self-citations to Kim and Zhou (2023) supply the algorithm and its assumptions, but the paper does not use those citations to force the empirical conclusion. The only caveat worth noting is the Section 4.4 high-dimensional protocol ('we examined the structure closest to the true structure' rather than the BIC-selected output); this is an oracle evaluation and limits the strength of the n<p viability claim, but it is a methodological limitation, not a circular reduction, since the reported F1 and HD values are still scored against an external true structure. Overall, the derivation chain is self-contained with respect to the empirical claims, and no equation or fitted quantity is equivalent to its own input by construction.
Assumptions & free parameters
free parameters (4)
- Threshold grid tau =
low-dimensional: all unique |r_ij|; high-dimensional: 50 equidistant points in [0,1]
- Loadings and factor correlation range =
[0.6, 0.8]
- Factor correlation scaling alpha =
0, 0.25, 0.5, 0.75, 1
- Unique child violation proportion beta =
0 to 1 by available fraction of latent variables
assumptions (5)
- domain assumption The factor analysis model X = Lambda L + epsilon with L ~ N(0, Phi), epsilon ~ N(0, Omega) diagonal, and d < p.
- domain assumption Thresholdability and the unique child condition are sufficient for consistency of the CT algorithm.
- standard math MLE and BIC are consistent for the candidate factor models.
- standard math Independent maximal cliques can be extracted in polynomial time and correspond to child sets when the unique child condition holds.
- domain assumption The Watts et al. (2020) five-factor model is the true structure of the youth UPPS-P scale.
Cite this review
Pith. "Pith review of The Correlation Thresholding Algorithm for Exploratory Factor Analysis." pith.science (2026). https://pith.science/paper/YPOFLGED
@misc{pith2026250521100,
  author       = {Pith},
  title        = {Pith review of: The Correlation Thresholding Algorithm for Exploratory Factor Analysis},
  year         = {2026},
  howpublished = {\url{https://pith.science/paper/YPOFLGED}},
  note         = {Machine review of arXiv:2505.21100}
}
read the original abstract
Exploratory factor analysis is often used in the social sciences to estimate potential measurement models. To do this, several important issues need to be addressed: (1) determining the number of factors, (2) learning constraints in the factor loadings, and (3) selecting a solution amongst rotationally equivalent choices. Traditionally, these issues are treated separately. This work examines the Correlation Thresholding (CT) algorithm, which uses a graph-theoretic perspective to solve all three simultaneously, from a unified framework. Despite this advantage, it relies on several assumptions that may not hold in practice. We discuss the implications of these assumptions and assess the sensitivity of the CT algorithm to them for practical use in exploratory factor analysis. This is examined over a series of simulation studies, as well as a real data example. The CT algorithm shows reasonable robustness against violating these assumptions and very competitive performance in comparison to other methods.
Figures


Figures from the paper (8 more)


Reference graph
Works this paper leans on
-
[1]
Anderson1988 APACrefauthors Anderson, J C. \ Gerbing, D W. APACrefauthors \ 1988 . Structural equation modeling in practice: A review and recommended two-step approach Structural equation modeling in practice: A review and recommended two-step approach . Psychological Bulletin 103 3 411--423
work page 1988
-
[2]
Auerswald2019 APACrefauthors Auerswald, M. \ Moshagen, M. APACrefauthors \ 2019 . How to determine the number of factors to retain in exploratory factor analysis: A comparison of extraction methods under realistic conditions How to determine the number of factors to retain in exploratory factor analysis: A comparison of extraction methods under realistic ...
work page 2019
-
[3]
Bollen1991 APACrefauthors Bollen, K. \ Lennox, R. APACrefauthors \ 1991 . Conventional wisdom on measurement: A structural equation perspective Conventional wisdom on measurement: A structural equation perspective . Psychological Bulletin 110 2 305–314 . APACrefDOI doi:10.1037/0033-2909.110.2.305 APACrefDOI
-
[4]
Browne1968 APACrefauthors Browne, M W. APACrefauthors \ 1968 . A comparison of factor analytic techniques A comparison of factor analytic techniques . Psychometrika 33 3 1968
work page 1968
-
[5]
Browne2001 APACrefauthors Browne, M W. APACrefauthors \ 2001 . An overview of analytic rotation in exploratory factor analysis An overview of analytic rotation in exploratory factor analysis . Multivariate Behavioral Research 36 1 111--150
work page 2001
-
[6]
Cattell1966 APACrefauthors Cattell, R B. APACrefauthors \ 1966 . The Scree Test for the number of factors The Scree Test for the number of factors . Multivariate Behavioral Research 1 2 245--276
work page 1966
-
[7]
Clark2018 APACrefauthors Clark, D B. , Fisher, C B. , Bookheimer, S. , Brown, S A. , Evans, J H. , Hopfer, C. Yurgelun-Todd, D. APACrefauthors \ 2018 . Biomedical ethics and clinical oversight in multisite observational neuroimaging studies with children and adolescents: The ABCD experience Biomedical ethics and clinical oversight in multisite observation...
work page 2018
-
[8]
Eppstein2010 APACrefauthors Eppstein, D. , L \" o ffler, M. \ Strash, D. APACrefauthors \ 2010 . Listing all maximal cliques in sparse graphs in near-optimal time Listing all maximal cliques in sparse graphs in near-optimal time . International S ymposium on A lgorithms and C omputation International S ymposium on A lgorithms and C omputation \ ( \ 403--414)
work page 2010
Show all 42 references
-
[9]
, MacCallum, R C
Ford1986 APACrefauthors Ford, J K. , MacCallum, R C. \ Tait, M. APACrefauthors \ 1986 . The application of exploratory factor analysis in applied psychology: A critical review and analysis The application of exploratory factor analysis in applied psychology: A critical review ...
1986
-
[10]
APACrefauthors \ 1995
Glorfeld1995 APACrefauthors Glorfeld, L W. APACrefauthors \ 1995 . An improvement on Horn's parallel analysis methodology for selecting the correct number of factors to retain An improvement on Horn's parallel analysis methodology for selecting the correct number of factors to...
1995
-
[11]
APACrefauthors \ 2006
Graham2006 APACrefauthors Graham, J M. APACrefauthors \ 2006 . Congeneric and (essentially) tau-equivalent estimates of score reliability: What they are and how to use them Congeneric and (essentially) tau-equivalent estimates of score reliability: What they are and how to use...
2006 doi
-
[12]
APACrefauthors \ 1954
Guttman1954 APACrefauthors Guttman, L. APACrefauthors \ 1954 . Some necessary conditions for common-factor analysis Some necessary conditions for common-factor analysis . Psychometrika 19 2 149--161
1954
-
[13]
\ Kaiser, H F
Harris1964 APACrefauthors Harris, C W. \ Kaiser, H F. APACrefauthors \ 1964 . Oblique factor analytic solutions by orthogonal transformations Oblique factor analytic solutions by orthogonal transformations . Psychometrika 29 4 347--362
1964
-
[14]
APACrefauthors \ 1985
Hattie1985 APACrefauthors Hattie, J. APACrefauthors \ 1985 . Methodology review: Assessing unidimensionality of tests and items Methodology review: Assessing unidimensionality of tests and items . Applied Psychological Measurement 9 2 139--164
1985
-
[15]
\ Yamamoto, M
Hirose2014b APACrefauthors Hirose, K. \ Yamamoto, M. APACrefauthors \ 2014 1 . Estimation of an oblique structure via penalized likelihood factor analysis Estimation of an oblique structure via penalized likelihood factor analysis . Computational Statistics and Data Analysis 7...
2014
-
[16]
\ Yamamoto, M
Hirose2014a APACrefauthors Hirose, K. \ Yamamoto, M. APACrefauthors \ 2014 2 . Sparse estimation via nonconcave penalized likelihood in factor analysis model Sparse estimation via nonconcave penalized likelihood in factor analysis model . Statistics and Computing 25 5 863--875
2014
-
[17]
APACrefauthors \ 1965
Horn1965 APACrefauthors Horn, J L. APACrefauthors \ 1965 . A rationale and test for the number of factors in factor analysis A rationale and test for the number of factors in factor analysis . Psychometrika 30 2 179--185
1965
-
[18]
APACrefauthors \ 2016
Howard2016 APACrefauthors Howard, M C. APACrefauthors \ 2016 . A review of exploratory factor analysis decisions and overview of current practices: What we are doing and how can we improve? A review of exploratory factor analysis decisions and overview of current practices: Wh...
2016
-
[19]
APACrefauthors \ 2001
Jennrich2001 APACrefauthors Jennrich, R I. APACrefauthors \ 2001 . A simple general procedure for orthogonal rotation A simple general procedure for orthogonal rotation . Psychometrika 66 2 289--306
2001
-
[20]
APACrefauthors \ 2006
Jennrich2006 APACrefauthors Jennrich, R I. APACrefauthors \ 2006 . Rotation to simple loadings using component loss functions: The oblique Case Rotation to simple loadings using component loss functions: The oblique Case . Psychometrika 71 1 173--191
2006
-
[21]
APACrefauthors \ 1960
Kaiser1960 APACrefauthors Kaiser, H F. APACrefauthors \ 1960 . The application of electronic computers to factor analysis The application of electronic computers to factor analysis . Educational and Psychological Measurement 20 1 141--151
1960
-
[22]
\ Zhou, Q
Kim2023 APACrefauthors Kim, D S. \ Zhou, Q. APACrefauthors \ 2023 . Structure learning of latent factors via clique search on correlation thresholded graphs Structure learning of latent factors via clique search on correlation thresholded graphs . Proceedings of the 40th I nte...
2023
-
[23]
\ Ramsey, J
Kummerfeld2016 APACrefauthors Kummerfeld, E. \ Ramsey, J. APACrefauthors \ 2016 Aug . Causal clustering for 1-factor measurement models Causal clustering for 1-factor measurement models . Proceedings of the 22nd ACM SIGKDD I nternational C onference on K nowledge D iscovery an...
2016
-
[24]
\ Bühlmann, P
Meinshausen_2010 APACrefauthors Meinshausen, N. \ Bühlmann, P. APACrefauthors \ 2010 . Stability selection Stability selection . Journal of the Royal Statistical Society: Series B (Statistical Methodology) 72 4 417–473 . APACrefDOI doi:10.1111/j.1467-9868.2010.00740.x APACrefDOI
2010
-
[25]
, Hunter, M D
Neale2016 APACrefauthors Neale, M C. , Hunter, M D. , Pritikin, J N. , Zahery, M. , Brick, T R. , Kirkpatrick, R M. Boker, S M. APACrefauthors \ 2016 . OpenMx 2.0: Extended structural equation and statistical modeling Openmx 2.0: Extended structural equation and statistical mo...
2016 doi
-
[26]
, Zhang, G
Preacher2013 APACrefauthors Preacher, K J. , Zhang, G. , Kim, C. \ Mels, G. APACrefauthors \ 2013 . Choosing the optimal number of factors in exploratory factor analysis: A model selection perspective Choosing the optimal number of factors in exploratory factor analysis: A mod...
2013
-
[27]
APACrefauthors \ 2023
R2023 APACrefauthors R Core Team . APACrefauthors \ 2023 . R: A Language and Environment for Statistical Computing R: A language and environment for statistical computing \ [ ]. Vienna, Austria . APACrefURL https://www.R-project.org/ APACrefURL
2023
-
[28]
, Walls, T A
Raiche2013 APACrefauthors Ra \^ i che, G. , Walls, T A. , Magis, D. , Riopel, M. \ Blais, J G. APACrefauthors \ 2013 . Non-graphical solutions for Cattell's Scree Test Non-graphical solutions for Cattell's Scree Test . Methodology 9 1 23--29
2013
-
[29]
\ Nestler, S
Scharf2019 APACrefauthors Scharf, F. \ Nestler, S. APACrefauthors \ 2019 . Should regularization replace simple structure rotation in exploratory factor analysis? Should regularization replace simple structure rotation in exploratory factor analysis? Structural Equation Modeli...
2019
-
[30]
, Spirtes, P
Scheines1998 APACrefauthors Scheines, R. , Spirtes, P. , Glymour, C. , Meek, C. \ Richardson, T. APACrefauthors \ 1998 . The TETRAD project: Constraint based aids to causal model specification The TETRAD project: Constraint based aids to causal model specification . Multivaria...
1998
-
[31]
, Hoyer, P O
Shimizu2009 APACrefauthors Shimizu, S. , Hoyer, P O. \ Hyvärinen, A. APACrefauthors \ 2009 . Estimation of linear non-Gaussian acyclic models for latent factors Estimation of linear non-gaussian acyclic models for latent factors . Neurocomputing 72 7–9 2024-–2027 . APACrefDOI ...
2009 doi
-
[32]
, Scheines, R
Silva2006 APACrefauthors Silva, R. , Scheines, R. , Glymour, C. \ Spirtes, P. APACrefauthors \ 2006 . Learning the structure of linear latent variable models Learning the structure of linear latent variable models . Journal of Machine Learning Research 7 191--246
2006
-
[33]
\ Lind, J C
Steiger1980 APACrefauthors Steiger, J H. \ Lind, J C. APACrefauthors \ 1980 . Statistically based tests for the number of common factors Statistically based tests for the number of common factors . Meeting of the P sychometric S ociety. Meeting of the P sychometric S ociety. I...
1980
-
[34]
APACrefauthors \ 1996
Tibshirani1996 APACrefauthors Tibshirani, R. APACrefauthors \ 1996 . Regression shrinkage and selection via the Lasso Regression shrinkage and selection via the Lasso . Journal of the Royal Statistical Society: Series B 58 1 267--288
1996
-
[35]
\ Lewis, C
Tucker1973 APACrefauthors Tucker, L R. \ Lewis, C. APACrefauthors \ 1973 . A reliability coefficient for maximum likelihood factor analysis A reliability coefficient for maximum likelihood factor analysis . Psychometrika 38 1 1–10
1973
-
[36]
\ Jackson, D N
Velicer1990 APACrefauthors Velicer, W F. \ Jackson, D N. APACrefauthors \ 1990 . Component analysis versus common factor analysis: Some issues in selecting an appropriate procedure Component analysis versus common factor analysis: Some issues in selecting an appropriate proced...
1990
-
[37]
, Koob, G F
Volkow2018 APACrefauthors Volkow, N D. , Koob, G F. , Croyle, R T. , Bianchi, D W. , Gordon, J A. , Koroshetz, W J. Weiss, S R. APACrefauthors \ 2018 . The conception of the ABCD study: From substance use to a broad NIH collaboration The conception of the ABCD study: From subs...
2018 doi
-
[38]
, Smith, G T
Watts2020 APACrefauthors Watts, A L. , Smith, G T. , Barch, D M. \ Sher, K J. APACrefauthors \ 2020 . Factor structure, measurement and structural invariance, and external validity of an abbreviated youth version of the UPPS-P Impulsive Behavior Scale Factor structure, measure...
2020 doi
-
[39]
APACrefauthors \ 1983
Whitely1983 APACrefauthors Whitely, S E. APACrefauthors \ 1983 . Construct validity: Construct representation versus nomothetic span Construct validity: Construct representation versus nomothetic span . Psychological Bulletin 93 1 179--197
1983
-
[40]
\ Lynam, D R
Whiteside2001 APACrefauthors Whiteside, S P. \ Lynam, D R. APACrefauthors \ 2001 . The Five Factor Model and impulsivity: Using a structural model of personality to understand impulsivity The five factor model and impulsivity: Using a structural model of personality to underst...
2001 doi
-
[41]
APACrefauthors \ 2010
Zhang2010 APACrefauthors Zhang, C H. APACrefauthors \ 2010 . Nearly unbiased variable selection under minimax concave penalty Nearly unbiased variable selection under minimax concave penalty . Annals of Statistics 38 2 894--942
2010
-
[42]
\ Velicer, W F
Zwick1986 APACrefauthors Zwick, W R. \ Velicer, W F. APACrefauthors \ 1986 . Comparison of five rules for determining the number of components to retain Comparison of five rules for determining the number of components to retain . Psychological Bulletin 99 432--442
1986
Reviewed August 7, 2026 · model on record in the stance chip above.
Discussion (0). Sign in to comment.