REVIEW 4 major objections 5 minor 54 references
Retrieving Tropical Cyclone Intensity from Climate Reanalysis using Deep Learning
T0 review · 4 major / 5 minor · reviewed 2026-08-04 · deepseek-v4-flash
Pith's one-line read A convolutional neural network can retrieve tropical cyclone intensity and size directly from coarse 0.5-degree climate reanalysis fields, outperforming direct vortex detection by a wide margin.
desk verdict An honest and useful CNN benchmark for TC intensity retrieval from coarse reanalysis, but the headline random-split number leaks same-storm data and the environmental-imprint mechanism is not actually isolated. read the letter →
The pith
A machine-rendered reading of the paper's core claim, the machinery that carries it, and where it could break.
The reading
What carries the argument
The load-bearing mechanism is a five-layer convolutional neural network (TCNN) applied to 64×64-pixel, 13-channel input patches of 0.5° reanalysis fields, with a 7×7 kernel chosen to match the roughly 200-km TC central region at this resolution. A multi-output regression head (or separate heads) predicts VMAX, PMIN, and RMW; data augmentation via random rotation/zoom, Huber/Log-cosh losses, and kernel-size tuning are secondary supports. The key physical idea is that the model reads the ambient environment rather than the unresolved core, so the input domain and kernel must capture environmental TC imprints without smoothing them out.
What would settle it
Run a controlled experiment with a high-resolution TC simulation: coarsen the fields to a 0.5° grid, train the TCNN on the coarse fields with the simulation's true known intensity, and test on independent simulated storms. If the recovered intensity does not beat a climatological baseline on this synthetic data, the reanalysis skill is an artifact of best-track label correlations rather than environmental information.
Extended reading notes
Core claim
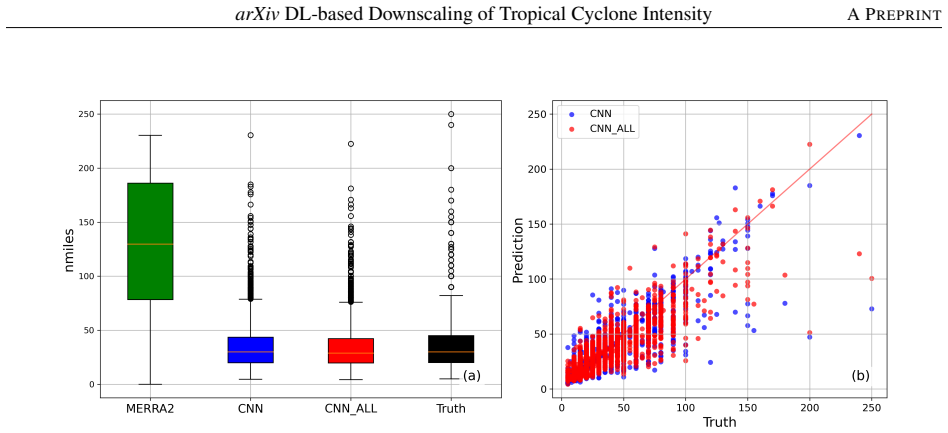
Using a five-layer convolutional network (TCNN) applied to 13 environmental channels in an 18°×18° box around each storm, the paper retrieves VMAX, PMIN, and RMW from 0.5° reanalysis fields. On a random split, VMAX RMSE is 7.1–7.45 kt (MAE 4.6–5.0 kt) versus 29.9 kt for direct grid-point vortex detection; PMIN RMSE is about 11 hPa versus 18.5 hPa; RMW RMSE is about 19–21 km. Joint multi-output prediction keeps the pressure–wind relationship closer to best-track curves toward the high-intensity tail. The authors conclude that storm development leaves environmental imprints that DL can learn, even with the inner core unresolved.
Load-bearing premise
The assumption is that a storm's surrounding environment at 0.5° resolution contains enough information to determine its intensity even though the storm's inner core is not resolved; if false, the network's skill is just an artifact of the training labels.
Editorial extensions
If this is right
- If the claim holds, TC intensity can be downscaled from existing coarse-resolution global climate outputs without expensive dynamical downscaling or super-resolution preprocessing, reducing computational cost for projections.
- The simultaneous prediction of VMAX, PMIN, and RMW gives a dynamically constrained estimate of storm structure, not just a point intensity, which could improve wind-pressure consistency in downscaled TC fields.
- Moisture fields in the lower troposphere are the most influential input; operational retrieval should prioritize accurate humidity analysis in the 950–750 hPa layer.
- Because the chronological (unseen-year) split raises VMAX RMSE from about 7 to about 19 kt, applications to future climates or new storms should expect substantially lower skill than random-split benchmarks suggest.
- The method still beats direct vortex detection under the harder chronological split, so even imperfect environmental retrieval is an improvement over current grid-point estimates.
Reading between the lines
- A testable extension would apply the same architecture to high-resolution simulations coarsened to 0.5°, where true intensity is known exactly, isolating how much of the skill comes from environmental information versus best-track label patterns.
- If the ambient-environment assumption transfers, the approach could be fine-tuned on climate-model output at even coarser grids (e.g., 1°–2°), offering a computationally cheap intensity correction for future TC projections; the paper does not test this.
- The sharp drop in skill from random to chronological sampling suggests that some of the apparent 7-kt accuracy may reflect the model recognizing storm-specific patterns rather than general environmental intensity relationships; a stricter benchmark should report out-of-basin or out-of-decade performance.
- The moisture-channel dominance hints that TC intensity downscaling is largely a thermodynamic retrieval, so adding boundary-layer moisture or sea-surface-temperature channels may yield further gains; this is not explored in the paper.
Editorial analysis
A structured set of objections, weighed in public.
Referee Report
Summary. The paper presents TCNN, a five-layer convolutional neural network that uses 13 MERRA-2 fields in an 18°×18° domain centered on IBTrACS positions to predict VMAX, PMIN, and RMW. With the standard random-split evaluation, the model reports VMAX RMSE of 7.11–7.45 kt, PMIN RMSE of 11.1–11.5 hPa, and RMW RMSE of 12.4–12.9 nm, substantially better than direct grid-point vortex detection (29.9 kt for VMAX). The authors also perform a one-year-out chronological split, which increases VMAX RMSE to ≈19.2 kt. Sensitivity experiments examine domain size, kernel size, layer/filter counts, input channel removal, seasonal stratification, and sampling strategy. The paper concludes that ambient environmental fields at 0.5° resolution contain enough information for DL models to retrieve TC intensity and size, and that this approach offers an alternative beyond statistical/dynamical downscaling.
Significance. The practical problem—retrieving TC intensity metrics from coarse climate/reanalysis grids without expensive dynamical downscaling—is important, and the public release of the TCNN code and data pipeline is a clear strength. The paper is also unusually transparent about the strong assumption in §2.2 and about the sampling leakage in §3.2.3. If the chronological-split skill were the headline, the result would be a modest but useful proof of concept. However, the central claim as written—that DL retrieves intensity from ambient environments without fine-scale inner-core information—is not actually isolated by the experiments, and the reported accuracy ranges are inconsistent across the abstract, §3, and §4. These issues are load-bearing for the advertised mechanism and for the claimed advantage over existing downscaling methods.
major comments (4)
- [Abstract, §3.2.3, §4] The headline VMAX accuracy is from the random split: §3.1 reports RMSE 7.11–7.45 kt, and §4 states “RMSE as low as 2–3 m s−1 for VMAX.” The one-year-out chronological split in §3.2.3 increases VMAX RMSE to ≈19.2 kt (≈9.9 m s−1). Because random splitting places cycles of the same TC in both training and test, the 7.1-kt number is an in-sample calibration estimate, not a retrieval error for unseen storms. All accuracy claims in the abstract and conclusions must be labeled by split, and the “2–3 m s−1” value appears to be the MAE (4.6–4.98 kt), not the RMSE.
- [§2.2, §3.1, Fig. 2] The paper attributes the skill to ambient environmental imprints, but that mechanism is not isolated. The 18° input domain is centered on the TC and includes the 4×4-point coarse vortex; the first 7×7 convolution covers that vortex. The CNN could be calibrating the smoothed central wind/pressure depression in MERRA-2 against the best-track label. No experiment masks the central patch, excludes inner-core grid points, or compares against a simple regression on the coarse-grid VMAX/PMIN. Given the authors’ own “strong assumption” in §2.2, an ablation separating central-vortex from environmental information is needed; the abstract/conclusions currently overstate the environmental-imprint interpretation.
- [Abstract, §4] The claim of being better than (or going beyond) statistical/dynamical downscaling is unsupported by the experiments. The only baseline is direct grid-point vortex detection (VMAX RMSE 29.9 kt; PMIN 18.5 hPa). No statistical downscaling, no super-resolution method, and no simple regression baseline is run. A linear or ridge regression on the same coarse vortex/environmental fields could plausibly beat the 29.9-kt vortex detector without any CNN. Either add such baselines or remove the comparative claims; otherwise the paper cannot support the phrase “beyond current statistical or dynamical downscaling methods.”
- [Abstract vs §3.1 vs §4] The reported error ranges are internally inconsistent: the abstract gives VMAX RMSE ≈8–10 m s−1 (the full-text abstract says 3–9 m s−1), §3.1 gives 7.11–7.45 kt (3.7–3.8 m s−1), and §4 says “as low as 2–3 m s−1”. PMIN ranges similarly: 10–13 hPa, 10–20 hPa, 11.1–11.5 hPa, and §4’s “10–11 hPa”. These values come from different splits and metrics. Every number needs a label (split, metric, unit), and the abstract should not mix the random-split and chronological-split results.
minor comments (5)
- [§2.1] “kernel sizes of 32, 64, 128, 256, and 512” should be “number of filters”; the kernel size is 7×7. The current wording makes the architecture description confusing.
- [Eq. (1)] The learning-rate formula is not typeset correctly; the denominator appears as “1 + (epoch/107.0)^1.35” with a stray “1” before the fraction. Please restate the formula cleanly.
- [§2.3 and §3.2.3] Clarify whether the held-out year is used for model selection/early stopping or only as a final test, and report the number of repetitions N used for the error bars in Fig. 9.
- [pp. 2, 18] Typos: “power disipitation index” should be “power dissipation index”, and “TCCN” should be “TCNN”.
- [Abstract/§1] The contrast “without requiring super-resolution enhancement as in previous studies” should cite at least one such previous study or be softened, since no super-resolution comparison is performed.
Circularity Check
Disclosed same-storm leakage partly inflates the headline random-split RMSE, and the 'ambient environment' mechanism claim echoes the §2.2 assumption without an isolating experiment; the chronological-split result and released code keep the core finding externally evaluated.
-
fitted input called prediction
[§3.1 (DL model benchmarking, Fig. 2); leakage admitted in §2.3 and §3.2.3]
"the TCNN model captures well several key statistics of VMAX ... with RMSE and MAE in the range of 7.11-7.45 and 4.61-4.98 kt ... If all TC data are randomly sampled for training and testing as for traditional DL model development, some data from the same TCs may be distributed in both the training and test datasets, causing overfitting issues"
The headline benchmark (7.1-7.45 kt) is computed on a test set containing cycles of the same TCs whose other 6-hourly cycles (nearly identical 18x18-degree input fields, same storm) appear in training. The test prediction is therefore partly forced by memorization/nearest-neighbor retrieval of near-duplicate inputs rather than by a learned environmental mapping. This is a fitted-input-called-prediction at the evaluation-statistic level. The paper discloses the issue and supplies the chronological-split estimate (RMSE approx 19.2 kt, Fig. 9), so the circularity is partial and contained; the authors do not rest the abstract's error range on the leaky number.
-
other
[§2.2 (stated assumption) vs §3.1 and §4 Conclusions (claimed finding); patch/kernel design in §2.1-2.3]
"similar to the built-in assumption in [35, 38], we will assume herein that ambient environments should contain sufficient information to determine TC intensity during the course of TC development, even with a TC structure at the 0.5 degree resolution. This is a strong assumption ... our TCNN model demonstrates that TC development must leave some imprints on large-scale environments that DL models can actually learn from data, even without all fine-scale details."
The paper's central interpretation - that skill derives from 'ambient environments' rather than the TC's own (partially resolved) inner core - is the §2.2 assumption restated as an empirical implication. The design never isolates the two: the 64x64 input patch spans 18x18 degrees and contains the coarse vortex (about 4x4 grid points at 0.5 degrees, matched by the 7x7 kernel justified in §2.1), and the §3.3 channel analysis attributes the largest degradation to moisture fields forming an 'eyewall moisture ring,' an inner-core pattern. The results are consistent with the assumption but cannot confirm its mechanism; the claimed finding is not discriminatorily tested. This is interpretive circularity (assumption echoed as conclusion), not an equation-level reduction.
full rationale
The paper contains no analytic derivation chain; its substantive claims are an ML evaluation against an external benchmark (IBTrACS best tracks), with code released on Zenodo (§2.5). The most independent comparison - chronological split on unseen years, RMSE approx 19.2 kt for VMAX versus 29.9 kt for untrained direct grid-point vortex detection - is an honest, externally computed number, and the Z-score discussion (§3.1) shows awareness that the labels themselves carry uncertainty. Self-citations [35, 38] support only the explicitly flagged 'strong assumption' and channel-selection precedent; they are not invoked as uniqueness theorems and do not determine any reported RMSE, so they are background rather than load-bearing circularity. Two issues keep the score above zero. First, the prominently reported random-split RMSE (7.1-7.45 kt) is partly forced by same-storm train/test overlap; the authors disclose this and provide the corrected chronological estimate, so the inflation is acknowledged but the metric is still presented as the main benchmarking result in §3.1. Second, the 'ambient environment' mechanism claim restates the §2.2 assumption while no experiment excises the partially resolved coarse vortex from the input patch, leaving the physical interpretation underdetermined. Neither issue reduces the central result to its inputs by construction, and the abstract's quoted error range (approx 8-10 m/s, i.e., the chronological regime) is conservative; the appropriate score is therefore moderate, reflecting partial, disclosed circularities rather than a definitional collapse.
Assumptions & free parameters
free parameters (6)
- CNN kernel size =
7×7
- Input domain size =
18°×18°
- Network depth and filter widths =
5 layers; 32/64/128/256/512
- Learning-rate schedule =
Eq. 1 constants (-0.0497, 107.0, 1.35; lr 0.001→0.0001)
- Data augmentation settings =
rotation 10%, zoom 20% (text also mentions -45°..45°)
- Missing-data cutoff and imputation =
NaN >5% excluded; 950-hPa fields used to fill gaps
assumptions (4)
- domain assumption Ambient large-scale environment at 0.5° contains sufficient information to estimate TC intensity even without a resolved inner core
- domain assumption IBTrACS VMAX/PMIN/RMW values are suitable training labels despite known best-track uncertainties
- domain assumption MERRA-2 grid variables can be paired with IBTrACS fixes by timestamp and location
- ad hoc to paper The 13 selected input channels and the 18° domain span the relevant environmental controls of TC intensity
Cite this review
Pith. "Pith review of Retrieving Tropical Cyclone Intensity from Climate Reanalysis using Deep Learning." pith.science (2026). https://pith.science/paper/YX2TDSGE
@misc{pith2026251105392,
  author       = {Pith},
  title        = {Pith review of: Retrieving Tropical Cyclone Intensity from Climate Reanalysis using Deep Learning},
  year         = {2026},
  howpublished = {\url{https://pith.science/paper/YX2TDSGE}},
  note         = {Machine review of arXiv:2511.05392}
}
abstract
Traditional methods for improving tropical cyclone (TC) intensity from climate model outputs or projections have primarily relied on either dynamical or statistical downscaling. With recent advances in deep learning (DL) techniques, an important question is how DL can provide an alternative approach for enhancing TC intensity and structure retrieval from climate data. Using a common DL architecture based on convolutional neural networks (CNN) and a set of key environmental features relevant to TCs, we show that TC intensity and size can be effectively retrieved from climate reanalysis data without requiring super-resolution enhancement as in previous studies, even when applied to coarse-resolution climate data. This approach allows for retrieving TC intensity metrics and size that are dynamically constrained by the data, rather than estimating these quantities independently. Our results highlight that TC intensity and size are governed not only by TC internal processes but also by local environments during TC development for which DL models can learn and capture. The performance of our DL model depends on several factors such as season, the stage of TC development, or ocean basins, with root-mean-square errors ranging from $\approx$8-10 m s$^{-1}$ for the maximum 10-m wind, $\approx$10-13 hPa for minimum central pressure, and $\approx$13-21 km for the radius of the maximum wind. Although these errors are better than any direct vortex detection or statistical downscaling methods applied to the same data, their wide ranges also suggest that a 0.5$^\circ$-resolution climate data may contain limited TC information for DL models to learn from, regardless of model optimizations or architectures. Possible improvements and challenges in addressing the lack of fine-scale TC information in coarse-resolution climate reanalysis datasets are discussed.
Figures


Figures from the paper (9 more)



Reference graph
Works this paper leans on
-
[1]
Kevin A. Hill and Gary M. Lackmann. The impact of future climate change on tc intensity and structure: A downscaling approach.Journal of Climate, 24(17):4644–4661, 2011. doi:10.1175/2011JCLI3761.1
-
[2]
T. R. Knutson, R. E. Tuleya, and Y . Kurihara. Simulated increase of hurricane intensities in a co2-warmed climate. Science, 279(5353):1018–1021, 1998. doi:10.1126/science.279.5353.1018
arXiv 1998
-
[3]
Julio T. Bacmeister, Kevin A. Reed, Cecile Hannay, Peter Lawrence, Susan Bates, John E. Truesdale, Nan Rosenbloom, and Michael Levy. Projected changes in tropical cyclone activity under future warming scenar- ios using a high-resolution climate model.Climatic Change, 146(3):547–560, Feb 2018. ISSN 1573-1480. doi:10.1007/s10584-016-1750-x. URLdoi.org/10.10...
-
[4]
Thomas R. Knutson, Joseph J. Sirutis, Stephen T. Garner, Isaac M. Held, and Robert E. Tuleya. Simulation of the recent multidecadal increase of atlantic hurricane activity using an 18-km-grid regional model.Bulletin of the American Meteorological Society, 88(10):1549 – 1565, 2007. doi:10.1175/BAMS-88-10-1549
-
[5]
R. E. McDonald, D. G. Bleaken, D. R. Cresswell, V . D. Pope, and C. A. Senior. Tropical storms: Representation and diagnosis in climate models and the impacts of climate change.Climate Dynamics, 25:19–36, 2005. doi:10.1007/s00382-004-0491-0
-
[6]
Hiroyuki Murakami, Bin Wang, and Akio Kitoh. Future change of western north pacific typhoons: Pro- jections by a 20-km-mesh global atmospheric model.Journal of Climate, 24(4):1154 – 1169, 2011. doi:10.1175/2010JCLI3723.1
-
[7]
G. A. Vecchi, M. Zhao, H. Wang, G. Villarini, A. Rosati, A. Kumar, I. M. Held, and R. Gudgel. Statistical- dynamical predictions of seasonal north atlantic hurricane activity.Mon. Wea. Rev., 139:1070–1082, 2011
2011
-
[8]
Wehner, G
Michael F. Wehner, G. Bala, Phillip Duffy, Arthur A. Mirin, and Raquel Romano. Towards direct simulation of future tropical cyclone statistics in a high-resolution global atmospheric model.Advances in Meteorology, 2010, 1
2010
Show all 54 references
-
[9]
Emmi Yonekura and Timothy M. Hall. A statistical model of tropical cyclone tracks in the western north pacific with enso-dependent cyclogenesis.Journal of Applied Meteorology and Climatology, 50(8):1725 – 1739, 2011. doi:10.1175/2011JAMC2617.1
2011 doi
-
[10]
Jianping Tang, Xiaorui Niu, Shuyu Wang, Hongxia Gao, Xueyuan Wang, and Jian Wu. Statistical downscaling and dynamical downscaling of regional climate in china: Present climate evaluations and future climate projections.Journal of Geophysical Research: Atmospheres, 121(5):2110–...
2016 doi
-
[11]
Camargo, Hiroyuki Murakami, Nadia Bloemendaal, Savin S
Suzana J. Camargo, Hiroyuki Murakami, Nadia Bloemendaal, Savin S. Chand, Medha S. Deshpande, Christian Dominguez-Sarmiento, Juan Jesús González-Alemán, Thomas R. Knutson, I.-I. Lin, Il-Ju Moon, Christina M. Patricola, Kevin A. Reed, Malcolm J. Roberts, Enrico Scoccimarro, Chi ...
2023
-
[12]
Knaff, and Bernadette H
Mark DeMaria, John A. Knaff, and Bernadette H. Connell. Tropical cyclone intensity change predictability estimates using a statistical-dynamical model (2010 - 29hurricanes_29hurricanes).Wea. Forecasting, 16:219–233,
2010
-
[13]
K. A. Emanuel. A statistical analysis of tropical cyclone intensity.Monthly Weather Review, 128(4):1139–1152,
-
[14]
Denis, René Laprise, Daniel Caya, and Jean Côté
B. Denis, René Laprise, Daniel Caya, and Jean Côté. Downscaling ability of one-way nested regional climate models: The big-brother experiment.Climate Dynamics, 18:627–646, 04 2002. doi:10.1007/s00382-001-0201-0
2002 doi
-
[15]
Jones, and Katja Winger
Louis-Philippe Caron, Colin G. Jones, and Katja Winger. Impact of resolution and downscaling technique in simulating recent atlantic tropical cylone activity.Climate Dynamics, 37(5):869–892, Sep 2011. ISSN 1432-0894. doi:10.1007/s00382-010-0846-7
2011 doi
-
[16]
Investigating global tropical cyclone activity with a hierarchy of agcms: The role of model resolution.Journal of Climate, 26 (1):133–152, 2013
Jane Strachan, Pier Luigi Vidale, Kevin Hodges, Malcolm Roberts, and Marie-Estelle Demory. Investigating global tropical cyclone activity with a hierarchy of agcms: The role of model resolution.Journal of Climate, 26 (1):133–152, 2013. doi:10.1175/JCLI-D-12-00012.1
2013 doi
-
[17]
Hurricanes and Climate Change
Michael Wehner, Kevin Reed, and Colin Zarzycki.High-Resolution Multi-decadal Simulation of Tropical Cyclones, pages 187–211. Hurricanes and Climate Change. Lawrence Berkeley National Laboratory., 02 2017. ISBN 978-3-319-47592-9. doi:10.1007/978-3-319-47594-3_8
2017 doi
-
[18]
Robeson, Paul Staten, and Ben Kravitz
The-Anh Vu, Chanh Kieu, Scott M. Robeson, Paul Staten, and Ben Kravitz. Climate projection of tropical cyclone lifetime in the western north pacific basin.Journal of Climate, 2024. doi:10.1175/JCLI-D-24-0131.1. URL https: //journals.ametsoc.org/view/journals/clim/aop/JCLI-D-24...
2024 doi
-
[19]
K. J. E. Walsh, M. Fiorino, C. W. Landsea, and K. L. McInnes. Objectively determined resolution-dependent threshold criteria for the detection of tropical cyclones in climate models and reanalyses.Journal of Climate, 20 (10):2307–2314, 2007. doi:10.1175/JCLI4074.1
2007 doi
-
[20]
C. M. Zarzycki and P. A. Ullrich. Assessing sensitivities in algorithmic detection of tropical cyclones in climate data.Geophysical Research Letters, 44:1141–1149, 2017
2017
-
[21]
Chanh Kieu, S. J. Camargo, and Hue Nguyen. Environmental controls on future projections of western north pacific tropical cyclone maximum intensity, 2025. URL https://doi.org/10.1038/s41612-025-01214-6
2025 doi
-
[22]
Wing, Kerry Emanuel, and Susan Solomon
Allison A. Wing, Kerry Emanuel, and Susan Solomon. On the factors affecting trends and variability in tropical cy- clone potential intensity.Geophys. Res. Lett., 42(20):2015GL066145, October 2015. doi:10.1002/2015GL066145
2015 doi
-
[23]
C. A. Davis. Resolving tropical cyclone intensity in models.Geophysical Research Letters, 45(4):2082–2087,
-
[24]
Balaji, Jan-Huey Chen, Keith Dixon, and Xiaosong Yang
Gabriel Vecchi, Thomas Delworth, Hiroyuki Murakami, Seth Underwood, Andrew Wittenberg, Fanrong Zeng, Wei Zhang, Jane Baldwin, Kieran Bhatia, William Cooke, Jie He, Sarah Kapnick, Thomas Knutson, Gabriele Villarini, Karin van der Wiel, Whit Anderson, V . Balaji, Jan-Huey Chen, ...
2019 doi
-
[25]
K. P. Murphy.Machine Learning: A Probabilistic Perspective. MIT Press, 2012. 1195 pages
2012
-
[26]
Hastie, R
T. Hastie, R. Tibshirani, and J. Friedman.The Elements of Statistical Learning: Data Mining, Inference, and Prediction. Springer Series in Statistics. Springer, 2nd edition, 2017. 764 pages
2017
-
[27]
M. E. Fenner.Machine Learning with Python for Everyone. Additon Wesley Data and Analytics Series. Pearson Addison-Wesley, 2020. 556 pages
2020
-
[28]
Wimmers, C
A. Wimmers, C. Velden, and J. H. Cossuth. Using deep learning to estimate tropical cyclone intensity from satellite passive microwave imagery.Monthly Weather Review, 147:2261–2282, 2019
2019
-
[29]
Machine learning-based estimation of tropical cyclone intensity from advanced technology microwave sounder using a u-net algorithm
Zichao Liang, Yong-Keun Lee, Christopher Grassotti, Lin Lin, and Quanhua Liu. Machine learning-based estimation of tropical cyclone intensity from advanced technology microwave sounder using a u-net algorithm. Remote Sensing, 16(1):77, 2024. doi:10.3390/rs16010077. 20 arXivDL-...
2024 doi
-
[30]
Sungwook Hong, Hwa-Jeong Seo, and Young-Joo Kwon. A unique satellite-based sea surface wind speed algo- rithm and its application in tropical cyclone intensity analysis.Journal of Atmospheric and Oceanic Technology, 33(7):1363 – 1375, 2016. doi:10.1175/JTECH-D-15-0128.1. URL h...
2016 doi
-
[31]
B.-F. Chen, B. Chen, H. Lin, and R. L. Elsberry. Estimating tropical cyclone intensity by satellite imagery utilizing convolutional neural networks.Weather and Forecasting, 34:447–465, 2019
2019
-
[33]
Nwp-based deep learning for tropical cyclone intensity prediction,
Chanh Kieu, Khanh Luong, and Tri Nguyen. Nwp-based deep learning for tropical cyclone intensity prediction,
-
[34]
K. He, X. Zhang, S. Ren, and J. Sun. Deep residual learning for image recognition. InProceedings of the IEEE Conference on Computer Vision and Pattern Recognition (CVPR), pages 770–778, 2016
2016
-
[35]
Predicting tropical cyclone formation with deep learning.Weather and Forecasting, 39(1):241 – 258, 2024
Quan Nguyen and Chanh Kieu. Predicting tropical cyclone formation with deep learning.Weather and Forecasting, 39(1):241 – 258, 2024. doi:10.1175/WAF-D-23-0103.1. URL https://journals.ametsoc.org/view/ journals/wefo/39/1/WAF-D-23-0103.1.xml
2024 doi
-
[36]
Merra-2 frequently asked questions, 2024
NASA Global Modeling and Assimilation Office. Merra-2 frequently asked questions, 2024. Accessed on: YYYY-MM-DD
2024
-
[37]
K. R. Knapp, M. C. Kruk, D. H. Levinson, H. J. Diamond, and C. J. Neumann. The international best track archive for climate stewardship (ibtracs) unifying tropical cyclone data.Bull. Amer. Meteor. Soc., 91:363–376, 2010
2010
-
[38]
Binary dataset for machine learning applications to tropical cyclone formation prediction.Scientific Data, 11:446, 2024
Chanh Kieu and Quan Nguyen. Binary dataset for machine learning applications to tropical cyclone formation prediction.Scientific Data, 11:446, 2024. doi:10.1038/s41597-024-03281-5. URL https://doi.org/10.1038/ s41597-024-03281-5
2024 doi
-
[39]
A comprehensive survey of regression based loss functions for time series forecasting, 2022
Aryan Jadon, Avinash Patil, and Shruti Jadon. A comprehensive survey of regression based loss functions for time series forecasting, 2022
2022
-
[40]
K. A. Emanuel. An air-sea interaction theory for tropical cyclones. part i: Steady-state maintenance.J. Atmos. Sci., 43:585–605, 1986
1986
-
[41]
Hurricane maximum potential intensity equilibrium.Quarterly Journal of the Royal Meteo- rological Society, 141(692):2471–2480, 2015
Chanh Kieu. Hurricane maximum potential intensity equilibrium.Quarterly Journal of the Royal Meteo- rological Society, 141(692):2471–2480, 2015. doi:https://doi.org/10.1002/qj.2556. URL https://rmets. onlinelibrary.wiley.com/doi/abs/10.1002/qj.2556
2015 doi
-
[42]
Robeson, and Chanh Kieu
Madison Ferrara, Faith Groff, Zach Moon, Kushal Keshavamurthy, Scott M. Robeson, and Chanh Kieu. Large- scale control of the lower stratosphere on variability of tropical cyclone intensity.Geophysical Research Letters, 44(9):4313–4323, 2017. doi:https://doi.org/10.1002/2017GL0...
2017 doi
-
[43]
Stability of the tropical cyclone intensity equilibrium.Journal of the Atmospheric Sciences, 74(11):3591 – 3608, 2017
Chanh Kieu and Quan Wang. Stability of the tropical cyclone intensity equilibrium.Journal of the Atmospheric Sciences, 74(11):3591 – 3608, 2017. doi:10.1175/JAS-D-17-0028.1. URL https://journals.ametsoc.org/ view/journals/atsc/74/11/jas-d-17-0028.1.xml
2017 doi
-
[44]
A look at the relationship between the large-scale tropospheric static stability and the tropical cyclone maximum intensity.Journal of Climate, 33(3):959 – 975, 2020
Alexandria Downs and Chanh Kieu. A look at the relationship between the large-scale tropospheric static stability and the tropical cyclone maximum intensity.Journal of Climate, 33(3):959 – 975, 2020. doi:10.1175/JCLI-D-19- 0307.1. URLhttps://journals.ametsoc.org/view/journals/...
2020 doi
-
[45]
D. M. Gilford. pypi (v1.3): Tropical cyclone potential intensity calculations in python.Geoscientific Model Development, 14(5):2351–2369, 2021. doi:10.5194/gmd-14-2351-2021. URL https://gmd.copernicus.org/ articles/14/2351/2021/
2021 doi
-
[46]
Hon, and Liling Liu
Zijin Zhang, Xiaolong Dong, K.K. Hon, and Liling Liu. Tropical cyclone surface pressure field estimation using satellite passive microwave observations over the oceans.Journal of Geophysical Research: Oceans, 124 (11):7854–7872, 2019. doi:https://doi.org/10.1029/2019JC015136. ...
2019 doi
-
[47]
Courtney and J
J. Courtney and J. A. Knaff. Adapting the knaff and zehr wind-pressure relationship for operational use in tropical cyclone warning centres.Weather and Forecasting, 58:167–179, 2009
2009
-
[48]
Knaff and Raymond M
John A. Knaff and Raymond M. Zehr. Reexamination of Tropical Cyclone Wind–Pressure Relationships.Wea. Forecasting, 22(1):71–88, February 2007. ISSN 0882-8156. doi:10.1175/W AF965.1. 21 arXivDL-based Downscaling of Tropical Cyclone IntensityA PREPRINT
2007 doi
-
[49]
Kieu, Hua Chen, and Da-Lin Zhang
Chanh Q. Kieu, Hua Chen, and Da-Lin Zhang. An examination of the pressure–wind relationship for intense tropical cyclones.Weather and Forecasting, 25(3):895 – 907, 2010. doi:10.1175/2010WAF2222344.1. URL https://journals.ametsoc.org/view/journals/wefo/25/3/2010waf2222344_1.xml
2010 doi
-
[50]
R. D. Torn and C. Snyder. Uncertainty of tropical cyclone best-track information.Weather Forecasting, 27: 715–729, 2012. 22
2012
-
[2000]
doi:10.1175/1520-0493(2000)128<1139:ASAOTC>2.0.CO;2
2000 doi
-
[2001]
doi:10.1175/1520-0434(2001)016<0219:ATCGPF>2.0.CO;2
2001 doi
-
[2010]
doi:10.1155/2010/915303
2010 doi
-
[2018]
doi:https://doi.org/10.1002/2017GL076966
-
[2025]
URLhttps://arxiv.org/abs/2504.09143
Reviewed August 4, 2026 · model on record in the stance chip above.
Discussion (0). Sign in to comment.