REVIEW 4 major objections 6 minor 53 references
Mass composition of cosmic rays above 0.1 EeV by the Yakutsk array data
T0 review · 4 major / 6 minor · reviewed 2026-08-14 · deepseek-v4-flash
Pith's one-line read Yakutsk array data show the cosmic-ray mix swings from heavy to light to heavy across four decades.
desk verdict Valuable 40-year Yakutsk dataset with a plausible composition trend, but the fluctuation confirmation in Fig. 7(b) does not match the authors' own correction equations. read the letter →
The pith
A machine-rendered reading of the paper's core claim, the machinery that carries it, and where it could break.
The reading
What carries the argument
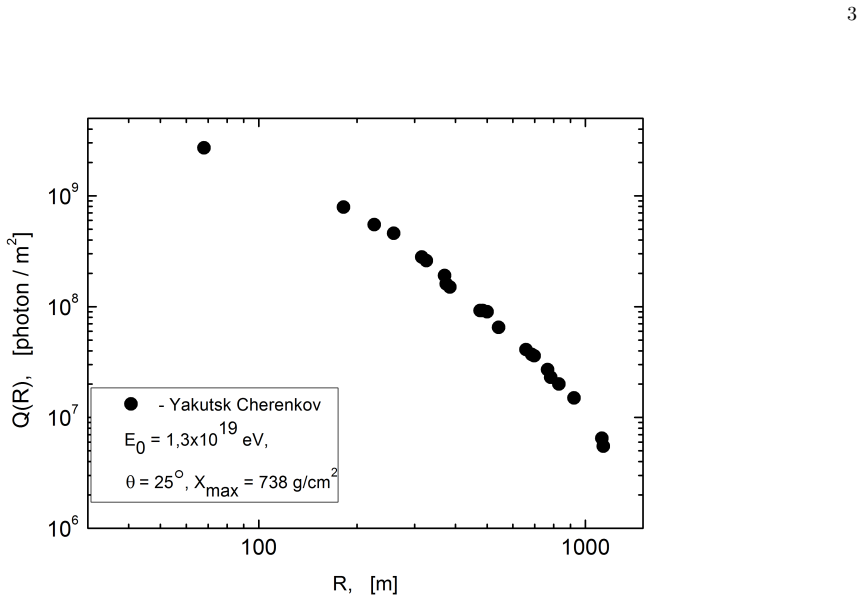
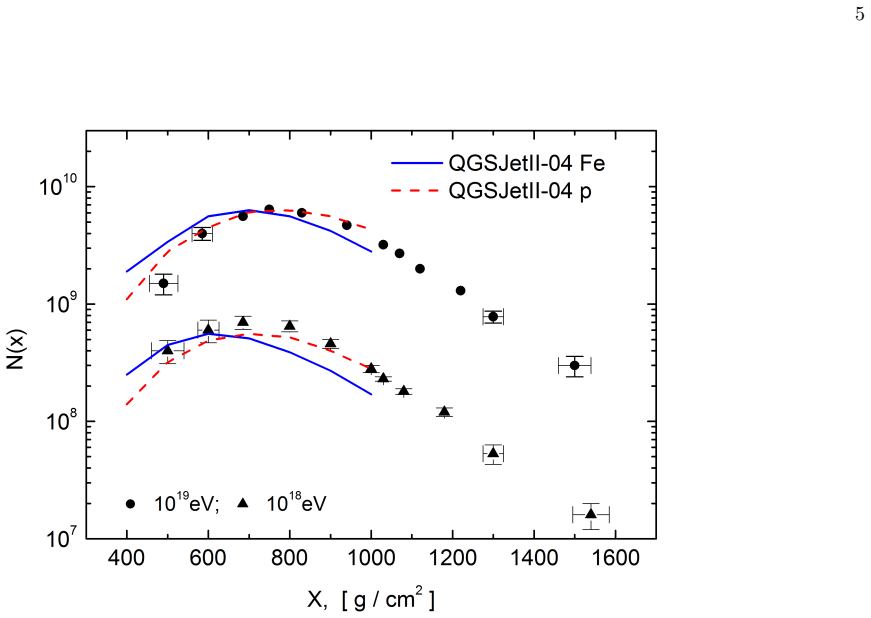
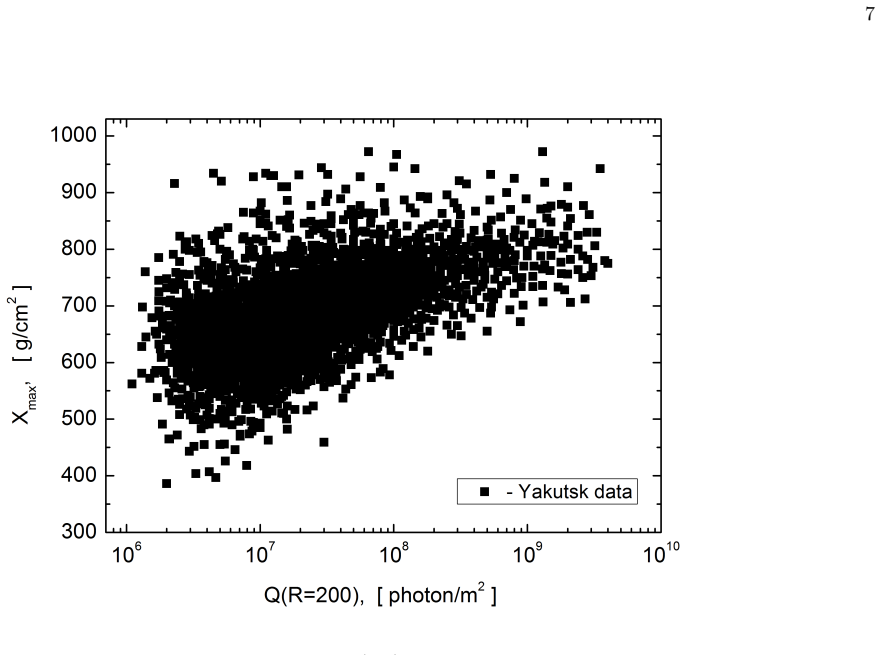
The central object is the depth of shower maximum $X_{\max}$, the atmospheric depth at which the number of shower particles is largest, reconstructed for individual showers from the lateral distribution of Cherenkov light. The reconstruction solves a Fredholm integral equation of the first kind with an adaptive method, folding in the electron lateral-angular distribution and measured atmospheric transmission. Shower energy is set by the Cherenkov light flux density at 200 m from the shower axis, and composition is extracted by interpolating the measured average $X_{\max}$ between the QGSJetII-04 predictions for proton and iron primaries. The fluctuation analysis subtracts a Monte Carlo-based instrumental-smearing correction from the measured spread of $X_{\max}$ to isolate the physical shower-to-shower fluctuations.
What would settle it
Recompute the physical spread of $X_{\max}$ from the same shower sample using a full Monte Carlo simulation of the Yakutsk array with realistic non-Gaussian measurement errors and event-by-event axis reconstruction, without the linear correction of Eq. (6); if the corrected spread no longer peaks near $2\times10^{17}$–$2\times10^{18}$ eV and declines above $5\times10^{18}$ eV, the fluctuation-based support for a mass-composition change collapses.
Extended reading notes
Core claim
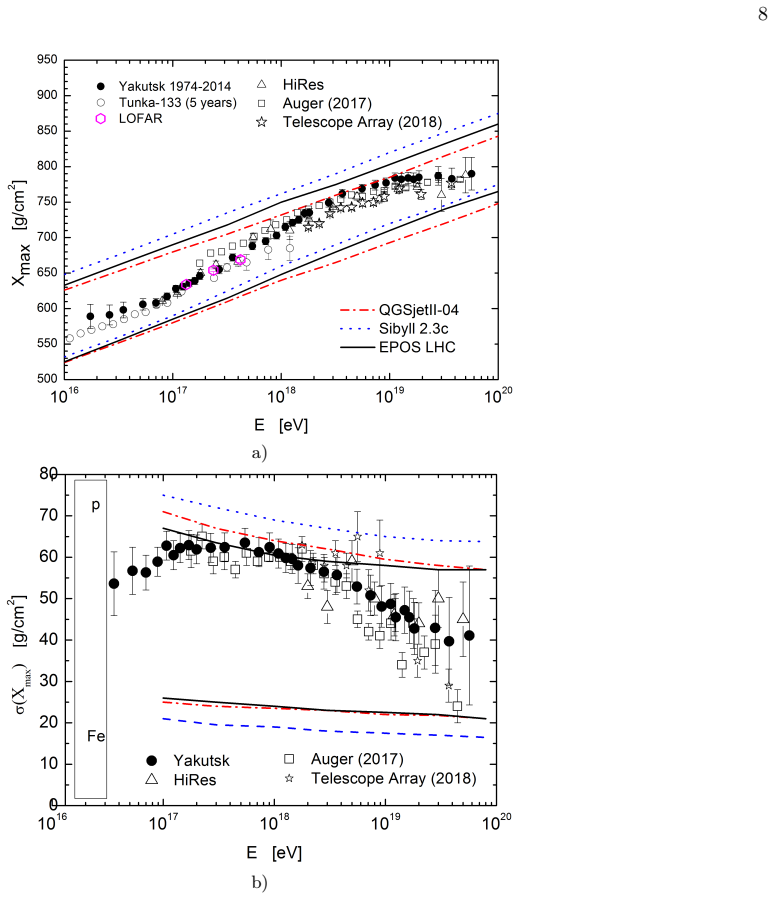
The central discovery is that the elongation rate $dX_{\max}/dE$ is nonlinear, with measured values $48\pm6$, $78\pm5$, $63\pm6$, and $50\pm7$ g/cm$^{2}$ per decade in the ranges $10^{16}$–$10^{17}$, $10^{17}$–$10^{18}$, $10^{18}$–$10^{19}$, and $10^{19}$–$10^{20}$ eV. The rate peaks near $10^{18}$ eV, and there are kinks in the $X_{\max}$ versus energy relation near the second knee at $\sim10^{17}$ eV and again near $5\times10^{18}$ eV. Fluctuations $\sigma(X_{\max})$ rise to 57–63 g/cm$^{2}$ between $2\times10^{17}$ and $2\times10^{18}$ eV and then fall to about 40 g/cm$^{2}$ above $2\times10^{19}$ eV. Using the QGSJetII-04 model to interpolate between proton and iron predictions, the paper derives a mean logarithmic mass $\langle\ln A\rangle$ of about 2.0–2.5 below $10^{17}$ eV, falling to near zero around $3.7\times10^{18}$ eV, then rising again to about 1.6 by $3.7\times10^{19}$ eV. The paper concludes that the mass composition of cosmic rays changes twice over the observed energy range: heavy at low energies, proton-dominated near $10^{18}$ eV, and heavy again at the highest energies.
Load-bearing premise
The claim that the fluctuation pattern confirms a composition change rests on the detector-smearing correction being right: if the correction subtracted from the measured spread is biased, the peak near $10^{17}$–$10^{18}$ eV and the drop above $5\times10^{18}$ eV could be artifacts, and the composition argument would lose its independent support.
Editorial extensions
If this is right
- If the nonlinear elongation rate is correct, the transition from Galactic to extragalactic cosmic rays near 0.1–1 EeV is not compositionally neutral: the mix becomes proton-dominated around $10^{17}$–$10^{18}$ eV before turning heavier.
- The breaks in the $X_{\max}$ versus energy relation place the second knee near $10^{17}$ eV and the beginning of the 'dip-bump' region near $5\times10^{18}$ eV in the composition, not only in the energy spectrum.
- Above $10^{19}$ eV the composition is not pure proton; helium, CNO, and iron-group nuclei make up a substantial fraction, which bears on where and how the highest-energy particles are accelerated.
- The fluctuation maximum near $10^{17}$–$10^{18}$ eV indicates a mixed composition with a strong proton and helium component, consistent with the mean-depth interpolation.
Reading between the lines
- Editorial inference: the rising-then-falling elongation rate the paper reports is a direct, energy-resolved constraint on hadronic interaction models; any model used to interpret air showers should reproduce a slope that peaks near $10^{18}$ eV without ad hoc energy-dependent tuning.
- Editorial inference: the same dataset could be re-analyzed with newer interaction models to test whether the inferred composition shifts are stable or partly a model artifact of QGSJetII-04.
- Editorial inference: the fluctuation peak near $2\times10^{17}$–$2\times10^{18}$ eV is a clean target for independent verification by other Cherenkov and radio air-shower arrays operating in that energy range; if they do not see the peak after detector corrections, the composition-change claim would need revision.
Signed reviews
Editorial analysis
A structured set of objections, weighed in public.
Referee Report
Summary. The paper reports Xmax measurements from 1974-2014 Yakutsk Cherenkov array data over 10^16 to 5.7×10^19 eV. It derives elongation rates of 48±6, 78±5, 63±6, and 50±7 g/cm^2 per decade in four energy intervals and interprets the non-monotonic elongation rate as evidence for a composition change from heavier nuclei at low energy to proton-rich at ~10^18 eV and back to heavier at the highest energies. The paper also computes <lnA> by interpolating measured <Xmax> between proton and iron endpoints from QGSJetII-04 simulations, and it claims that a maximum in Xmax fluctuations around 2×10^17-2×10^18 eV provides independent confirmation of the composition change. The central problem is that the fluctuation confirmation appears quantitatively inconsistent with the paper's own correction formulas and tabulated values.
Significance. The dataset is valuable: it covers four decades in energy with a single technique and is compared with Auger, TA, HiRes, Tunka, and LOFAR results. The elongation-rate measurement is an important anchor for the transition region, and the composition inference via QGSJetII-04 interpolation is a legitimate, model-dependent procedure rather than a circular fit. However, the claimed independent confirmation from fluctuations is not supported by the paper's own equations and tables, and the reported <lnA> values carry only statistical errors. If the fluctuation correction issue is resolved and systematic uncertainties are propagated, this could become a useful contribution; in its current form the central confirmation claim is not quantitatively reliable.
major comments (4)
- [II.C, Eq. (6)-(7), Tables II-III, Fig. 7(b)] The claimed maximum of physical fluctuations sigma(Xmax)=57-63 g/cm^2 in the range 2×10^17-2×10^18 eV is not what the paper's own correction produces. Applying Eq. (6) at E0=2.68×10^17 eV gives <sigma_app>=38.5-10*lg(0.268)=44.2 g/cm^2; with sigma_meas=62.3 g/cm^2 from Table II, Eq. (7) gives sigma_phys≈44 g/cm^2. At E0=1.09×10^18 eV, the corrected value is ≈47 g/cm^2. These corrected values are 43-49 g/cm^2 across the claimed peak, not 57-63 g/cm^2. The quoted 57-63 range matches the uncorrected sigma_meas column in Tables II-III. Thus either Fig. 7(b) plots raw measured fluctuations rather than physical ones, or the table definitions and Eq. (7) are inconsistent. Since the fluctuation maximum is presented as the independent confirmation of the composition change, this inconsistency is load-bearing and must be resolved.
- [II.C, below ~5×10^16 eV] The tabulated sigma_meas values at low energy (e.g., 53.6 g/cm^2 at 3.5×10^16 eV) are nearly equal to the instrumental width from Eq. (6) (≈53 g/cm^2 at that energy), so the quadrature-subtracted sigma_phys is ≈7 g/cm^2 with an uncertainty comparable to or larger than the value. The low-energy fluctuation data therefore cannot meaningfully constrain the physical intrinsic width, and the conclusion of a heavier composition at low energy cannot be supported by the fluctuation analysis there.
- [II.D, Eq. (8), Tables II-III] The reported <lnA> values include only the 'stat. error' column. The systematic uncertainties described in Section II.B — the 21% absolute calibration error, the 23-26% energy scale uncertainty, and the per-shower Xmax reconstruction uncertainty of 15-55 g/cm^2 — are not propagated into <lnA> or into the quoted composition fractions. Because the interpolation in Eq. (8) is nearly linear in Xmax, an unpropagated systematic of ~20 g/cm^2 in Xmax translates into a shift of order 0.5 in <lnA>, which is comparable to the bin-to-bin changes interpreted as composition changes. The authors should quote a systematic uncertainty on <lnA> or justify that the relative trend is unaffected.
- [III, Table III] The highest-energy elongation-rate value and the claim of a heavier composition above ~5×10^18 eV rest on very few events: the last two bins contain 7 and 3 events, with Xmax uncertainties of 15 and 23 g/cm^2, respectively. The derived <lnA> values at 3.74×10^19 and 5.69×10^19 eV (1.57±0.64 and 1.69±0.97) are consistent with a constant composition within about 1.5 sigma. The text should temper the high-energy conclusion or provide a sensitivity check with different binning.
minor comments (6)
- [References] Reference [53] has a stray double bracket in the text: '1994-2010 [53]]' should be corrected.
- [Table III header] The table header '10 18·5.7·1019 eV' is unformatted and should read '10^18 - 5.7×10^19 eV'.
- [Table III] The entry '0,64' in the last row uses a comma as the decimal separator; it should be '0.64' for consistency with the rest of the paper.
- [Throughout] The spelling of the hadronic model is inconsistent ('QGSJetII-04', 'QGSjetII-04', 'QGSjetII-03'); one standard spelling should be used throughout.
- [Section II.A] Figure 3 is not explicitly cited in the running text; a citation should be added where atmospheric transparency is discussed.
- [Section II.C] The uncertainties on the four elongation-rate values are given without stating how they were derived (fit method, correlated versus uncorrelated errors); a brief description would improve reproducibility.
Circularity Check
No significant circularity: the composition inference is a standard interpolation between external QGSJetII-04 p/Fe endpoints, and the fluctuation correction is calibrated on simulated detector response rather than on the target composition data. Heavy same-group citation is methodological, not definitionally circular.
full rationale
The paper's central derivations are not circular. The elongation rate is obtained directly from measured Xmax versus fitted energy ranges; the composition is then interpolated by Eq. (8) between proton and iron Xmax values from the external QGSJetII-04 model. This is a transformation of an independent measured quantity, not a fit whose output is forced by the assumed composition. The fluctuation analysis uses Eq. (6), an instrumental-width correction derived from Monte Carlo detector simulations (refs. [50,51]), and Eq. (7), a quadrature subtraction, to obtain physical fluctuations; the correction is calibrated on simulated detector response rather than on the composition being inferred. Numerous self-citations support the reconstruction and calibration methods ([7,8,10,17,32,50,51]), but the paper's claims do not reduce to those citations: the methods are stated assumptions with external checks, and the Xmax data are compared to Auger, TA, HiRes, Tunka, and LOFAR. No uniqueness theorem or ansatz is imported from the authors' prior work to force the chosen interpretation. However, a separate self-consistency issue is present: applying Eq. (6) and Eq. (7) to the tabulated sigma(Xmax) in Tables II and III gives corrected physical fluctuations of about 43-49 g/cm^2 in the claimed 2x10^17-2x10^18 eV peak region, whereas the text quotes 57-63 g/cm^2, a value matching the raw measured column rather than the detector-corrected result. This is a data-reduction consistency problem, not a circularity: the claimed confirmation does not reduce to the paper's own correction equations, and if anything it fails that check. The score of 2 reflects the heavy reliance on same-group calibration references and the need for the reader to trust those earlier works, not any definitional equivalence between input and output.
Assumptions & free parameters
free parameters (3)
- Energy conversion constants in Eq. (5) =
1.78e17 and 1.01
- Instrumental fluctuation correction coefficients in Eq. (6) =
38.5 +/- 5 g/cm^2 and 10 +/- 3 g/cm^2 per log10(E/1e18 eV)
- Energy balance coefficient k(x, P_lambda) in Eq. (3) =
Not quoted numerically in this paper
assumptions (4)
- domain assumption QGSJetII-04 predicts the average Xmax for proton and iron primaries used as interpolation endpoints.
- domain assumption The lateral-angular distribution G(R,X/X2) in Eq. (1) is known well enough to reconstruct Xmax from Cherenkov LDF.
- domain assumption The instrumental fluctuation correction computed from Monte Carlo with normal errors fully accounts for detector smearing.
- domain assumption A linear interpolation of Xmax in lnA between proton and iron (Eq. 8) is valid for mixed compositions.
Cite this review
Pith. "Pith review of Mass composition of cosmic rays above 0.1 EeV by the Yakutsk array data." pith.science (2026). https://pith.science/paper/YXJYEBNB
@misc{pith2026190801508,
  author       = {Pith},
  title        = {Pith review of: Mass composition of cosmic rays above 0.1 EeV by the Yakutsk array data},
  year         = {2026},
  howpublished = {\url{https://pith.science/paper/YXJYEBNB}},
  note         = {Machine review of arXiv:1908.01508}
}
abstract
The paper presents the results of the longitudinal development of extensive air showers (X$_{max}$) of ultra-high energies and mass composition of cosmic rays. The measurements of X$_{max}$ are based on data from observations of the Cherenkov radiation at the Yakutsk array for the period 1974-2014. The cascade curves of individual showers and the depth of maximum X$_{max}$ were reconstructed over the energy range 10$^{16}$-5.7$\cdot$10$^{19}$ eV. It is shown that the displacement rate of the parameter dX$_{max}$ / dE in the atmosphere is nonlinear and depends on the energy. Such a feature indicates a change in mass composition, which is confirmed by fluctuations of X$_{max}$ in this energy region. The composition of cosmic rays was determined by interpolation using the QGSJetII-04 model.
Figures


Figures from the paper (5 more)


Reference graph
Works this paper leans on
-
[1]
E. Berezhko, S. Knurenko, and L. Ksenofontov, Astroparticle Physics 36, 31 (2012)
work page 2012
-
[2]
Berezinsky, A
V. Berezinsky, A. Gazizov, and S. Grigorieva, Physical Review D 74, 043005 (2006)
2006
-
[3]
Greisen, Physical Review Letters 16, 748 (1966)
K. Greisen, Physical Review Letters 16, 748 (1966)
work page 1966
- [4]
-
[5]
Zrelov, Vavilov-Cherenkov radiation and its application in high-energy physics
V. Zrelov, Vavilov-Cherenkov radiation and its application in high-energy physics. Part 1 (Atom, Moscow, 1968)
work page 1968
-
[6]
Jelley, Cerenkov radiation and its applications (Pergamon Press, London, 1958)
J. Jelley, Cerenkov radiation and its applications (Pergamon Press, London, 1958)
work page 1958
-
[7]
S. Knurenko, V. Kolosov, and Z. Petrov, Proc. 27-th ICRC, Hamburg (Germany) 1, 157 (2001)
work page 2001
-
[8]
M. Dyakonov, S. Knurenko, V. Kolosov, and et al., Nuclear Instruments and Meth-s in Phys. Res. A 248, 224 (1986)
work page 1986
Show all 53 references
-
[9]
Tikhonov and V
A. Tikhonov and V. Arsenin, Solutions of Ill-Posed Problems (V. H. Winston & Sons, Washington, D.C.: John Wiley & Sons, New York, 1977)
1977
-
[10]
Knurenko, A
S. Knurenko, A. Ivanov, I. Sleptsov, and A. Sabourov, JETP Letters 83, 473 (2006)
2006
-
[11]
Ostapchenko, Phys
S. Ostapchenko, Phys. Rev. D 83, 014018 (2011)
2011
-
[12]
H¨ orandel, J
J. H¨ orandel, J. Phys.: Conf. Ser.47, 41 (2006)
2006
-
[13]
Artamonov, B
V. Artamonov, B. Afanasyev, A. Glushkov, and et al., Bulletin of RAoS. Physics 58, 98 (1994)
1994
-
[14]
Knurenko, Z
S. Knurenko, Z. Petrov, and I. Petrov, NIM A 866, 230 (2017)
2017
-
[15]
Knurenko, V
S. Knurenko, V. Kolosov, Z. Petrov, and et al., Sci. and Edu. 4, 46 (1998)
1998
-
[16]
Garipov, V
G. Garipov, V. Grigoryev, N. Efremov, and et al., Proc. 27th ICRC, Hamburg, Germany 2, 885 (2001)
2001
-
[17]
Ivanov, S
A. Ivanov, S. Knurenko, A. Krasilnikov, Z. Petrov, M. Pravdin, I. Sleptsov, and L. Timofeev, NIM A 772, 34 (2015)
2015
-
[18]
Egorov, Z
Y. Egorov, Z. Petrov, and S. Knurenko, Proc. of Science 301, 462 (2018)
2018
-
[19]
Dyakonov, S
M. Dyakonov, S. Knurenko, V. Kolosov, and et al., Atmos. Oceanic. Optics 12, 315 (1999)
1999
-
[20]
Zuev, Atmospheric transparency in the visible and the infrared (Israel Program for Scientific Translations, Jerusalem, 1970)
V. Zuev, Atmospheric transparency in the visible and the infrared (Israel Program for Scientific Translations, Jerusalem, 1970)
1970
-
[21]
Dyakonov, S
M. Dyakonov, S. Knurenko, V. Kolosov, and I. Sleptsov, Optics of atmosphere 4, 868 (1991)
1991
-
[22]
Knurenko, S
S. Knurenko, S. Nikolashkin, A. Saburov, and I. Sleptsov, Proc. SPIE 6522, 65221U (2006)
2006
-
[23]
Knurenko and I
S. Knurenko and I. Petrov, Proc. SPIE 9292, 92925B (2014)
2014
-
[24]
Kochnev, Proc
A. Kochnev, Proc. of ’Use of PC in control problems’. Krasnoyarsk (USSR) pp. 62–71 (1985)
1985
-
[25]
Belyaev, I
A. Belyaev, I. Ivanenko, B. Kanevsky, and et al., Electron-photon cascades in cosmic rays at ultra-high energies (Nauka, Moscow, 1980)
1980
-
[26]
Dyakonov, Moscow:INR AS USSR p
M. Dyakonov, Moscow:INR AS USSR p. 151 (1982)
1982
-
[27]
Hillas, Journal of Physics G: Nuclear and Particle Physics 8, 1461 (1982)
A. Hillas, Journal of Physics G: Nuclear and Particle Physics 8, 1461 (1982)
1982
-
[28]
Patterson and A
J. Patterson and A. Hillas, Journal of Physics G: Nuclear and Particle Physics 9, 1433 (1983)
1983
-
[29]
Giller, G
M. Giller, G. Wieczorek, A. Kacperczyk, and et al., Journal of Physics G: Nuclear and Particle Physics 30, 97 (2004)
2004
-
[30]
Nerling, J
F. Nerling, J. Bl¨ umer, R. Engel, and M. Risse, Astropart. Phys. 24, 421 (2006)
2006
-
[31]
Smialkowski and M
A. Smialkowski and M. Giller, The Astrophysical Journal 854, 48 (2018)
2018
-
[32]
Knurenko, Yakutsk: SB RAS p
S. Knurenko, Yakutsk: SB RAS p. 168 (2003)
2003
-
[33]
Guschin, Methods, instruments and results of the atmospheric spectral transparency measurements (Gidrometeoizdat, Leningrad, 1988)
G. Guschin, Methods, instruments and results of the atmospheric spectral transparency measurements (Gidrometeoizdat, Leningrad, 1988)
1988
-
[34]
Glushkov, M
A. Glushkov, M. Dyakonov, S. Knurenko, and et al., Bull. of RAS. Physics 57, 91 (1993)
1993
-
[35]
Knurenko, A
S. Knurenko, A. Ivanov, V. Kolosov, and et al., Intern. Jour. of Modern Physics A 20, 6897 (2005)
2005
-
[36]
Abbasi, M
R. Abbasi, M. Abe, T. Abu-Zayyad, and et al., The Astrophysical Journal 865, 74 (2018)
2018
-
[37]
Barbosa, F
H. Barbosa, F. Catalani, J. Chinellato, and C. Dobrigkeit, Astropart. Phys. 22, 159 (2004)
2004
-
[38]
Knurenko, I
S. Knurenko, I. Petrov, Z. Petrov, and I. Sleptsov, EPJ Web of Conferences 99, 04001 (2015)
2015
-
[39]
Ivanov, S
A. Ivanov, S. Knurenko, and I. Sleptsov, New Journal of Physics 11, 065008 (2009)
2009
-
[40]
Kalmykov, Physics of Atomic Nuclei 6, 1019 (1967)
N. Kalmykov, Physics of Atomic Nuclei 6, 1019 (1967)
1967
-
[41]
Knurenko and I
S. Knurenko and I. Petrov, JETP Lett. 107, 676 (2018)
2018
-
[42]
Bellido, A
J. Bellido, A. Aab, P. Abreu, and et al., Proc. of Science 301, 506 (2018)
2018
-
[43]
Abbasi, M
R. Abbasi, M. Abe, T. Abu-Zayyad, and et al., ApJ 858, 76 (2018)
2018
-
[44]
Abbasi, T
R. Abbasi, T. Abu-Zayyad, M. Al-Seady, and et al., Phys. Rev. Lett. 104, 199902 (2010)
2010
-
[45]
Ulrich and L
R. Ulrich and L. Cazon, Astropart. Phys. 38, 41 (2012)
2012
-
[46]
Prosin, S
V. Prosin, S. Berezhnev, N. Budnev, and et al., EPJ Web of Conferences 121, 03004 (2016)
2016
-
[47]
Buitink, A
S. Buitink, A. Cortanje, H. Falcke, and et al., Nature 531, 70 (2016)
2016
-
[48]
Riehn, R
F. Riehn, R. Engel, A. Fedynitch, T. Gaisser, and T. Stanev, Proc. of Science 236, 558 (2015)
2015
-
[49]
Pierog, I
T. Pierog, I. Karpenko, J. Katzy, E. Yatsenko, and K. Werner, Phys. Rev. C 92, 034906 (2015)
2015
-
[50]
Dyakonov, A
M. Dyakonov, A. Ivanov, and S. K. et al., Proc. of 17 ICRC. Paris (France) 6, 78 (1981)
1981
-
[51]
Dyakonov, A
M. Dyakonov, A. Ivanov, and S. K. et al., Electromagnetic cascade profiles and fluctuations of EAS lateral distribution (Yadernaya Fizika SB AS USSR, Yakutsk, 1983)
1983
-
[52]
Abbasi, M
R. Abbasi, M. Abe, T. Abu-Zayyad, and et al., Phys. Rev. D 99, 02002 (2019). 12
2019
-
[53]
Knurenko and A
S. Knurenko and A. Sabourov, Astrophys. Space Sci. Trans. 7, 251 (2011)
2011
Reviewed August 14, 2026 · model on record in the stance chip above.
Discussion (0). Continue with ORCID to comment.