REVIEW 5 major objections 6 minor 49 references
Investigating the emergent invariant properties of Hungarian electric distribution networks
T0 review · 5 major / 6 minor · reviewed 2026-08-07 · deepseek-v4-flash
Pith's one-line read Five Hungarian medium-voltage distribution networks, despite different geographies, show statistically consistent patterns across degree, betweenness centrality, and powerline length, with powerline lengths collapsing onto a single…
desk verdict A genuinely useful dataset and descriptive analysis, but the universality claim rests on a hand-picked rescaling exponent with no statistical validation; the paper needs revision before the strong conclusions are supportable. read the letter →
The pith
A machine-rendered reading of the paper's core claim, the machinery that carries it, and where it could break.
The reading
What carries the argument
The load-bearing tool is the universal scaling function $F(\cdot)$ from Strano et al.'s global road network study, applied here to powerline lengths. The collapse is shown by plotting $L^\gamma P(L)$ against $L/\langle L\rangle^\alpha$, with $\gamma=1/(2-\alpha)$ chosen to enforce normalization; the paper finds $\alpha=1.4$. This rescaling test is what turns five separate empirical distributions into evidence for a single universality class. Supporting machinery includes the GIS repair of the vector network data, primal-graph construction, Spearman rank correlations linking demography and topology, and spatial mapping of betweenness-centrality peaks.
What would settle it
A decisive test is to fit the five networks' powerline-length data without imposing the constraint $\gamma=1/(2-\alpha)$: if the exponents that best describe each network differ substantially, the single-curve collapse is an artifact of the rescaling choice rather than a genuine invariant.
Extended reading notes
Core claim
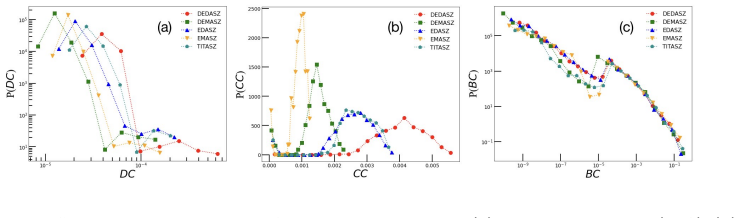
The paper's central claim is that the five Hungarian MV networks, despite differences in population density, settlement structure, and terrain, exhibit invariant statistical properties. Powerline length distributions are unimodal and fat-tailed, and they collapse under the universal scaling function introduced for road networks, with nontrivial exponents $\alpha=1.4$ and $\gamma\approx 1.67$. Degree centrality follows a lognormal distribution, closeness centrality is approximately normal, and betweenness centrality follows a truncated power law consistent with random planar graphs. The paper interprets the collapse as evidence that universal principles\u2014hierarchical structure, shared design goals, and common scalability\u2014govern the structural organization of MV distribution networks.
Load-bearing premise
The argument stands on the assumption that the scaling collapse formula developed for road-network lengths also applies to medium-voltage powerline lengths because roads and power lines are built along shared corridors under similar optimization pressures.
Editorial extensions
If this is right
- If the universality holds, one Hungarian MV network can serve as a modeling proxy for others with similar radial design, reducing data needs.
- Planning standards could be standardized across regions because common structural patterns imply common design constraints.
- Vulnerability and expansion behavior could be estimated in data-poor regions by transferring statistical laws measured elsewhere.
- Shared structural features may correspond to shared failure modes, allowing utilities to anticipate where faults are likely.
Reading between the lines
- A testable extension is whether the same $\alpha\approx 1.4$, $\gamma\approx 1.67$ exponents appear in MV networks outside Hungary; if they do, the universality claim moves from national to international scale.
- The reliance on the road-network scaling ansatz implies that if powerline planning economics differ from road building (for example, due to voltage-drop constraints), the collapse might be a property of the rescaling rather than a genuine invariant\u2014a risk the paper does not resolve.
- One could use the collapsed distribution as a generative prior to synthesize realistic MV network topologies for resilience simulation, a step the paper does not take.
Editorial analysis
A structured set of objections, weighed in public.
Referee Report
Summary. The paper characterizes five Hungarian medium-voltage (MV) distribution networks (DEDASZ, DEMASZ, EDASZ, EMASZ, TITASZ) using GIS-repaired vector data, complex network metrics, and demographic/land-cover information. It reports metrical and topological properties (Tables 1–3), a Spearman correlation analysis between demographics and network structure (Figure 2), and probability distributions for population, land area, powerline length, degree centrality, closeness centrality, and betweenness centrality (Figures 3–5). The central claim is that, despite regional differences, the five networks exhibit statistically consistent structural patterns, and that the powerline length distributions collapse under a universal scaling function with exponents α = 1.4 and γ ≈ 1.67, suggesting common design principles and potentially universal behavior in MV network architecture.
Significance. If the universal scaling and invariant distribution claims were rigorously established, the work would be a valuable contribution to spatial network theory and infrastructure planning, offering quantitative support for cross-network modeling and transferability of insights among distribution grids. The paper's strengths are its newly repaired and previously unstudied dataset of five real DSO networks, its careful compilation of metrical and reliability metrics, and its explicit scaling ansatz with quantitative exponents, which constitutes a falsifiable prediction that could be tested on MV networks in other countries. However, at present the main evidence is visual curve inspection and a correlation matrix based on only five data points, with no statistical validation. The significance is therefore more hypothesis-generating than demonstrative.
major comments (5)
- [Section 3.1, Figure 4(c)] The universal scaling collapse is produced by manually fixing α = 1.4 and γ = 1/(2−α) ≈ 1.67, with no search over α, no collapse-quality metric, no null model, and no goodness-of-fit test. The figure caption itself concedes 'a noticeable deviation of the DEMASZ network in the short-to-mid length region.' Because the central claim of universal behavior rests on this collapse, the evidence as presented could arise from the freedom to tune α and γ rather than from a true invariant. In addition, the normalization condition γ = 1/(2−α) is stated without derivation, and the transfer of the Strano et al. ansatz from road networks to powerline networks is asserted on the basis of similarity rather than validated.
- [Section 3.1, Figure 3(a)-(b)] The population distribution is claimed to follow a power law with exponent '~ −2.0(0)', but no fitting procedure, uncertainty interval, or goodness-of-fit test is reported, and the notation is ambiguous. Similarly, the claims that land area and powerline length distributions are lognormal (Figures 3(c)-(d) and 4) are not supported by any distribution-fitting diagnostic or comparison against alternative models. These assertions underlie the 'statistically consistent patterns' claim in the abstract and conclusion, so they need quantitative backing.
- [Section 3.1, Figure 5] The cross-network comparisons of degree, closeness, and betweenness centrality distributions are made by visual inspection. No statistical tests (e.g., two-sample Kolmogorov-Smirnov tests for distributional equality, or goodness-of-fit tests for the claimed lognormal and truncated power-law forms) are reported. The conclusion that these networks share 'statistically consistent patterns' in centrality metrics is therefore not established.
- [Section 3, Figure 2] The Spearman correlation matrix is computed from only five networks (five data points), which yields very uncertain correlation estimates. The paper does not report significance levels, confidence intervals, or a permutation-based null; several statements in the text (e.g., that the number of microvillages is more influential than total population on network structure) are drawn from this matrix. With n = 5, these correlations are not robust and should be treated as exploratory only.
- [Introduction and Abstract] The five networks are all within Hungary, share the same national regulatory and planning context, and serve regions of 'similar size and population density.' The abstract's 'hypothesis of universal behavior' and the introduction's claim that such universality 'enables simplified modeling and generalization, allowing insights from one network to be applied to others' go beyond what a five-network, single-country sample can support. Either the claims should be reframed as specific to Hungarian MV networks, or the paper should provide a basis for expecting universality across different regulatory regimes (e.g., comparison with networks from other countries).
minor comments (6)
- [Throughout] The text contains several typos, e.g., 'three-folds' should be 'threefold' (Section 1) and 'shortes' should be 'shortest' (Section 3, EMASZ paragraph).
- [Abstract] The acronym BC is used in the Abstract without definition; it is defined only in Section 2.2.3. Please define it at first use.
- [Figure 2] The correlation values and significance indicators are not legible in the preprint; adding the numerical values and p-values (or an explicit note on their absence) would help the reader assess the claims.
- [Equations (1) and Section 3.1] The symbol α is used for the adjacency matrix in Equation (1) and for the scaling exponent in Section 3.1; this reuse of the same symbol for different quantities is confusing and should be resolved.
- [Section 2.2.1] The definition of powerline length L = Σ_l L_l uses ℓ both as an index and as a length symbol; please clarify the notation.
- [References] Reference [13] is an unreviewed preprint; if a published version exists, it should be cited in its place.
Circularity Check
The universal-scaling claim rests on a manually chosen collapse exponent α=1.4, so the reported universal exponents are fitted parameters presented as predicted invariants.
-
fitted input called prediction
[Section 3.1 (Invariant Statistical Properties), Figure 4(c) and the paragraph following it]
"we employ the universal scaling function F (·) which can be obtained by plotting Lγ · P (L) with L/ ⟨L⟩α, where γ = 1/(2 − α) ensures normalization ... In Figure 4(c), we utilized the case of α = 1.4 (and, thus, γ ∼ 1.67), which resulted in all the distributions collapsing under a single curve. This time, we can still observe a scaling law but with non-trivial exponents."
α is not derived from theory or measured independently; it is selected as the value that makes the five powerline-length distributions overlap, and γ is fixed by the stated normalization condition γ = 1/(2 − α). The collapse in Figure 4(c) is therefore produced by the chosen α, not independently confirmed. The paper then reports α = 1.4 and γ ≈ 1.67 as 'non-trivial exponents' and as evidence that universal principles govern the structural properties of these networks. With no search over α, no collapse-quality metric, and no uncertainty on the exponents, the claimed universal scaling law reduces to a fitted parameter presented as a discovered invariant.
full rationale
The only load-bearing step that reduces to its own input is the universal-scaling collapse in Section 3.1 / Figure 4(c). The paper selects α = 1.4 to make the five powerline-length distributions collapse and fixes γ through the normalization condition, then presents the resulting collapse and exponents as evidence of 'universal principles.' Since the collapse is produced by the chosen α, without an independent derivation, a systematic search, a collapse-quality metric, or uncertainty estimates, the claimed universal exponents are fitted values rather than predicted invariants. This is the fitted-input-called-prediction pattern and it affects the central claim of universal behavior. The other analyses—degree, closeness, and betweenness distributions, Spearman correlations, and the comparison to random planar graphs—are descriptive and not circular by themselves. The self-citation [13] is used only as background motivation for the bimodal BC pattern and is not load-bearing for the universality claim, so it does not raise the score further. The absence of statistical tests for the collapse and for distributional equality across the five networks is a validation gap, not circularity per se.
Assumptions & free parameters
free parameters (2)
- alpha (powerline length rescaling exponent) =
1.4
- population distribution power-law exponent =
~ -2.0
assumptions (5)
- domain assumption The repaired GIS vector data faithfully represents the real MV network topology; the automated repair and manual back-check introduced no systematic distortion.
- domain assumption Strano et al.'s universal scaling function for road length distributions applies to MV powerline length distributions because roads and powerlines are co-located and share design principles.
- ad hoc to paper A data collapse obtained by manually choosing alpha=1.4 identifies a true universality class rather than an artifact of rescaling.
- domain assumption Five DSO networks in one country are enough to infer universal structural tendencies in MV network design.
- domain assumption Spearman correlations on n=5 networks meaningfully rank the influence of population, density, and microvillages on network structure.
Cite this review
Pith. "Pith review of Investigating the emergent invariant properties of Hungarian electric distribution networks." pith.science (2026). https://pith.science/paper/Z7JTPBOX
@misc{pith2026250604009,
  author       = {Pith},
  title        = {Pith review of: Investigating the emergent invariant properties of Hungarian electric distribution networks},
  year         = {2026},
  howpublished = {\url{https://pith.science/paper/Z7JTPBOX}},
  note         = {Machine review of arXiv:2506.04009}
}
read the original abstract
Electric power distribution networks serve as the final and essential stage in power delivery, bridging transmission infrastructure and end users. The structural configuration of these networks plays a critical role in determining system reliability, fault tolerance, and operational efficiency. Although the design of distribution systems is influenced by various regional factors, such as geography, customer density, and planning standards, the extent to which consistent structural characteristics emerge across different networks remains an open question. In this study, we perform a detailed spatial and topological analysis of five MV distribution networks in Hungary. Despite notable differences in geographic layout and consumer distribution, we identify statistically consistent patterns across several key metrics, including degree, BC, and powerline length. These findings suggest the influence of common underlying design principles or optimization constraints, potentially indicating universal structural tendencies in MV network design. The results provide insight into the organization of real-world distribution systems and offer a basis for improved planning, risk mitigation, and system optimization in future grid developments.
Figures


Figures from the paper (4 more)



Reference graph
Works this paper leans on
-
[1]
Barthelemy, Spatial networks, 2022nd Edition, Springer Nature, Cham, Switzerland, 2022
M. Barthelemy, Spatial networks, 2022nd Edition, Springer Nature, Cham, Switzerland, 2022
work page 2022
-
[2]
S. Guillier, V. Muñoz, J. Rogan, R. Zarama, J. Valdivia, Optimization of spatial complex networks, Physica A: Statistical Mechanics and its Applications 467 (2017) 465–473.doi:10.1016/j.physa.2016.09.011. URL http://dx.doi.org/10.1016/j.physa.2016.09.011
-
[3]
G. Bolukbasi, A. S. Kocaman, A prize collecting steiner tree approach to least cost evaluation of grid and off-grid electrification systems, Energy 160 (2018) 536–543. doi:10.1016/j.energy.2018.07.029. URL http://dx.doi.org/10.1016/j.energy.2018.07.029
-
[4]
I. Morer, A. Cardillo, A. Díaz-Guilera, L. Prignano, S. Lozano, Com- paring spatial networks: A one-size-fits-all efficiency-driven approach, Physical Review E 101 (4) (Apr. 2020).doi:10.1103/physreve.101. 042301. URL http://dx.doi.org/10.1103/PhysRevE.101.042301
-
[5]
J. R. Banavar, F. Colaiori, A. Flammini, A. Maritan, A. Rinaldo, Topology of the fittest transportation network, Physical Review Let- ters 84 (20) (2000) 4745–4748.doi:10.1103/physrevlett.84.4745. URL http://dx.doi.org/10.1103/PhysRevLett.84.4745
-
[6]
C. Chekuri, A. Gupta, A. Kumar, J. Naor, D. Raz, Building edge-failure resilient networks, Algorithmica 43 (1–2) (2005) 17–41.doi:10.1007/ s00453-005-1156-z. URL http://dx.doi.org/10.1007/s00453-005-1156-z
-
[7]
E. Katifori, G. J. Szöllősi, M. O. Magnasco, Damage and fluctuations induce loops in optimal transport networks, Physical Review Letters 104 (4) (Jan. 2010).doi:10.1103/physrevlett.104.048704. URL http://dx.doi.org/10.1103/PhysRevLett.104.048704
-
[8]
M. E. Baran, F. F. Wu, Network reconfiguration in distribution systems for loss reduction and load balancing, IEEE Transactions on Power de- livery 4 (2) (1989) 1401–1407. 25
work page 1989
Show all 49 references
-
[9]
Abeysinghe, J
S. Abeysinghe, J. Wu, M. Sooriyabandara, M. Abeysekera, T. Xu, C. Wang, Topological properties of medium voltage electricity distri- bution networks, Applied energy 210 (2018) 1101–1112
2018
-
[10]
Hines, S
P. Hines, S. Blumsack, E. C. Sanchez, C. Barrows, The topological and electrical structure of power grids, in: 2010 43rd Hawaii International Conference on System Sciences, IEEE, 2010, pp. 1–10
2010
-
[11]
Kaiser, H
F. Kaiser, H. Ronellenfitsch, D. Witthaut, Discontinuous transition to loop formation in optimal supply networks, Nature Communications 11 (1) (Nov. 2020).doi:10.1038/s41467-020-19567-2. URL http://dx.doi.org/10.1038/s41467-020-19567-2
2020 doi
-
[12]
R. Louf, P. Jensen, M. Barthelemy, Emergence of hierarchy in cost- driven growth of spatial networks, Proceedings of the National Academy of Sciences 110(22) (2013) 8824–8829.doi:10.1073/pnas.1222441110. URL http://dx.doi.org/10.1073/pnas.1222441110
2013 doi
- [13]
-
[14]
Kirkley, H
A. Kirkley, H. Barbosa, M. Barthelemy, G. Ghoshal, From the between- ness centrality in street networks to structural invariants in random planar graphs, Nature communications 9 (1) (2018) 2501
2018
-
[15]
Nayeripour, N
M. Nayeripour, N. Rezaee, A. Roosta, T. Niknam, Role of gis in dis- tribution power systems, World Applied Sciences Journal 8 (5) (2010) 614–621
2010
-
[16]
Abdulrahman, G
I. Abdulrahman, G. Radman, Power system spatial analysis and visual- ization using geographic information system (gis), Spatial Information Research 28 (1) (2020) 101–112
2020
-
[17]
Y. Xu, T. Yu, B. Yang, Reliability assessment of distribution networks through graph theory, topology similarity and statistical analysis, IET Generation, Transmission & Distribution 13 (1) (2019) 37–45. 26
2019
-
[18]
Z. Wang, A. Scaglione, R. J. Thomas, Electrical centrality measures for electric power grid vulnerability analysis, in: 49th IEEE conference on decision and control (CDC), IEEE, 2010, pp. 5792–5797
2010
-
[19]
Dwivedi, S
D. Dwivedi, S. B. Mitikiri, K. V. S. M. Babu, P. K. Yemula, V. L. Srinivas, P. Chakraborty, M. Pal, Technological advancements and in- novations in enhancing resilience of electrical distribution systems, In- ternational Journal of Critical Infrastructure Protection (2024) 100696
2024
-
[20]
B. Fan, N. Shu, Z. Li, F. Li, Critical nodes identification for power grid based on electrical topology and power flow distribution, IEEE Systems Journal 17 (3) (2022) 4874–4884
2022
-
[21]
L. Chen, D. Yue, C. Dou, J. Chen, Z. Cheng, Evaluation of cyber- physical power systems in cascading failure: node vulnerability and sys- tems connectivity, IET Generation, Transmission & Distribution 14 (7) (2020) 1197–1206
2020
-
[22]
G. Wu, B. Chen, X. Li, H. Zheng, X. Pan, Reliability calculation method for power distribution networks based on topological similarity, in: 2024 IEEE 7th International Conference on Information Systems and Com- puter Aided Education (ICISCAE), IEEE, 2024, pp. 571–575
2024
-
[23]
Corine Land Cover 2018 (Vector), Europe, 6-yearly - Version 2020_20u1, May 2020 (2019)
European Environment Agency. Corine Land Cover 2018 (Vector), Europe, 6-yearly - Version 2020_20u1, May 2020 (2019). doi:10.2909/71C95A07-E296-44FC-B22B-415F42ACFDF0. https://sdi.eea.europa.eu/catalogue/copernicus/api/records/ 71c95a07-e296-44fc-b22b-415f42acfdf0?language=all
2019 doi
-
[24]
MTA FKI, Magyarország földrajzi kistájbeosztása (MTA FKI) – GIS | MÉTA Program,https://novenyzetiterkep.hu/node/407, [Accessed 17-05-2025] (2023)
2023
-
[25]
Hungarian Central Statistical Office, Ksh statinfo v40 | theme selection, https://statinfo.ksh.hu/Statinfo/themeSelector.jsp? &lang=en, [Accessed 17-05-2025] (2023)
2023
-
[26]
Jordan, Kocsis, k., kovács, z., nemerkényi, zs., gercsák, g., kincses, á
P. Jordan, Kocsis, k., kovács, z., nemerkényi, zs., gercsák, g., kincses, á. and tóth, g.(eds.): National atlas of hungary vol. 3: Society, Hungarian Geographical Bulletin 70 (4) (2021) 381–383. 27
2021
-
[27]
Prakash, A
K. Prakash, A. Lallu, F. Islam, K. A. Mamun, Review of power sys- tem distribution network architecture, in: 2016 3rd Asia-Pacific World Congress on Computer Science and Engineering (APWC on CSE), IEEE, 2016, pp. 124–130
2016
-
[28]
Hungarian Energy and Public Utility Regulatory Authority, Eval- uation of the Reliability of Distribution Supply 2023, https:// mekh.hu/download/1/12/81000/Elosztoi-ellatas-megbizhatosag_ ertekeles_2023_vegleges.pdf, accessed: 2025-05-12 (2023)
2023
-
[29]
T. Xu, T. Wang, C. Ye, J. Zhang, P. Xi, Y. Chen, G. Zhang, Research of electric cable path planning based on heuristic optimization algorithm in mixed-land scenario, Energy Engineering 120 (11) (2023) 2629–2650. doi:10.32604/ee.2023.027537. URL http://dx.doi.org/10.32604/ee.20...
2023
-
[30]
L. Rüde, M. Wussow, M. Heleno, G. Gust, D. Neumann, Estimating electrical distribution network length and capital investment needs from real-world topologies and land cover data, Energy Policy 195 (2024) 114368. doi:10.1016/j.enpol.2024.114368. URL http://dx.doi.org/10.1016/j....
2024
-
[31]
Mehrtash, A
M. Mehrtash, A. Kargarian, A. J. Conejo, Graph-based second-order coneprogrammingmodelforresilientfeederroutingusinggisdata, IEEE Transactions on Power Delivery 35 (4) (2020) 1999–2010.doi:10.1109/ tpwrd.2019.2959229. URL http://dx.doi.org/10.1109/TPWRD.2019.2959229
2020
-
[32]
L. B. Techane, A. O. Salau, Y. W. Gebru, E. A. Hailu, Geographical information system based optimal path routing of distribution networks, Heliyon 8 (5) (2022) e09397.doi:10.1016/j.heliyon.2022.e09397. URL http://dx.doi.org/10.1016/j.heliyon.2022.e09397
2022 doi
-
[33]
Ameling, G
J. Ameling, G. Gust, Automated feeder routing for underground elec- tricity distribution networks based on aerial images, European Journal of Operational Research 318 (2) (2024) 629–641.doi:10.1016/j.ejor. 2024.05.035. URL http://dx.doi.org/10.1016/j.ejor.2024.05.035 28
2024 doi
-
[34]
Gebhard, A
T. Gebhard, A. Tundis, F. Steinke, Automated generation of urban medium-voltage grids using openstreetmap data, in: 2024 IEEE PES Innovative Smart Grid Technologies Europe (ISGT EUROPE), 2024, pp. 1–5. doi:10.1109/ISGTEUROPE62998.2024.10863461
2024
-
[35]
Hartmann, T
B. Hartmann, T. Soha, Topological and topographical network data of the South Transdanubian medium-voltage distribution network in Hun- gary between 1950–1965, https://hdl.handle.net/21.15109/ARP/ JXPLE8, [Accessed 17-05-2025] (2024)
2024
-
[36]
M. T. Cirunay, R. Batac, Spatial signatures of road network growth for different levels of global planning, Complex Systems 30 (3) (2021)
2021
-
[37]
M. T. Cirunay, R. C. Batac, Statistical signatures of the spatial imprints of road network growth, International Journal of Modern Physics C 29 (10) (2018) 1850099
2018
-
[38]
Lämmer, B
S. Lämmer, B. Gehlsen, D. Helbing, Scaling laws in the spatial struc- ture of urban road networks, Physica A: Statistical Mechanics and its Applications 363 (1) (2006) 89–95
2006
-
[39]
Barthélemy, A
M. Barthélemy, A. Flammini, Modeling urban street patterns, Physical review letters 100 (13) (2008) 138702
2008
-
[40]
Strano, A
E. Strano, A. Giometto, S. Shai, E. Bertuzzo, P. J. Mucha, A. Rinaldo, The scaling structure of the global road network, Royal Society open science 4 (10) (2017) 170590
2017
-
[41]
S. M. Bhattacharjee, F. Seno, A measure of datacollapse for scaling, Journal of Physics A: Mathematical and General 34 (33) (2001) 6375
2001
-
[42]
Arderne, C
C. Arderne, C. Zorn, C. Nicolas, E. Koks, Predictive mapping of the global power system using open data, Scientific data 7 (1) (2020) 19
2020
-
[43]
Sadhu, K
K. Sadhu, K. Haghshenas, M. Rouhani, M. Aiello, Optimal joint oper- ation of coupled transportation and power distribution urban networks, Energy Informatics 5 (1) (2022) 35
2022
-
[44]
Crawford, S
D. Crawford, S. Holt, A mathematical optimization technique for locat- ing and sizing distribution substations, and deriving their optimal ser- vice areas, IEEE Transactions on Power Apparatus and Systems 94 (2) (1975) 230–235. doi:10.1109/T-PAS.1975.31846. 29
1975
-
[45]
D. Sun, D. Farris, P. Cote, R. Shoults, M. Chen, Optimal distribution substation and primary feeder planning via the fixed charge network formulation, IEEE Transactions on Power Apparatus and Systems PAS- 101 (3) (1982) 602–609.doi:10.1109/tpas.1982.317273. URL http://dx.doi.o...
1982
-
[46]
Diaz-Dorado, J
E. Diaz-Dorado, J. Cidras, E. Miguez, Application of evolutionary al- gorithms for the planning of urban distribution networks of medium voltage, IEEE Transactions on Power Systems 17 (3) (2002) 879–884. doi:10.1109/TPWRS.2002.800975
2002
-
[47]
Gomez, H
J. Gomez, H. Khodr, P. De Oliveira, L. Ocque, J. Yusta, R. Villasana, A. Urdaneta, Ant colony system algorithm for the planning of primary distribution circuits, IEEE Transactions on Power Systems 19 (2) (2004) 996–1004. doi:10.1109/TPWRS.2004.825867
2004
-
[48]
Ramirez-Rosado, J
I. Ramirez-Rosado, J. A. Dominguez-Navarro, New multiobjective tabu search algorithm for fuzzy optimal planning of power distribution sys- tems, IEEE Transactions on Power Systems 21 (1) (2006) 224–233. doi:10.1109/TPWRS.2005.860946
2006
-
[49]
Mendoza, J
F. Mendoza, J. Bernal-Agustin, J. Dominguez-Navarro, Nsga and spea applied to multiobjective design of power distribution systems, IEEE Transactions on Power Systems 21 (4) (2006) 1938–1945.doi:10.1109/ TPWRS.2006.882469. Acknowledgements Bálint Hartmann acknowledges the suppo...
2006
Reviewed August 7, 2026 · model on record in the stance chip above.
Discussion (0). Sign in to comment.