REVIEW 4 major objections 3 minor 1 cited by
A positive correlation between broad HI Ly$\alpha$ absorptions and local overdensities of galaxies
T0 review · 4 major / 3 minor · reviewed 2026-08-16 · deepseek-v4-flash
Pith's one-line read Broad Lyα absorbers along one quasar sightline preferentially sit at redshifts with excess galaxies, and absorber column density rises with the strength of that excess—evidence that warm-hot gas occupies the deep potential wells of cosmic…
desk verdict A plausible but fragile new result: BLA column densities correlate with galaxy overdensities on one sightline, yet the quoted significance omits the dominant uncertainties in the overdensity axis. read the letter →
The pith
A machine-rendered reading of the paper's core claim, the machinery that carries it, and where it could break.
The reading
What carries the argument
The central object is the broad Lyα absorber, an H I Lyman-$\alpha$ absorption line with Doppler parameter b>40 km/s, thermally broadened by gas at roughly $10^{5}$ K or hotter. The argument's mechanism is the comparison between gas properties derived from those absorbers and a completeness-corrected galaxy overdensity ratio, defined as the number of galaxies observed at the absorber redshift divided by the number expected from a halo mass function. Observed galaxy counts are corrected for two observational losses by dividing by a redshift-success factor of 0.84 and a target-recovery factor of 0.27, and the expected counts are set by integrating the halo mass function above a mass threshold fixed by the r≈22.5 magnitude limit through a stellar-to-halo mass relation. The correlation of column density with this overdensity ratio, and its decay toward larger velocity windows and impact parameters, is what carries the filament interpretation.
What would settle it
Recompute the found-to-expected galaxy ratio at each BLA redshift using a galaxy survey complete to r≈23–24 mag in the same field, so no recovery-factor correction is needed, and rerun the Spearman correlation against inferred hydrogen column density: if the correlation drops to zero or changes sign, the completeness correction is the cause; if it survives, the correction is validated.
Extended reading notes
Core claim
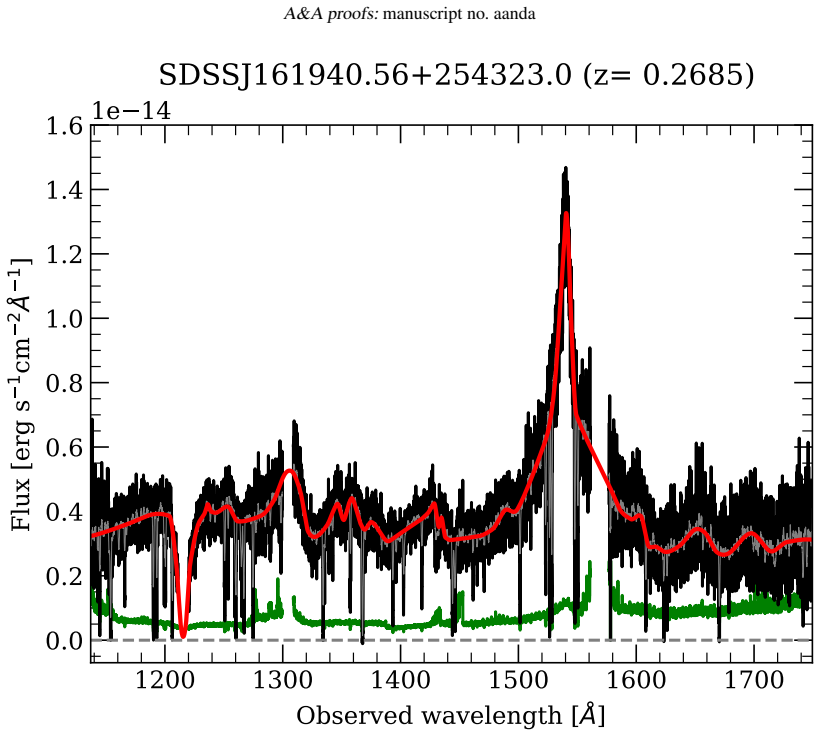
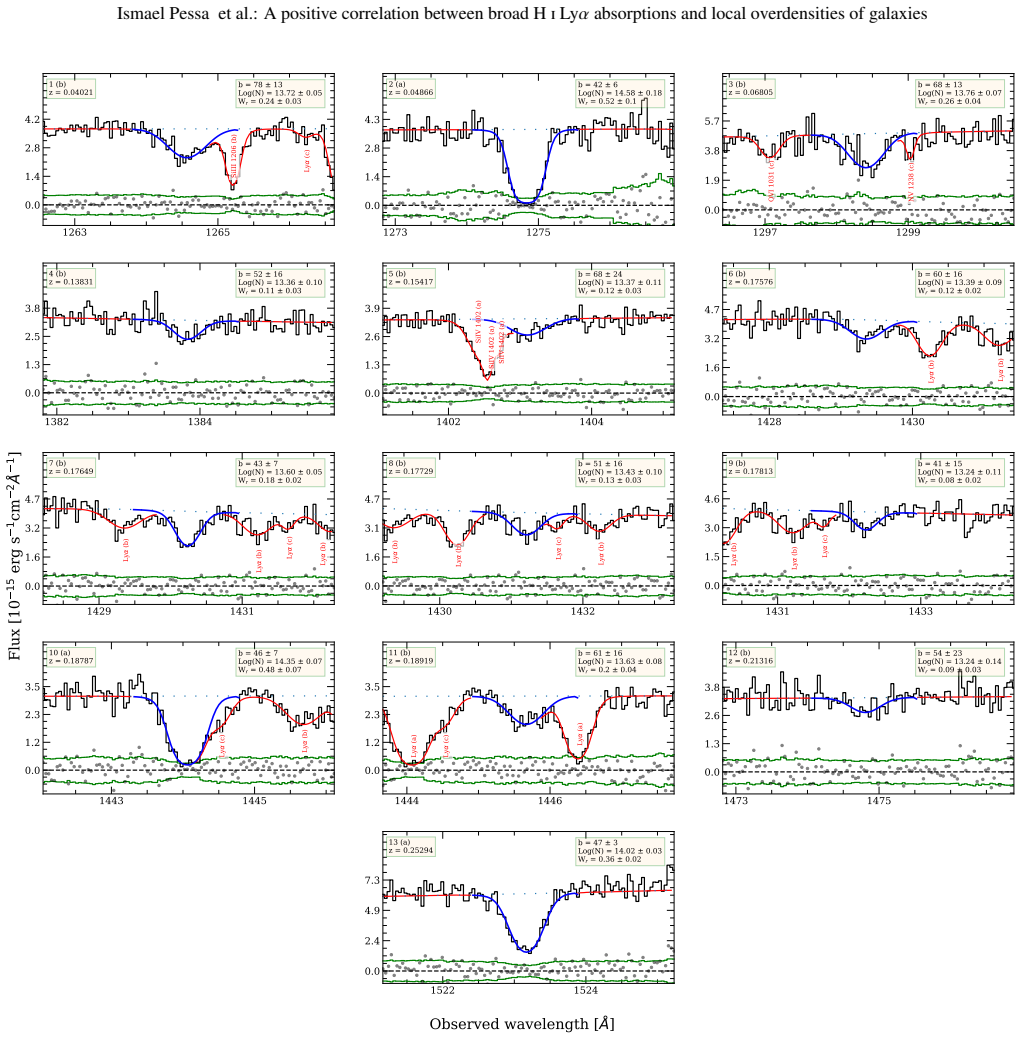
On the paper's own terms, broad Lyα absorbers—H I absorptions with Doppler parameter b>40 km/s, taken as tracers of warm-hot intergalactic gas—are preferentially found in locally overdense galaxy environments. The authors detect 13 reliable BLAs in the HST/COS spectrum of the quasar at z≈0.27, measure their neutral and ionized hydrogen column densities using Voigt-profile fitting and an assumed turbulent-to-thermal broadening ratio, and compare completeness-corrected galaxy counts in the VLT/VIMOS field with counts expected from a halo mass function. They find that 8 of 13 BLAs coincide with a measurable galaxy excess, that the excess peaks within ±1000 km/s and at impact parameters below about 1.5 Mpc, and that inferred hydrogen column density correlates positively with the found-to-expected galaxy ratio: ρ=0.88±0.14 for ionized hydrogen and ρ=0.70±0.08 for neutral hydrogen, while Doppler parameter shows no such correlation. The paper concludes that denser warm-hot gas resides deep within the gravitational potential wells of cosmic filaments, extending to the warm-hot phase what earlier work established for cooler Lyα absorbers.
Load-bearing premise
The overdensity axis rests on correcting observed galaxy counts by factors of 0.84 and 0.27, with the 0.27 recovery fraction measured against a photometric catalog that may itself be incomplete near the r=22.5 limit, and on expected counts from a halo mass function and a stellar-to-halo mass relation that could be biased.
Editorial extensions
If this is right
- Broad Lyα absorbers can serve as signposts of cosmic filaments even where no inter-cluster axis has been identified, since most of these BLAs avoid the preselected cluster-pair axes yet still cluster around galaxy overdensities.
- The warm-hot intergalactic medium is not spread uniformly: its column density tracks galaxy density on Mpc scales, meaning UV absorption surveys along quasar sightlines can map where the missing baryons concentrate.
- Doppler width does not track environment, so temperature or non-thermal broadening is not set by local galaxy density; column density is the gas property that responds to the filament environment.
- The flattening of column density at the strongest overdensities matches the pattern seen for cooler H I absorbers, where absorption saturates in the densest filament cores.
- Narrow Lyα absorbers show a similar but weaker trend, suggesting that both the cold and the warm-hot phases of the intergalactic medium respond to the same underlying galaxy overdensity.
Reading between the lines
- A testable extension follows from the paper's method: stacking many archival UV quasar sightlines against galaxy redshift surveys could map warm-hot gas density without requiring preselected filament axes, since the correlation with local galaxy excess is measurable even with a single sightline.
- The BLA at z≈0.21316, found in an apparent galaxy void, offers a sharp discriminating test: deeper galaxy spectroscopy at that redshift should either reveal a faint excess, which would implicate survey incompleteness, or confirm genuinely isolated warm gas, which would mean some warm-hot baryons live outside filaments.
- The fragility of the overdensity axis suggests a pointed follow-up: obtaining complete redshifts to r≈23–24 in one quadrant of the VIMOS field would directly test whether the 0.27 recovery factor is accurate and whether the reported correlation survives without that correction.
- If the correlation holds across many sightlines, BLA column density could become a practical proxy for filament gas density in baryon-census work, complementing dispersion measures from fast radio bursts.
Signed reviews
Editorial analysis
A structured set of objections, weighed in public.
Referee Report
Summary. The paper reports an observational study of 13 broad H I Lyα absorbers (BLAs) in the HST/COS spectrum of a single QSO, combined with VLT/MUSE and VLT/VIMOS galaxy surveys. The authors estimate completeness-corrected galaxy counts in ±1000 km s−1 windows around each BLA, compare these with expectations from a halo mass function, and identify four strong and four tentative galaxy overdensities. They then correlate the inferred ionized hydrogen column density of the BLAs with the local galaxy overdensity, reporting a positive Spearman correlation of ρ = 0.88 ± 0.14 for 12 BLAs (one BLA excluded because it may be associated with a galaxy), and argue that the warm-hot intergalactic medium resides preferentially in dense cosmic filaments.
Significance. If the correlation is robust, the paper provides one of the few direct observational links between the physical conditions of the warm-hot intergalactic medium and the local galaxy environment, complementing earlier work on narrower Lyα absorbers and filament impact parameters. The paper is careful on the absorption-line side: it uses BIC to test blended decompositions, checks saturated systems with additional Lyman lines and associated metals, and transparently quantifies the α (turbulent-to-thermal broadening) systematic range in Table 4. It also makes a genuine effort to characterize the VIMOS completeness function, and the analysis is largely reproducible given the public tools and detailed tables. The main weakness is that the headline correlation does not yet propagate the substantial uncertainties in the galaxy-overdensity axis, which is the load-bearing quantity of the central claim.
major comments (4)
- [Sec 4.3, Fig 14 (top)] The quoted Spearman uncertainty is obtained by perturbing only the column densities, while the x-axis values Nfound/Nexpected are treated as exact. Each x-value is, however, a ratio of a completeness-corrected galaxy count (divided by 0.84 and 0.27 in Sec 2.6.4) to an expected count from the Reed et al. halo mass function with a constant M/L and the Moster et al. (2010) stellar-to-halo mass relation (Sec 3.1). The two lowest-redshift points (z≈0.04021 and 0.04866), which have raw counts of 2 and 3 and anchor the high-NHII end, are especially sensitive to these corrections. I request a Monte Carlo or jackknife that also perturbs the found counts with Poisson statistics, the completeness corrections with priors reflecting the SDSS DR16 comparison, and the expected counts (for example by varying the halo-mass threshold by the ~0.1-0.2 dex scatter in the stellar-to-halo relation), and that reports the resulting Spearman coefficient and its full uncertainty.
- [Sec 4.3, Table 4] The systematic range in log NHII from the α = 0 to α = 1.5 bracket (column 6 of Table 4) is comparable to the statistical errors, and the paper itself states this in Sec 2.7. Yet the reported ρ = 0.88 ± 0.14 is computed only for the fiducial α = 0.7. Because the correlation is the central claim, the authors should recompute the Spearman coefficient for α = 0 and α = 1.5, and ideally incorporate the α range into the quoted uncertainty; if the correlation disappears or changes rank order under this bracket, the claim needs to be substantially softened.
- [Sec 4.3 and Sec 4.2] The headline correlation uses 12 BLAs after excluding the z≈0.18919 system as likely associated with a galaxy, and the paper acknowledges in Sec 4.2 that the four 'strong' overdensities are only about 1σ above the 2.5× threshold. This makes the result sensitive to individual points. I request a leave-one-out analysis for both the full 13-BLA sample and the 12-BLA sample, and an explicit statement of how ρ changes when the two low-redshift anchors (z≈0.04021 and 0.04866) or the void BLA at z≈0.21316 are removed. Without such a robustness test, the significance of a rank correlation on 12 points with a post hoc exclusion is difficult to assess.
- [Sec 3.1 and Sec 2.6.4] The completeness correction relies on the recovery fraction of 0.27 measured against SDSS DR16 near r = 22.5, which is close to the SDSS median 5σ depth of r = 22.70. If SDSS itself is incomplete at this limit, the recovery fraction is biased and the corrected found counts inherit a systematic error that is not propagated into the overdensity ratios. In addition, the expected galaxy counts are obtained by converting the r-band luminosity limit to a halo-mass threshold using a constant mass-to-light ratio and the Moster et al. (2010) relation, an extrapolation at the low stellar masses probed at z≈0.04-0.05. The paper should state the direction and plausible magnitude of these biases and include them in the uncertainty budget of the overdensity axis.
minor comments (3)
- [Fig 4 caption] The third panel description in the caption begins with 'Left:' but should be 'Right:' to match the redshift distribution panel.
- [Sec 4.2] The text writes 'Although 8000 km−1' where the unit should be 'km s−1'; the same typo appears in a few other places.
- [Sec 2.6.4] The phrase 'the real number of sources with apparent r magnitude < 22.5 mag in the VIMOS field of view that satisfies the imposed color criteria' should read 'that satisfy', and the photometric system used for the R−I criterion should be stated explicitly (SDSS versus Johnson-Cousins) for reproducibility.
Circularity Check
No significant circularity: the reported BLA-to-overdensity correlation is built from independent column-density and galaxy-count measurements.
full rationale
The central claim (Sec 4.3, Fig 14 top) compares ionized hydrogen column densities inferred from Voigt-profile fits to the HST/COS spectrum with a completeness-corrected found-to-expected galaxy count ratio from VLT/VIMOS and SDSS DR16. These two axes are constructed from fully independent data: NHII comes from b and NHI plus the Richter et al. (2006a) temperature-ionization relation, with the turbulent-to-thermal ratio alpha adopted from the external Savage et al. (2014) and Stocke et al. (2014) samples and explicitly bracketed with alpha = 0 and 1.5; the overdensity axis comes from VIMOS galaxy counts corrected by the 0.84 redshift-success fraction and the 0.27 recovery fraction measured against SDSS DR16, divided by an expectation from the Reed et al. (2007) halo mass function with a Moster et al. (2010) stellar-to-halo mass conversion. No BLA property enters the galaxy-count or expectation calculation, and no galaxy-overdensity property enters the NHII calculation. The self-citations (Tejos et al. 2016; Pessa et al. 2018) are methodological, covering line-identification criteria, MUSE survey construction, and the ionization-inference recipe; they do not contain or assert the target correlation. The removal of the z about 0.18919 BLA from the Spearman calculation is a stated sample choice motivated by a nearby MUSE galaxy, not a fit to the correlation. The paper's caveats about completeness, the alpha systematic, and small-number statistics concern robustness and uncertainty propagation, which are correctness risks rather than circularity. The derivation chain is therefore self-contained and no prediction reduces by construction to its inputs.
Assumptions & free parameters
free parameters (2)
- α (turbulent-to-thermal Doppler broadening ratio) =
0.7 (fiducial; range 0 to 1.5 evaluated)
- Velocity window for galaxy overdensity =
±1000 km s^-1
assumptions (5)
- domain assumption ΛCDM cosmology with Planck 2016 parameters for HMF and distance calculations.
- domain assumption The Reed et al. (2007) HMF model and the Moster et al. (2010) stellar-to-halo mass relation correctly predict the number of galaxies above the r=22.5 mass threshold in the VIMOS field.
- domain assumption The Richter et al. (2006a) relation log(fion) = -0.75 + 1.25 log(T) applies to the BLA sample.
- domain assumption BLAs with b>40 km/s trace gas at T>10^5 K (WHIM).
- domain assumption Inter-cluster axes from the GMBCG catalog are proxies for cosmic filaments.
Cite this review
Pith. "Pith review of A positive correlation between broad HI Ly$\alpha$ absorptions and local overdensities of galaxies." pith.science (2026). https://pith.science/paper/ZG5BTN4Y
@misc{pith2026250415452,
  author       = {Pith},
  title        = {Pith review of: A positive correlation between broad HI Ly$\alpha$ absorptions and local overdensities of galaxies},
  year         = {2026},
  howpublished = {\url{https://pith.science/paper/ZG5BTN4Y}},
  note         = {Machine review of arXiv:2504.15452}
}
abstract
A large fraction of the baryon budget at $z<1$ resides in large-scale filaments in the form of diffuse intergalactic gas, and numerous studies have reported a significant correlation between the strength of the absorptions produced by this gas in the spectra of bright background sources, and impact parameter to cosmic filaments intersected by these sightlines. However, a similar relation is harder to determine for the warm-hot phase of the intergalactic gas, since its higher Doppler parameter and significantly lower neutral gas fraction makes this gas difficult to detect in absorption. We use a sample of 13 broad Ly$\alpha$ absorbers (BLAs) detected in the HST/COS spectrum of a single QSO ($z\sim0.27$), whose sightline intersects several inter-cluster axes, to study the relation between BLAs and the large-scale structure of the Universe. Given their Doppler parameters of $b>40$ km s$^{-1}$, BLAs are good tracers of warm-hot intergalactic gas. We use VLT/MUSE and VLT/VIMOS data to infer local overdensities of galaxies at the redshifts of the BLAs, and to assess the potential association of the BLAs with nearby galaxies. We find that out of the 13 BLAs in our sample, four are associated with a strong overdensity of galaxies, and four with tentative overdensities. The remaining five are located at redshifts where we do not identify any excess of galaxies. We find that these overdensities of galaxies at the redshift of BLAs are local, and they vanish when larger cosmic volumes are considered, in terms of a larger velocity offset to the BLA or larger impact parameter to the QSO sightline. Finally, we find a positive correlation between the total hydrogen column densities inferred from the BLAs, and the relative excess of galaxies at the same redshifts, consistent with the picture where warm-hot gas resides deep within the gravitational potential well of cosmic filaments.
Figures


Figures from the paper (11 more)




Forward citations
Cited by 1 Pith paper
-
Measurement of the Dispersion$\unicode{x2013}$Galaxy Cross-Power Spectrum with the Second CHIME/FRB Catalog
FRB dispersion and foreground galaxy density are spatially correlated at 5.1 sigma, with a fitted plasma clustering cutoff near 0.9 Mpc, measured from 2,873 CHIME FRBs and about 6 million DESI galaxies.
Reference graph
Works this paper leans on
-
[1]
A., van de Weygaert, R., & Jones, B
Aragón-Calvo, M. A., van de Weygaert, R., & Jones, B. J. T. 2010, MNRAS, 408, 2163 Astropy Collaboration, Price-Whelan, A. M., Sip˝ocz, B. M., et al. 2018, AJ, 156, 123 Astropy Collaboration, Robitaille, T. P., Tollerud, E. J., et al. 2013, A&A, 558, A33
work page 2010
-
[2]
2010, in Society of Photo-Optical In- strumentation Engineers (SPIE) Conference Series, V ol
Bacon, R., Accardo, M., Adjali, L., et al. 2010, in Society of Photo-Optical In- strumentation Engineers (SPIE) Conference Series, V ol. 7735, Ground-based and Airborne Instrumentation for Astronomy III, ed. I. S. McLean, S. K. Ram- say, & H. Takami, 773508
2010
-
[3]
Bacon, R., Piqueras, L., Conseil, S., Richard, J., & Shepherd, M. 2016, MPDAF: MUSE Python Data Analysis Framework, Astrophysics Source Code Library, record ascl:1611.003
work page 2016
-
[4]
Baptista, J., Prochaska, J. X., Mannings, A. G., et al. 2023, arXiv e-prints, arXiv:2305.07022
arXiv 2023
-
[5]
Bell, E. F. & de Jong, R. S. 2001, ApJ, 550, 212
2001
-
[6]
& Arnouts, S
Bertin, E. & Arnouts, S. 1996, A&AS, 117, 393
1996
-
[7]
R., Kofman, L., & Pogosyan, D
Bond, J. R., Kofman, L., & Pogosyan, D. 1996, Nature, 380, 603
1996
-
[8]
Bouma, S. J. D., Richter, P., & Wendt, M. 2021, A&A, 647, A166
work page 2021
Show all 73 references
-
[9]
C., Gnat, O., & Brinboim, Y
Bromberg, I., Sarkar, K. C., Gnat, O., & Brinboim, Y . 2024, arXiv e-prints, arXiv:2407.18071
2024 arXiv
-
[10]
N., Elek, O., Tejos, N., et al
Burchett, J. N., Elek, O., Tejos, N., et al. 2020, ApJ, 891, L35
2020
-
[11]
Cautun, M., van de Weygaert, R., Jones, B. J. T., & Frenk, C. S. 2014, MNRAS, 441, 2923
2014
-
[12]
& Ostriker, J
Cen, R. & Ostriker, J. P. 1999, ApJ, 514, 1
1999
-
[13]
M., Pomarède, D., Tully, R
Courtois, H. M., Pomarède, D., Tully, R. B., Hoffman, Y ., & Courtois, D. 2013, AJ, 146, 69
2013
-
[14]
W., Keeney, B
Danforth, C. W., Keeney, B. A., Tilton, E. M., et al. 2016, ApJ, 817, 111
2016
-
[15]
W., Stocke, J
Danforth, C. W., Stocke, J. T., & Shull, J. M. 2010, ApJ, 710, 613 Davé, R., Cen, R., Ostriker, J. P., et al. 2001, ApJ, 552, 473
2010
-
[16]
J., Lang, D., et al
Dey, A., Schlegel, D. J., Lang, D., et al. 2019, AJ, 157, 168
2019
-
[17]
M., & Diaferio, A
Dolag, K., Bykov, A. M., & Diaferio, A. 2008, Space Sci. Rev., 134, 311
2008
-
[18]
2015, MNRAS, 450, 1465
Garzilli, A., Theuns, T., & Schaye, J. 2015, MNRAS, 450, 1465
2015
-
[19]
1986, ApJ, 303, 336 González, R
Gehrels, N. 1986, ApJ, 303, 336 González, R. E. & Padilla, N. D. 2010, MNRAS, 407, 1449
1986
-
[20]
A., Koester, B
Hao, J., McKay, T. A., Koester, B. P., et al. 2010, ApJS, 191, 254
2010
-
[21]
A., Bolton, A
Hutchinson, T. A., Bolton, A. S., Dawson, K. S., et al. 2016, AJ, 152, 205
2016
-
[22]
L., Berg, D
James, B. L., Berg, D. A., King, T., et al. 2022, ApJS, 262, 37
2022
-
[23]
M., White, S
Kauffmann, G., Heckman, T. M., White, S. D. M., et al. 2003, MNRAS, 341, 33
2003
-
[24]
S., Sorini, D., Lee, K.-G., & Davé, R
Khrykin, I. S., Sorini, D., Lee, K.-G., & Davé, R. 2024, MNRAS, 529, 537
2024
-
[25]
& Böhringer, H
Kull, A. & Böhringer, H. 1999, A&A, 341, 23 Le Fèvre, O., Saisse, M., Mancini, D., et al. 2003, in Society of Photo-Optical Instrumentation Engineers (SPIE) Conference Series, V ol. 4841, Instrument Design and Performance for Optical /Infrared Ground-based Telescopes, ed. M. I...
1999
-
[26]
S., et al
Lee, K.-G., Ata, M., Khrykin, I. S., et al. 2022, ApJ, 928, 9
2022
-
[27]
D., Richter, P., et al
Lehner, N., Savage, B. D., Richter, P., et al. 2007, ApJ, 658, 680
2007
-
[28]
P., Prochaska, J
Macquart, J. P., Prochaska, J. X., McQuinn, M., et al. 2020, Nature, 581, 391
2020
-
[29]
W., Kacprzak, G
Marra, R., Churchill, C. W., Kacprzak, G. G., et al. 2024, MNRAS, 527, 10522
2024
-
[30]
C., Fanson, J., Schiminovich, D., et al
Martin, D. C., Fanson, J., Schiminovich, D., et al. 2005, ApJ, 619, L1
2005
-
[31]
C., et al
Martizzi, D., V ogelsberger, M., Artale, M. C., et al. 2019, MNRAS, 486, 3766
2019
-
[32]
A., et al
Matthee, J., Schaye, J., Crain, R. A., et al. 2017, MNRAS, 465, 2381
2017
-
[33]
2014, ApJ, 780, L33
McQuinn, M. 2014, ApJ, 780, L33
2014
-
[34]
P., Somerville, R
Moster, B. P., Somerville, R. S., Maulbetsch, C., et al. 2010, ApJ, 710, 903
2010
-
[35]
2018, Nature, 558, 406
Nicastro, F., Kaastra, J., Krongold, Y ., et al. 2018, Nature, 558, 406
2018
-
[36]
D., Davé, R., Kereš, D., et al
Oppenheimer, B. D., Davé, R., Kereš, D., et al. 2010, MNRAS, 406, 2325
2010
-
[37]
2016, MNRAS, 458, 733
Pachat, S., Narayanan, A., Muzahid, S., et al. 2016, MNRAS, 458, 733
2016
-
[38]
F., et al
Pessa, I., Tejos, N., Barrientos, L. F., et al. 2018, MNRAS, 477, 2991
2018
-
[39]
2020, in Astronomical Society of the Pacific Conference Series, V ol
Pessa, I., Tejos, N., & Moya1, C. 2020, in Astronomical Society of the Pacific Conference Series, V ol. 522, Astronomical Data Analysis Software and Sys- tems XXVII, ed. P. Ballester, J. Ibsen, M. Solar, & K. Shortridge, 61 Planck Collaboration, Ade, P. A. R., Aghanim, N., et ...
2020
-
[40]
X., Tejos, N., Crighton, N., et al
Prochaska, J. X., Tejos, N., Crighton, N., et al. 2016, Linetools/Linetools: Second Major Release, Zenodo
2016
-
[41]
X., Weiner, B., Chen, H
Prochaska, J. X., Weiner, B., Chen, H. W., Mulchaey, J., & Cooksey, K. 2011, ApJ, 740, 91
2011
-
[42]
S., Bower, R., Frenk, C
Reed, D. S., Bower, R., Frenk, C. S., Jenkins, A., & Theuns, T. 2007, in Astro- nomical Society of the Pacific Conference Series, V ol. 379, Cosmic Frontiers, ed. N. Metcalfe & T. Shanks, 12
2007
-
[43]
H., Veronica, A., Pacaud, F., et al
Reiprich, T. H., Veronica, A., Pacaud, F., et al. 2021, A&A, 647, A2
2021
-
[44]
D., Tripp, T
Richter, P., Savage, B. D., Tripp, T. M., & Sembach, K. R. 2004, ApJS, 153, 165
2004
-
[45]
C., Wakker, B
Sameer, Charlton, J. C., Wakker, B. P., et al. 2024, MNRAS, 530, 3827
2024
-
[46]
D., Kim, T
Savage, B. D., Kim, T. S., Wakker, B. P., et al. 2014, ApJS, 212, 8
2014
-
[47]
D., Lehner, N., & Narayanan, A
Savage, B. D., Lehner, N., & Narayanan, A. 2011, ApJ, 743, 180
2011
-
[48]
P., Richards, G
Schneider, D. P., Richards, G. T., Hall, P. B., et al. 2010, AJ, 139, 2360
2010
-
[49]
2022, AJ, 163, 154
Schombert, J., McGaugh, S., & Lelli, F. 2022, AJ, 163, 154
2022
-
[50]
F., Zabl, J., et al
Schroetter, I., Bouché, N. F., Zabl, J., et al. 2019, MNRAS, 490, 4368
2019
-
[51]
1978, Annals of Statistics, 6, 461
Schwarz, G. 1978, Annals of Statistics, 6, 461
1978
-
[52]
A., Lemaux, B
Shen, L., Miller, N. A., Lemaux, B. C., et al. 2017, MNRAS, 472, 998
2017
-
[53]
M., Smith, B
Shull, J. M., Smith, B. D., & Danforth, C. W. 2012, ApJ, 759, 23
2012
-
[54]
N., Prochaska, J
Simha, S., Burchett, J. N., Prochaska, J. X., et al. 2020, ApJ, 901, 134
2020
-
[55]
X., et al
Simha, S., Lee, K.-G., Prochaska, J. X., et al. 2023, ApJ, 954, 71
2023
-
[56]
X., et al
Simha, S., Tejos, N., Prochaska, J. X., et al. 2021, ApJ, 921, 134
2021
-
[57]
T., Lilly, S
Soto, K. T., Lilly, S. J., Bacon, R., Richard, J., & Conseil, S. 2016, MNRAS, 458, 3210
2016
-
[58]
T., Keeney, B
Stocke, J. T., Keeney, B. A., Danforth, C. W., et al. 2014, ApJ, 791, 128
2014
-
[59]
Struble, M. F. & Rood, H. J. 1999, ApJS, 125, 35
1999
-
[60]
N., Hopkins, A
Taylor, E. N., Hopkins, A. M., Baldry, I. K., et al. 2011, MNRAS, 418, 1587
2011
-
[61]
L., Crighton, N
Tejos, N., Morris, S. L., Crighton, N. H. M., et al. 2012, MNRAS, 425, 245
2012
-
[62]
L., Finn, C
Tejos, N., Morris, S. L., Finn, C. W., et al. 2014, MNRAS, 437, 2017
2014
-
[63]
X., Crighton, N
Tejos, N., Prochaska, J. X., Crighton, N. H. M., et al. 2016, MNRAS, 455, 2662
2016
-
[64]
M., Bowen, D
Tripp, T. M., Bowen, D. V ., Sembach, K. R., et al. 2006, in Astronomical Society of the Pacific Conference Series, V ol. 348, Astrophysics in the Far Ultraviolet: Five Years of Discovery with FUSE, ed. G. Sonneborn, H. W. Moos, & B. G. Andersson, 341
2006
-
[65]
S., & Werk, J
Tumlinson, J., Peeples, M. S., & Werk, J. K. 2017, ARA&A, 55, 389
2017
-
[66]
2021, A&A, 646, A156
Tuominen, T., Nevalainen, J., Tempel, E., et al. 2021, A&A, 646, A156
2021
-
[67]
2021, MNRAS, 505, 4178
Vernstrom, T., Heald, G., Vazza, F., et al. 2021, MNRAS, 505, 4178
2021
-
[68]
P., Hernandez, A
Wakker, B. P., Hernandez, A. K., French, D. M., et al. 2015, ApJ, 814, 40
2015
-
[69]
& Wei, J.-J
Wang, B. & Wei, J.-J. 2023, ApJ, 944, 50
2023
-
[70]
Watson, W. E. & V ogeley, M. S. 2022, arXiv e-prints, arXiv:2204.06708
2022 arXiv
-
[71]
S., et al
Werner, N., Finoguenov, A., Kaastra, J. S., et al. 2008, A&A, 482, L29
2008
-
[72]
C., Tchernyshyov, K., Werk, J
Wilde, M. C., Tchernyshyov, K., Werk, J. K., et al. 2023, ApJ, 948, 114
2023
-
[73]
J., Mulchaey, J
Williams, R. J., Mulchaey, J. S., & Kollmeier, J. A. 2013, ApJ, 762, L10 Article number, page 22 of 36 Ismael Pessa et al.: A positive correlation between broad H i Lyα absorptions and local overdensities of galaxies Appendix A: Galaxies in our VLT/MUSE galaxy survey Table A.1...
2013
Reviewed August 16, 2026 · model on record in the stance chip above.
Discussion (0). Continue with ORCID to comment.