REVIEW 3 major objections 4 minor 35 references
Using Lyman Alpha Absorption to Measure the Intensity and Variability of $z \sim 2.4$ Ultraviolet Background Light
T0 review · 3 major / 4 minor · reviewed 2026-08-16 · deepseek-v4-flash
Pith's one-line read The negative Ly-alpha troughs in stacked HETDEX LAE spectra measure the z~2.4 ultraviolet background light: 12.9 ± 3.7 nW m⁻² sr⁻¹ at 4134 Å.
desk verdict A genuinely new probe of the z~2.4 UVB, but the headline EBL intensity is an assumed offset rather than a measured value; the density trend is the more solid result. read the letter →
The pith
A machine-rendered reading of the paper's core claim, the machinery that carries it, and where it could break.
The reading
What carries the argument
The central object is the negative Ly-alpha absorption trough in stacked LAE spectra, produced by saturated H I absorption of the UV background in a damped Ly-alpha system (a high-column-density neutral hydrogen absorber that fully removes the line). The load-bearing identity is that the additive flux offset required to bring the troughs to zero equals the over-subtracted background light, i.e., the EBL. The machinery that makes this measurable is HETDEX's local sky subtraction: a per-shot 'empty' fiber spectrum is constructed from the remaining fibers and subtracted, and after stacking with a weighted biweight statistic the residual trough depth becomes a surface brightness via an aperture-area unit conversion.
What would settle it
Stack a sample of LAEs with measured H I column densities (from damping-wing fits or 21-cm absorption) and check whether the additive offset required to make the troughs non-negative is independent of column density: if the offset varies with column density, the absorption is not saturated and the reported EBL intensity is not the true background. A second check is to build empty-fiber stacks with the identical sky-subtraction pipeline; negative troughs of comparable depth in those stacks would show the signal is a subtraction artifact rather than background absorption.
Extended reading notes
Core claim
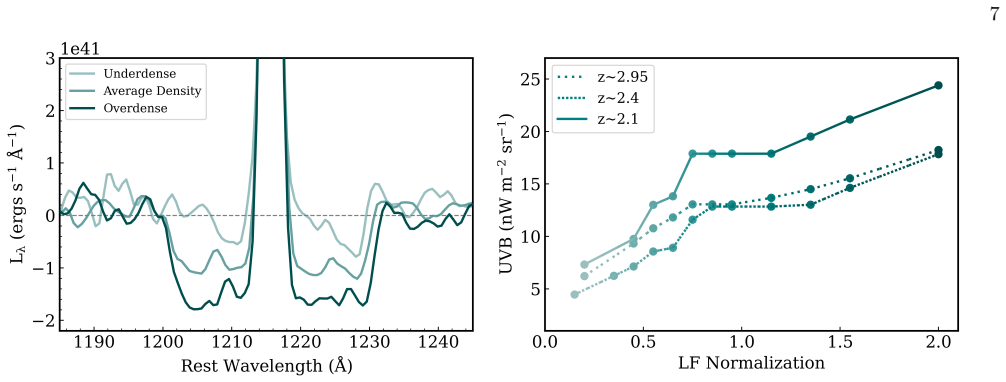
In the DLA-like model the paper adopts, H I gas in and around a foreground Lyman-$\alpha$ emitter absorbs the diffuse ultraviolet background at Ly-$\alpha$, so the observed spectrum before sky subtraction contains the background, the galaxy's own emission, and the absorbed part removed. The sky model built from off-source fibers contains the same background plus foreground sky; subtracting it leaves the Ly-$\alpha$ emission with a negative trough whose depth equals the absorbed background. The paper therefore determines the flux offset in the observed frame that must be added to each spectrum to make the troughs in the stack non-negative, and calls that offset the $z \sim 2.4$ ultraviolet contribution to the extragalactic background light. Averaging over density-weighted fields gives $12.9 \pm 3.7$ nW m$^{-2}$ sr$^{-1}$ at 4134 Å, with individual density bins ranging from about 5 to 18 nW m$^{-2}$ sr$^{-1}$; the corresponding rest-frame UVB is $508 \pm 145$ nW m$^{-2}$ sr$^{-1}$.
Load-bearing premise
The measurement rests on the assumption that the Ly-alpha absorption by each foreground galaxy's hydrogen is saturated, like a damped Ly-alpha system, so that every ultraviolet background photon at that wavelength is removed and the offset needed to fill the trough equals the full background intensity; the paper notes that the properties and physical extent of the absorbing gas are not fully quantified.
Editorial extensions
If this is right
- The method gives an indirect, stacking-based measurement of the $z \sim 2$--$3$ ultraviolet background from a large untargeted survey, complementing direct measurements that only cover small patches of sky.
- The EBL at observed-frame Ly-alpha is not uniform: it scales with the local density of Lyman-alpha emitters, so line-of-sight EBL measurements carry a cosmic-variance term that depends on field density.
- Because the measurement stops at each LAE's redshift, the reported value is a lower limit to the total optical EBL; using the model comparison in the paper, which attributes about 60% of the EBL to sources at $z > 2$, the implied total is roughly 67% higher.
- The same trough-depth offset can be measured in different redshift bins, yielding a rough spectrum of the EBL at three observed wavelengths with hints of evolution, not just a single number.
Reading between the lines
- If the saturated-absorption assumption is correct, the required trough offset should be independent of the absorbing gas column density; splitting the stack by H I column or by impact parameter would directly test this and could turn the method into a column-density-independent EBL probe.
- The observed density dependence implies that any 'average' EBL measured through LAE absorption is biased toward overdense regions; correcting for that bias could help reconcile direct cosmic optical background measurements with galaxy-count predictions.
- The same negative-trough signature should appear in other large spectroscopic surveys that use local sky subtraction, allowing the over-subtraction of the ultraviolet background to be used as a cosmology probe rather than only a systematic.
- The model predicts an anisotropy: LAEs with more background galaxies along the line of sight should show deeper troughs, so trough depth could be cross-correlated with background galaxy counts around each emitter.
Signed reviews
Editorial analysis
A structured set of objections, weighed in public.
Referee Report
Summary. The manuscript uses stacks of roughly 400,000 HETDEX Ly-alpha emitter spectra to measure the z~2.4 rest-frame ultraviolet background light. It argues that the negative Ly-alpha absorption troughs around the emission line are produced by saturated, DLA-like H I absorption of the full UV background, and that HETDEX's sky subtraction removes that background, so the additive offset required to raise the troughs to zero equals the observed-frame EBL. The authors report a density-weighted average of 12.9 +/- 3.7 nW m^-2 sr^-1 at a median observed wavelength of 4134 Angstroms, corresponding to a rest-frame UVB of 508 +/- 145 nW m^-2 sr^-1 at z~2.4, and find that the inferred intensity scales with local galaxy density. They compare the result with the Haardt & Madau (2012) UVB model and with direct optical EBL/COB measurements, concluding rough consistency.
Significance. If the physical model is validated, this would be a novel and potentially important probe of the z~2-3 ultraviolet background and its small-scale anisotropy, exploiting a unique HETDEX dataset. The paper has notable strengths: a very large sample, a careful stacking procedure, a direct pre-sky-subtraction comparison in Figure 3, a useful density-dependent trend in Figure 5 that serves as a consistency check, and an unusually candid statement of limitations. However, the absolute calibration of the headline intensity rests on untested assumptions about absorber saturation and covering fraction, and no forward model or independent calibration is presented. The result is therefore best understood at present as a model-normalized estimate rather than a direct measurement, so the central claim needs additional support before publication.
major comments (3)
- [§4.1, Eq. (3)] The central identification of the additive offset with the full EBL requires that the absorbing H I be saturated and that it fully cover the effective aperture, but Section 4.1 explicitly states that 'we have not fully quantified the properties and physical extent of the absorbing gas' and Section 6 concedes that 'our physical model of the absorption is not complete.' If the covering fraction is f < 1, the observed deficit equals f times the incident UVB, so the reported 12.9 nW m^-2 sr^-1 is too low by a factor 1/f; if the trough minimum is not optically thick, the offset is only a lower limit. The density trend in Figure 5 is a relative measurement and cannot calibrate this absolute factor. Please provide an external constraint on the covering fraction and optical depth, or explicitly present the absolute intensity as a lower limit rather than a measured value.
- [§4.1, Figure 2] The assumption that the co-added LAE spectra have no detectable stellar continuum is load-bearing for the absolute offset. The paper states that shifting the full-sample stack to zero requires +0.063 x 10^-17 erg s^-1 cm^-2 Angstrom^-1, whereas shifting to the detected continuum requires +0.084 x 10^-17, about 33% larger. Figure 2 shows detectable continuum in the large stack, so the assertion that the z~2.4 stacks used for the measurement have no continuum must be quantified for those exact stacks, and the associated systematic uncertainty must be propagated into the reported 12.9 +/- 3.7 nW m^-2 sr^-1.
- [§4.1, §6] No forward model or independent calibration is presented that connects the measured trough depth to the incident UVB intensity. The interpretation is imported from Paper I, and Eq. (3) makes the EBL equal to the additive offset by construction, so the physical meaning of the offset is not independently tested in this manuscript. A radiative-transfer or mock-stacking model of the expected trough shape and amplitude, or a cross-check using known background sources behind H I absorbers, is needed to separate the EBL intensity from the absorber properties and to validate the absolute normalization.
minor comments (4)
- [§3.1, §5] There are typographical errors: Section 3.1 contains 'are are not purely' and Section 5 contains 'our value only does not include'; also the abstract and Section 4.1 use 'as a' inconsistently in a few places.
- [Eq. (4)] Please define the quantity 9.85 arcsec explicitly: is it a diameter, a radius, or the effective area solid angle of the aperture? The unit conversion in Eq. (4) would be clearer if the solid angle of the effective aperture were written out and the intermediate units shown.
- [Figure 5, right panel] The uncertainty estimates on the EBL values in the right panel of Figure 5 are not described; please state how the 1-sigma errors were computed (e.g., bootstrap, jackknife, or propagation of the stack noise) and whether they include systematic contributions from the offset determination.
- [§4.2] The choice of luminosity-function normalization bins (0-0.3, 0.95-1, 1.5-1.6) should be justified in more detail; it is unclear why the average-density bin does not include the range 1.0-1.5 and how uncertainties in the field-to-field LF normalization affect the bin assignment.
Circularity Check
The reported EBL intensity is, by construction, the additive offset fitted to the Lyα troughs, and its physical normalization rests on the unverified saturated-absorber model imported from the authors' own Paper I.
-
fitted input called prediction
[Section 4.1 (method), Eq. (3), and Section 6 (limitations)]
"Our method of measuring the UVB/EBL is simple: we determine the flux offset in the observed frame that must be added to each individual spectrum in order to make the Lyα troughs in the overall stack non-negative. This offset is the “EBL” that is over-subtracted in the optical."
The reported value (12.9 ± 3.7 nW m−2 sr−1) is exactly the offset fitted to force the stacked troughs to zero. Equation (3) makes the post-subtraction spectrum LAE + (−UVB_Lyα), so the offset equals UVB_Lyα only under the paper's assumed model. The model inputs — saturated DLA-like absorption with unit covering fraction and zero stellar continuum at the trough — are not derived or calibrated here; Section 4.1 states 'we have not fully quantified the properties and physical extent of the absorbing gas.' If the absorber is not saturated or has covering fraction f < 1, the measured offset is a lower limit or f × UVB. The 'prediction' of the EBL is therefore the fit parameter by construction, with the physical meaning supplied by an unverified assumption.
-
self citation load bearing
[Section 4.1 opening; Section 6 summary]
"If we assume the physical model of the absorption troughs presented in Paper I, we can use the amount that the troughs are over-subtracted to estimate the level of extragalactic background light experienced by the LAE. ... our physical model of the absorption is not complete."
The central premise — that the negative troughs are Lyα absorption of the full UVB by DLA-like H I around LAEs — is imported from Weiss et al. (2024), a paper by the same authors. No first-principles derivation of the saturated, fully covering absorber is given here; the paper's own Section 6 concedes the physical model is not complete. Thus the absolute EBL normalization rests on a self-citation whose key assumption is explicitly unverified. The external consistency checks (Haardt & Madau 2012; direct COB) are order-of-magnitude comparisons, not independent calibrations of the covering fraction or saturation.
full rationale
The paper contains real, independent evidence that the troughs are physical: they appear in pre-sky-subtracted LAE stacks, are absent in [O II] emitter stacks and empty-fiber stacks, and deepen with local galaxy density. These facts and the external consistency with Haardt & Madau (2012) and direct COB measurements show the work is not wholly circular. However, the headline intensity is defined operationally as the additive offset that makes the troughs non-negative, and the identification of that offset with the full incident UVB relies on a saturated, unity-covering-fraction absorber model taken from the authors' Paper I. The paper explicitly states the absorbing gas properties are not fully quantified and that the physical model is incomplete. Consequently the absolute normalization of the reported EBL is equal to the fitted offset by construction, with the physical label supplied by an unverified self-citation. This is partial circularity (fitted input called prediction), not a complete absence of independent content.
Assumptions & free parameters
free parameters (4)
- Additive flux offset per (redshift, density) bin =
EBL values 4-25 nW m^-2 sr^-1 (right panel, Figure 5)
- Line width cut =
sigma < 5.5 Angstroms
- Empty-fiber continuum rejection thresholds =
0.25, -0.05, 0.05 x 10^-17 erg s^-1 cm^-2 Angstrom^-1
- Overdensity bin definitions =
LFnorm ranges: 0-0.3, 0.95-1, 1.5-1.6
assumptions (5)
- ad hoc to paper Ly-alpha absorption of UVB by LAE halos is saturated (DLA-like).
- domain assumption No detectable stellar continuum in the co-added LAE spectra.
- domain assumption The HETDEX sky spectrum measured off-source contains the full UVB, so subtraction removes exactly the UVB absorbed by the LAE.
- ad hoc to paper The Paper I physical model (asymmetric geometry, location bias) correctly explains the troughs as background absorption rather than instrumental or algorithmic systematics.
- domain assumption Stacking statistics and the residual empty-fiber correction faithfully represent the true sky level.
Cite this review
Pith. "Pith review of Using Lyman Alpha Absorption to Measure the Intensity and Variability of $z \sim 2.4$ Ultraviolet Background Light." pith.science (2026). https://pith.science/paper/ZN3YTRRN
@misc{pith2026250413253,
  author       = {Pith},
  title        = {Pith review of: Using Lyman Alpha Absorption to Measure the Intensity and Variability of $z \sim 2.4$ Ultraviolet Background Light},
  year         = {2026},
  howpublished = {\url{https://pith.science/paper/ZN3YTRRN}},
  note         = {Machine review of arXiv:2504.13253}
}
abstract
We present measurements of $z \sim 2.4$ ultraviolet background light using Lya absorption from galaxies at $z \sim 2-3$ in the Hobby-Eberly Telescope Dark Energy Experiment (HETDEX) database. Thanks to the wide area of this survey, we also measure the variability of this light across the sky. The data suggest an asymmetric geometry where integrated ultraviolet light from background galaxies is absorbed by \ion{H}{1} within the halo of a foreground galaxy, in a configuration similar to damped Lya systems. Using stacking analyses of over 400,000 HETDEX LAE spectra, we argue that this background absorption is detectable in our data. We also argue that the absorption signal becomes negative due to HETDEX's sky subtraction procedure. The amount that the absorption is over-subtracted is representative of the $z \sim 2.4$ UV contribution to the overall extragalactic background light (EBL) at Lya. Using this method, we determine an average intensity (in $\nu J_{\nu}$ units) of $12.9 \pm 3.7$ nW m$^{-2}$ sr$^{-1}$ at a median observed wavelength of 4134 angstroms, or a rest-frame UV background intensity of $508 \pm 145$ nW m$^{-2}$ sr$^{-1}$ at $z\sim2.4$. We find that this flux varies significantly depending on the density of galaxies in the field of observation. Our estimates are consistent with direct measurements of the overall EBL.
Figures


Figures from the paper (4 more)



Reference graph
Works this paper leans on
-
[1]
Andrews, D. F., Bickel, P. J., Hampel, F. R., et al. 1972, Robust Estimates of Location: Survey and Advances (Princeton University Press). http://www.jstor.org/stable/j.ctt13x12sw AstroPy Collaboration, Price-Whelan, A. M., SipHocz, B. M., et al. 2018, Astronomical Journal, 156, 123, doi: 10.3847/1538-3881/aabc4f
-
[2]
Beers, T. C., Flynn, K., & Gebhardt, K. 1990, AJ, 100, 32, doi: 10.1086/115487
doi:10.1086/115487 1990
-
[3]
Bernstein, R. A. 2007, The Astrophysical Journal, 666, 663, doi: 10.1086/519824
doi:10.1086/519824 2007
-
[4]
2016, Royal Society Open Science, 3, 150555, doi: 10.1098/rsos.150555
Cooray, A. 2016, Royal Society Open Science, 3, 150555, doi: 10.1098/rsos.150555
-
[5]
2021, ApJ, 920, 122, doi: 10.3847/1538-4357/ac1598
Davis, D., Gebhardt, K., Mentuch Cooper, E., et al. 2021, ApJ, 920, 122, doi: 10.3847/1538-4357/ac1598
-
[6]
Davis, D., Gebhardt, K., Cooper, E. M., et al. 2023a, ApJ, 946, 86, doi: 10.3847/1538-4357/acb0ca —. 2023b, ApJ, 954, 209, doi: 10.3847/1538-4357/ace4c2
-
[7]
Driver, S. P., Andrews, S. K., Davies, L. J., et al. 2016, ApJ, 827, 108, doi: 10.3847/0004-637X/827/2/108 Faucher-Gigu` ere, C.-A., Lidz, A., Zaldarriaga, M., &
-
[8]
2009, ApJ, 703, 1416, doi: 10.1088/0004-637X/703/2/1416
Hernquist, L. 2009, ApJ, 703, 1416, doi: 10.1088/0004-637X/703/2/1416
Show all 35 references
-
[9]
2007, ApJ, 671, 278, doi: 10.1086/522955
Gawiser, E., Francke, H., Lai, K., et al. 2007, ApJ, 671, 278, doi: 10.1086/522955
2007 doi
-
[10]
2021, ApJ, 923, 217, doi: 10.3847/1538-4357/ac2e03
Gebhardt, K., Mentuch Cooper, E., Ciardullo, R., et al. 2021, ApJ, 923, 217, doi: 10.3847/1538-4357/ac2e03
2021 doi
-
[11]
W., Calabretta, M
Greisen, E. W., Calabretta, M. R., Valdes, F. G., & Allen, S. L. 2006, A&A, 446, 747, doi: 10.1051/0004-6361:20053818
2006 doi
-
[12]
2010, ApJ, 714, 255, doi: 10.1088/0004-637X/714/1/255
Guaita, L., Gawiser, E., Padilla, N., et al. 2010, ApJ, 714, 255, doi: 10.1088/0004-637X/714/1/255
2010 doi
- [13]
-
[14]
2012, ApJ, 746, 125, doi: 10.1088/0004-637X/746/2/125
Haardt, F., & Madau, P. 2012, ApJ, 746, 125, doi: 10.1088/0004-637X/746/2/125
2012 doi
-
[15]
R., Millman, K
Harris, C. R., Millman, K. J., van der Walt, S. J., et al. 2020, Nature, 585, 357, doi: 10.1038/s41586-020-2649-2
2020 doi
-
[16]
J., Kelz, A., Lee, H., et al
Hill, G. J., Kelz, A., Lee, H., et al. 2018, in Society of Photo-Optical Instrumentation Engineers (SPIE) Conference Series, Vol. 10702, Proc. SPIE, 107021K, doi: 10.1117/12.2314280
2018 doi
-
[17]
J., Lee, H., MacQueen, P
Hill, G. J., Lee, H., MacQueen, P. J., et al. 2021, AJ, 162, 298, doi: 10.3847/1538-3881/ac2c02
2021 doi
-
[18]
Hunter, J. D. 2007, Computing in Science & Engineering, 9, 90, doi: 10.1109/MCSE.2007.55
2007 doi
-
[19]
2019, PASJ, 71, 55, doi: 10.1093/pasj/psz029
Kusakabe, H., Shimasaku, K., Momose, R., et al. 2019, PASJ, 71, 55, doi: 10.1093/pasj/psz029
2019 doi
-
[20]
R., Postman, M., Spencer, J
Lauer, T. R., Postman, M., Spencer, J. R., et al. 2022, ApJL, 927, L8, doi: 10.3847/2041-8213/ac573d
2022 doi
-
[21]
2022, ApJ, 940, 40, doi: 10.3847/1538-4357/ac9af2
Liu, C., Gebhardt, K., Kollatschny, W., et al. 2022, ApJ, 940, 40, doi: 10.3847/1538-4357/ac9af2
2022 doi
-
[22]
2011, The Astrophysical Journal, 736, 119, doi: 10.1088/0004-637x/736/2/119
Matsuoka, Y., Ienaka, N., Kawara, K., & Oyabu, S. 2011, The Astrophysical Journal, 736, 119, doi: 10.1088/0004-637x/736/2/119
2011 doi
-
[23]
J., et al
Matsuura, S., Arai, T., Bock, J. J., et al. 2017, The Astrophysical Journal, 839, 7, doi: 10.3847/1538-4357/aa6843
2017 doi
-
[24]
2017, Monthly Notices of the Royal Astronomical Society, 470, 2152–2169, doi: 10.1093/mnras/stx1296 Mentuch Cooper, E., Gebhardt, K., Davis, D., et al
Mattila, K., V¨ ais¨ anen, P., Lehtinen, K., von Appen-Schnur, G., & Leinert, C. 2017, Monthly Notices of the Royal Astronomical Society, 470, 2152–2169, doi: 10.1093/mnras/stx1296 Mentuch Cooper, E., Gebhardt, K., Davis, D., et al. 2023, ApJ, 943, 177, doi: 10.3847/1538-4357/aca962
2017 doi
-
[25]
Miralda-Escude, J., & Ostriker, J. P. 1990, ApJ, 350, 1, doi: 10.1086/168358 Planck Collaboration I. 2020, A&A, 641, A1, doi: 10.1051/0004-6361/201833880
1990 doi
-
[26]
R., Parker, J
Postman, M., Lauer, T. R., Parker, J. W., et al. 2024, ApJ, 972, 95, doi: 10.3847/1538-4357/ad5ffc
2024 doi
- [27]
-
[28]
W., Adams, M
Ramsey, L. W., Adams, M. T., Barnes, T. G., et al. 1998, in Society of Photo-Optical Instrumentation Engineers (SPIE) Conference Series, Vol. 3352, Advanced Technology Optical/IR Telescopes VI, ed. L. M. Stepp, 34–42, doi: 10.1117/12.319287
1998 doi
-
[29]
G., et al
Saldana-Lopez, A., Dom´ ınguez, A., P´ erez-Gonz´ alez, P. G., et al. 2021, MNRAS, 507, 5144, doi: 10.1093/mnras/stab2393
2021 doi
-
[30]
M., et al
Slosar, A., Font-Ribera, A., Pieri, M. M., et al. 2011, JCAP, 2011, 001, doi: 10.1088/1475-7516/2011/09/001
2011 doi
-
[31]
J., & Wolfe, A
Storrie-Lombardi, L. J., & Wolfe, A. M. 2000, ApJ, 543, 552, doi: 10.1086/317138
2000 doi
-
[32]
E., et al
Virtanen, P., Gommers, R., Oliphant, T. E., et al. 2020, Nature Methods, 17, 261, doi: 10.1038/s41592-019-0686-2
2020 doi
-
[33]
H., Davis, D., Gebhardt, K., et al
Weiss, L. H., Davis, D., Gebhardt, K., et al. 2024, ApJ, 962, 102, doi: 10.3847/1538-4357/ad1b51
2024 doi
-
[34]
M., Lanzetta, K
Wolfe, A. M., Lanzetta, K. M., Foltz, C. B., & Chaffee, F. H. 1995, ApJ, 454, 698, doi: 10.1086/176523
1995 doi
-
[35]
2017, Nature Communications, 8, doi: 10.1038/ncomms15003
Zemcov, M., Immel, P., Nguyen, C., et al. 2017, Nature Communications, 8, doi: 10.1038/ncomms15003
2017 doi
Reviewed August 16, 2026 · model on record in the stance chip above.
Discussion (0). Continue with ORCID to comment.