REVIEW 3 major objections 5 minor 23 references
Statistical approaches using longitudinal biomarkers for disease early detection: A comparison of methodologies
T0 review · 3 major / 5 minor · reviewed 2026-08-14 · deepseek-v4-flash
Pith's one-line read A pattern-mixture model of serial CA-125 predicts ovarian cancer earlier than the established ROCA algorithm or shared-random-effects models, except under very frequent screening.
desk verdict Solid PLCO comparison favoring PMM, but the simulation-based generalization in the abstract is circular and overstates the results. read the letter →
The pith
A machine-rendered reading of the paper's core claim, the machinery that carries it, and where it could break.
The reading
What carries the argument
The load-bearing object is the pattern mixture model (PMM), which models log CA-125 trajectories with a linear mixed model using natural cubic splines in screening time and baseline age, fit separately for cases and controls. Prediction is made through the Bayes identity $$ \frac{P(D_i=1\mid Y_i)}{P(D_i=0\mid Y_i)} = \frac{P(Y_i\mid D_i=1)}{P(Y_i\mid D_i=0)}\cdot\frac{P(D_i=1)}{P(D_i=0)}, $$ so the risk score is the likelihood ratio between the two fitted marker distributions. The paper's methodological point is that this direct factorization sidesteps ROCA's need to marginalize over diagnosis time and SREM's need to link the outcome to shared random effects, both of which the paper identifies as sources of suboptimal prediction.
What would settle it
Re-run the PLCO comparison without excluding cases whose diagnosis occurred more than three years after their last CA-125 test, and without truncating control follow-up at three years; if PMM's AUC advantage over ROCA at the 2- and 3-year cutoffs shrinks or reverses, the exclusion rule is carrying the result. An even sharper test is to simulate pre-clinical trajectories that rise slowly for several years before diagnosis and see whether PMM still beats ROCA.
Extended reading notes
Core claim
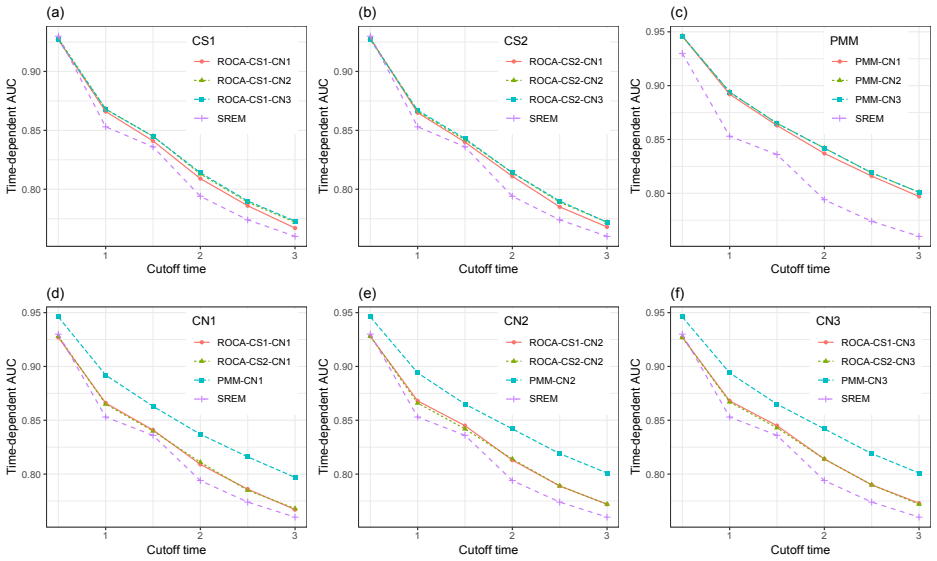
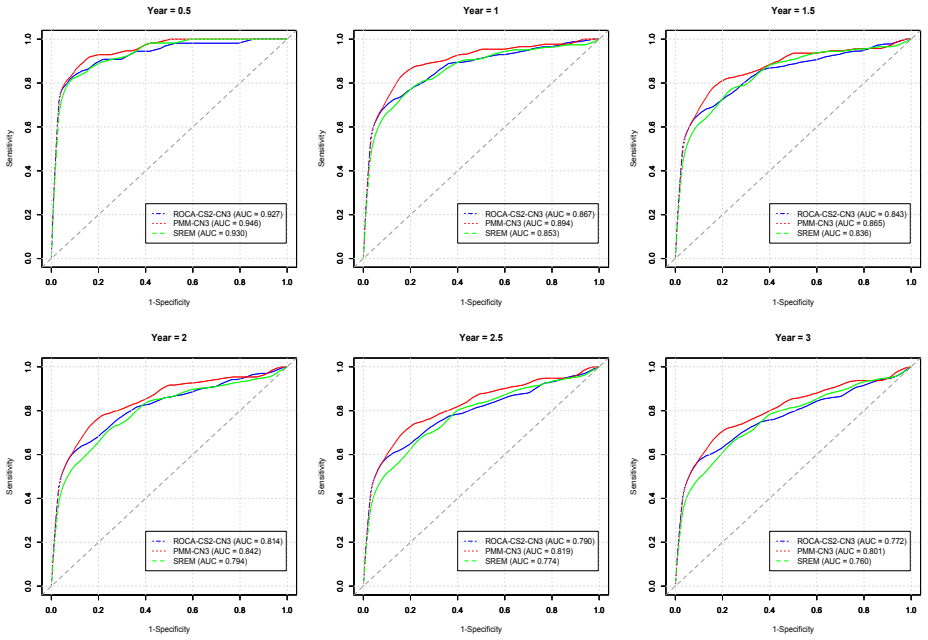
The paper's central finding is that conditioning strategy determines predictive accuracy. ROCA models the case trajectory with a latent subject-specific changepoint conditional on the unknown diagnosis time, and then must approximate the marginal case distribution by borrowing the gap between last screening and diagnosis from known cases; the paper argues this marginalization loses accuracy. PMM avoids the problem entirely by fitting the marker distribution separately for cases and controls and computing the risk odds as a likelihood ratio times the prior odds. Applied to 133 ovarian cancer cases and 30,269 controls from the PLCO trial with leave-one-out cross-validation, PMM had the highest time-dependent AUC at every cutoff from 0.5 to 3 years, and bootstrap comparisons show PMM significantly outperforms ROCA and SREM. The paper also reports simulation evidence that PMM remains competitive under annual and biannual screening, while ROCA's latent-changepoint advantage emerges only when screening is very frequent.
Load-bearing premise
The comparison assumes that cases diagnosed more than three years after their final CA-125 measurement can be dropped, and control follow-up truncated to three years, without removing the early-detection signal the methods are meant to capture.
Editorial extensions
If this is right
- Annual CA-125 screening programs could use PMM rather than ROCA to rank risk, because PMM's AUC advantage persists across all cutoffs from 0.5 to 3 years in the PLCO data.
- Adding screening time and baseline age to the control models improves model fit but barely changes AUC, so the practical gain in early detection comes from the risk construction, not from richer control trajectories.
- ROCA regains ground when CA-125 is measured quarterly, implying that sampling frequency determines which framework should be used: changepoint models when data are dense, pattern mixture models when they are sparse.
- Because PMM and SREM are general frameworks, the same comparison can be transported to other cancers with longitudinal markers, such as PSA for prostate cancer.
Reading between the lines
- The paper's exclusion of cases diagnosed more than three years after the last CA-125 test, matched by truncating control follow-up to three years, is a design choice worth probing; if slowly rising pre-clinical trajectories carry signal, a comparison that includes those cases could narrow PMM's margin.
- A natural extension the paper does not test is combining PMM's likelihood-ratio risk score with a survival model to produce absolute t-year risk estimates, since the current framework only ranks risk.
- The simulation design could be reused to benchmark PMM against ROCA in high-risk cohorts with quarterly screening, with the prediction that ROCA's changepoint advantage grows as the number of measurements before diagnosis increases.
Signed reviews
Editorial analysis
A structured set of objections, weighed in public.
Referee Report
Summary. This paper compares three approaches for early disease detection from longitudinal biomarkers—shared random effects model (SREM), pattern mixture model (PMM), and the risk of ovarian cancer algorithm (ROCA)—in the context of ovarian cancer screening with CA-125 measurements from the PLCO trial. The authors extend ROCA by estimating the changepoint distribution via maximum likelihood and by adding screening-time and baseline-age effects in the control model. Predictive performance is evaluated using time-dependent AUC with leave-one-out cross-validation. In the PLCO application, PMM achieves the highest AUCs and significantly outperforms ROCA and SREM. The authors also run simulation studies under two scenarios (ROCA-generated and PMM-generated data) at annual, biannual, and quarterly screening frequencies. The central claim is that PMM generally outperforms ROCA unless biomarkers are measured very frequently, with the PLCO analysis supporting PMM's advantage under annual screening.
Significance. If the comparative conclusions are valid, the paper would provide useful practical guidance for designing biomarker-based early-detection strategies: it demonstrates that a flexible pattern-mixture model can outperform a changepoint-based algorithm in a real screening cohort, and it proposes reasonable extensions to ROCA. The use of time-dependent AUC, LOOCV, and bootstrap-based confidence intervals is methodologically appropriate. However, the generality of the simulation-based conclusion is undermined by a circular simulation design: in each scenario the data are generated from the method that then wins, and the SREM-truth scenario is omitted. The PLCO empirical comparison is informative on its own, but the simulation results cannot support the abstract's global claim about the relative performance of PMM and ROCA across screening frequencies.
major comments (3)
- [Section 5.1 and Tables 4-5] The simulation design is circular and does not support the abstract's claim that 'PMM outperforms ROCA unless biomarkers are taken at very frequent screening settings.' Scenario 1 generates data from ROCA-CS2-CN3, and Table 4 shows ROCA beating PMM at every cutoff and every screening frequency, including annual screening (e.g., Year 0.5 AUC 0.915 vs 0.903 for PMM-CN3; Year 2.0 AUC 0.744 vs 0.724). Scenario 2 generates data from PMM-CN3, and Table 5 shows PMM beating ROCA at every frequency. There is no scenario in which PMM wins at less frequent screening and ROCA wins at more frequent screening; each true model wins everywhere. The simulations therefore only confirm that the data-generating method has an advantage, and the 'unless' condition in the abstract is not a consequence of the reported results. The authors should either add a scenario with SREM as the true model and/or environments that cross the two frameworks, or substantially temper the generalization and restrict the simulation conclusion to the specific scenarios considered.
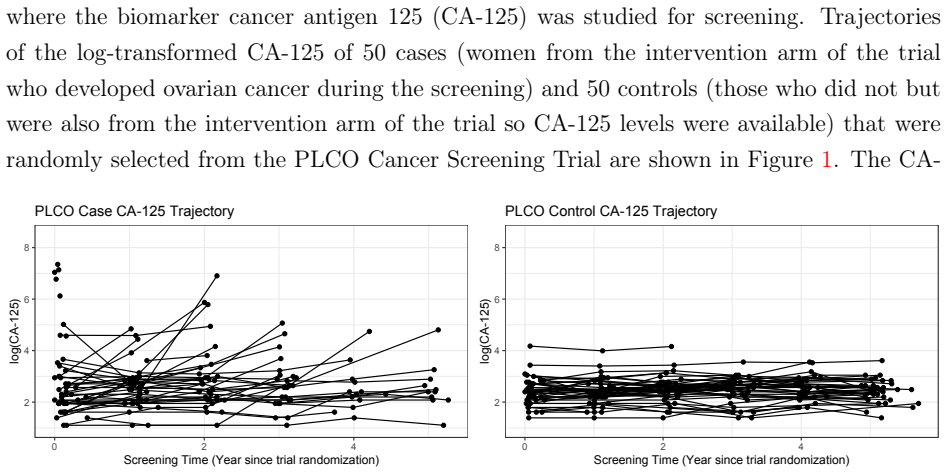
- [Section 4.1 and Section 6 (Discussion)] The PLCO analysis excludes ovarian cancer cases whose diagnosis occurred more than three years after the last CA-125 screening and truncates control follow-up to three years. The paper justifies this by stating that such cases have flat trajectories 'almost identical to those from controls,' but this is an empirical assertion that is not verified against the excluded cases. If the pre-clinical trajectories of these cases carry any prediction-relevant signal, the comparison of early-detection methods—particularly the ranking of PMM versus ROCA—could be biased. The authors should provide a sensitivity analysis using all available cases (or a different truncation threshold such as four or five years) and report whether the relative performance of the methods changes. As written, the load-bearing empirical result depends on a post-hoc inclusion rule whose effect is not assessed.
- [Section 5.1] The simulation parameters (exponential rate for survival, lognormal mixture for censoring, and the gap-time resampling) are fitted directly to the same PLCO data used in the empirical comparison. This is not circular by itself, but it means the simulations are calibrated to a single dataset and cannot be viewed as independent validation of the empirical findings. Combined with the omission of the SREM-truth scenario, the simulation evidence is substantially weaker than the narrative in the abstract and discussion. The authors should clarify this limitation and, if possible, add a scenario in which SREM is the true data-generating model to test the robustness of the ordering across all three frameworks.
minor comments (5)
- [Abstract] The sentence 'More generally, simulation studies showed that PMM outperforms ROCA unless biomarkers are taken at very frequent screening settings' is inconsistent with Table 4, where ROCA outperforms PMM even under annual screening when ROCA is the true model; please revise to state the simulation results accurately.
- [Section 4.3 and Table 3] The text states that PMM has significantly larger AUCs than ROCA and SREM based on bootstrapping replicates, but the bootstrap significance results are not shown in the table or in a dedicated supplementary table; please report the pairwise p-values or confidence intervals for the differences so the claim is verifiable.
- [Section 5.1, Step 4] The text 'using ROCA-CS2-CN3 or PMM-CS3' contains a typo; the PMM specification should be PMM-CN3.
- [Section 5.1, Step 2] The wording 'we randomly sample one Gi of the participants from the PLCO cancer data that are bounded in [tL,tU]' is unclear; it should say that the gap time is sampled from the empirical distribution of gap times among PLCO participants whose gap times fall in that interval.
- [Section 4.2] The procedure of drawing parameter estimates from the fitted asymptotic multivariate normal distribution is a parametric bootstrap; the paper should call it that and note that it is an approximation to the nonparametric bootstrap, rather than implying it is equivalent to the nonparametric procedure.
Circularity Check
Simulation-based generalization is self-confirming: each scenario is generated from the model the paper claims wins, so the abstract's statement that PMM outperforms ROCA except at very frequent screening is an artifact of the PMM-truth scenario, not an independent comparison.
-
other
[Section 5.1 (Simulation Settings) and Abstract; results in Tables 4 and 5]
"Two simulation scenarios were considered: Scenario 1 used ROCA-CS2-CN3 as the true model, whereas Scenario 2 used PMM-CN3 as the true model. [...] More generally, simulation studies showed that PMM outperforms ROCA unless biomarkers are taken at very frequent screening settings."
The simulation comparison cannot arbitrate between PMM and ROCA because the data are generated from one of the two competing models, guaranteeing that the generating model wins. Table 4 (ROCA truth) shows ROCA beating PMM at every cutoff and every frequency, including annual screening (Year 0.5: 0.915 vs 0.903; Year 2.0: 0.744 vs 0.724), while Table 5 (PMM truth) shows PMM beating ROCA at every frequency, including quarterly. Thus the abstract's claim that PMM outperforms ROCA unless biomarkers are taken at very frequent screening settings is not an independent finding; it is a restatement of the PMM-truth scenario, and the 'unless' qualifier is contradicted by the ROCA-truth scenario.
full rationale
The paper's main empirical contribution, the PLCO ovarian cancer comparison, is an independent out-of-sample evaluation using LOOCV and time-dependent AUC; that part is not circular. However, the abstract's broader simulation-based claim is not supported as a general comparison. The simulations define Scenario 1 with ROCA-CS2-CN3 as the true model and Scenario 2 with PMM-CN3 as the true model, so the winner in each scenario is determined by the simulation design rather than by an impartial assessment of the methods. The paper itself notes that 'the predictive advantage of ROCA over PMM and SREM became more prominent' with more frequent screening under ROCA truth, which directly contradicts the abstract's statement that PMM outperforms ROCA unless screening is very frequent. Because the simulation conclusion reduces to 'the model that generated the data performs best,' the simulation-based generalization is partially circular. The self-citations to the authors' prior work on PMM and SREM are present but are not the main source of circularity; the simulation design is. Overall, the PLCO result retains independent content, so the paper is not wholly circular, but the headline simulation claim should be substantially weakened.
Assumptions & free parameters
free parameters (4)
- Exponential rate for survival time T* =
6e-4
- Lognormal mixture parameters for censoring =
1/3 LN(1.7, 0.4^2) + 2/3 LN(2.1, 0.16^2)
- Changepoint distribution parameters in CS2 =
mu_tau=1.054, sigma_tau=0.314
- Natural cubic spline knot locations =
first and third quartiles of case baseline age and screening time
assumptions (4)
- domain assumption Linear mixed models with normal random effects and errors adequately describe log-transformed CA-125 trajectories.
- domain assumption The latent changepoint in ROCA follows a truncated normal distribution (original prespecified N(Ti-2, 0.75^2), extended as N(Ti-mu_tau, sigma_tau^2)).
- standard math The time-dependent AUC of Heagerty et al. (2000) correctly ranks risks under right censoring.
- ad hoc to paper Simulation data generation uses parameters fitted to the same PLCO data (survival rate, censoring mixture, gap-time resampling).
Cite this review
Pith. "Pith review of Statistical approaches using longitudinal biomarkers for disease early detection: A comparison of methodologies." pith.science (2026). https://pith.science/paper/ZNIDCIHR
@misc{pith2026190808093,
  author       = {Pith},
  title        = {Pith review of: Statistical approaches using longitudinal biomarkers for disease early detection: A comparison of methodologies},
  year         = {2026},
  howpublished = {\url{https://pith.science/paper/ZNIDCIHR}},
  note         = {Machine review of arXiv:1908.08093}
}
read the original abstract
Early detection of clinical outcomes such as cancer may be predicted based on longitudinal biomarker measurements. Tracking longitudinal biomarkers as a way to identify early disease onset may help to reduce mortality from diseases like ovarian cancer that are more treatable if detected early. Two general frameworks for disease risk prediction, the shared random effects model (SREM) and the pattern mixture model (PMM) could be used to assess longitudinal biomarkers on disease early detection. In this paper, we studied the predictive performances of SREM and PMM on disease early detection through an application to ovarian cancer, where early detection using the risk of ovarian cancer algorithm (ROCA) has been evaluated. Comparisons of the above three methods were performed via the analyses of the ovarian cancer data from the Prostate, Lung, Colorectal, and Ovarian (PLCO) Cancer Screening Trial and extensive simulation studies. The time-dependent receiving operating characteristic (ROC) curve and its area (AUC) were used to evaluate the prediction accuracy. The out-of-sample predictive performance was calculated using leave-one-out cross-validation (LOOCV), aiming to minimize the problem of model over-fitting. A careful analysis of the use of the biomarker cancer antigen 125 for ovarian cancer early detection showed improved performance of PMM as compared with SREM and ROCA. More generally, simulation studies showed that PMM outperforms ROCA unless biomarkers are taken at very frequent screening settings.
Figures
Reference graph
Works this paper leans on
-
[1]
Albert, P. S. (2012). A linear mixed model for predicting a binary event from longitudinal data under random effects misspecification.Statistics in Medicine , 31(2):143–154
work page 2012
-
[2]
Barry, M. J. (2001). Prostate-specific–antigen testing for early diagnosis of prostate cancer. New England Journal of Medicine , 344(18):1373–1377
work page 2001
-
[3]
Dressman, H. K., Febbo, P. G., West, M., et al. (2005). Patterns of gene expression that characterize long-term survival in advanced stage serous ovarian cancers.Clinical Cancer Research, 11(10):3686–3696
work page 2005
-
[4]
S., Partridge, E., Black, A., Johnson, C
Buys, S. S., Partridge, E., Black, A., Johnson, C. C., Lamerato, L., Isaacs, C., Reding, D. J., Greenlee, R. T., Yokochi, L. A., et al. (2011). Effect of screening on ovarian cancer mortality: the prostate, lung, colorectal and ovarian (plco) cancer screening randomized controlled trial. Journal of the American Medical Association , 305(22):2295–2303. 23
work page 2011
-
[5]
Clarke-Pearson, D. L. (2009). Screening for ovarian cancer. New England Journal of Medicine, 361(2):170–177
work page 2009
-
[6]
W., Shah, C., Thorpe, J., O’Briant, K., Anderson, G
Drescher, C. W., Shah, C., Thorpe, J., O’Briant, K., Anderson, G. L., Berg, C. D., Urban, N., and McIntosh, M. W. (2013). Longitudinal screening algorithm that incorporates change over time in ca125 levels identifies ovarian cancer earlier than a single-threshold rule. Journal of Clinical Oncology , 31(3):387
work page 2013
-
[7]
Han, Y. and Liu, D. (2019). Accounting for random observation time in risk prediction with longitudinal markers: An imputation approach.Statistical Methods in Medical Research . PMID: 30854937, https://doi.org/10.1177/0962280219833089
-
[8]
Heagerty, P. J., Lumley, T., and Pepe, M. S. (2000). Time-dependent roc curves for censored survival data and a diagnostic marker.Biometrics, 56(2):337–344
work page 2000
Show all 23 references
-
[9]
T., Webber, E
Henderson, J. T., Webber, E. M., and Sawaya, G. F. (2018). Screening for ovarian cancer: updated evidence report and systematic review for the us preventive services task force. Journal of the American Medical Association , 319(6):595–606
2018
-
[10]
Howlader, N., Noone, A., Krapcho, M., Miller, D., Brest, A., Yu, M., Ruhl, J., Tatalovich, Z., Mariotto, A., et al. (2019). Seer cancer statistics review, 1975-2016, national cancer institute. bethesda, md
2019
-
[11]
and Albert, P
Liu, D. and Albert, P. S. (2014). Combination of longitudinal biomarkers in predicting binary events. Biostatistics, 15(4):706–718
2014
-
[12]
A., Sood, A
Matulonis, U. A., Sood, A. K., Fallowfield, L., Howitt, B. E., Sehouli, J., and Karlan, B. Y. (2016). Ovarian cancer. Nature Reviews Disease Primers , 2:16061
2016
-
[13]
McIntosh, M. W. and Urban, N. (2003). A parametric empirical bayes method for cancer screening using longitudinal observations of a biomarker.Biostatistics, 4(1):27–40
2003
-
[14]
Singh, N., Benjamin, E., Burnell, M., et al. (2015). Risk algorithm using serial biomarker measurements doubles the number of screen-detected cancers compared with a single- thresholdruleintheunitedkingdomcollaborativetrialofovariancancerscreening. Journal of Clinical Oncology...
2015
-
[15]
F., Zhu, C., Skates, S
Pinsky, P. F., Zhu, C., Skates, S. J., Black, A., Partridge, E., Buys, S. S., and Berg, C. D. 24 (2013). Potential effect of the risk of ovarian cancer algorithm (roca) on the mortality outcome of the prostate, lung, colorectal and ovarian (plco) trial.International Journal of ...
2013
-
[16]
K., Fourkala, E.-O., Dive, C., Walker, M., et al
Kalsi, J. K., Fourkala, E.-O., Dive, C., Walker, M., et al. (2017). Novel risk models for early detection and screening of ovarian cancer.Oncotarget, 8(1):785
2017
-
[17]
J., Greene, M
Skates, S. J., Greene, M. H., Buys, S. S., Mai, P. L., Brown, P., Piedmonte, M., Rodriguez, G., Schorge, J. O., Sherman, M., Daly, M. B., et al. (2017). Early detection of ovarian cancer using the risk of ovarian cancer algorithm with frequent ca125 testing in women at increas...
2017
-
[18]
J., Menon, U., MacDonald, N., Rosenthal, A
Skates, S. J., Menon, U., MacDonald, N., Rosenthal, A. N., Oram, D. H., Knapp, R. C., and Jacobs, I. J. (2003). Calculation of the risk of ovarian cancer from serial ca-125 values for preclinical detection in postmenopausal women.Journal of Clinical Oncology , 21(10 Suppl):206s–210s
2003
-
[19]
J., Pauler, D
Skates, S. J., Pauler, D. K., and Jacobs, I. J. (2001). Screening based on the risk of cancer calculation from bayesian hierarchical changepoint and mixture models of longitudinal markers. Journal of the American Statistical Association , 96(454):429–439
2001
-
[20]
C., Alvero, A
Visintin, I., Feng, Z., Longton, G., Ward, D. C., Alvero, A. B., Lai, Y., Tenthorey, J., Leiser, A., Flores-Saaib, R., Yu, H., et al. (2008). Diagnostic markers for early detection of ovarian cancer. Clinical Cancer Research, 14(4):1065–1072
2008
-
[21]
Wentzensen, N. (2016). Large ovarian cancer screening trial shows modest mortality reduc- tion, but does not justify population-based ovarian cancer screening.BMJ Evidence-Based Medicine, 21(4):159–159
2016
-
[22]
Zhang, J., Kim, S., Grewal, J., and Albert, P. S. (2012). Predicting large fetuses at birth: do multiple ultrasound examinations and longitudinal statistical modelling improve pre- diction? Paediatric and Perinatal Epidemiology , 26(3):199–207
2012
-
[23]
C., Yu, Y., Li, J., Sokoll, L
Zhang, Z., Bast, R. C., Yu, Y., Li, J., Sokoll, L. J., Rai, A. J., Rosenzweig, J. M., Cameron, B., Wang, Y. Y., Meng, X.-Y., et al. (2004). Three biomarkers identified from serum 25 proteomic analysis for the detection of early stage ovarian cancer. Cancer Research, 64(16):5882...
2004
Reviewed August 14, 2026 · model on record in the stance chip above.
Discussion (0). Continue with ORCID to comment.