Modelling and detecting mild and gross anomalies in circular data via double-contaminated models
Pith reviewed 2026-06-30 01:55 UTC · model grok-4.3
The pith
A three-component mixture model jointly captures mild and gross anomalies in circular data for improved fit and decomposition.
A machine-rendered reading of the paper's core claim, the machinery that carries it, and where it could break.
Core claim
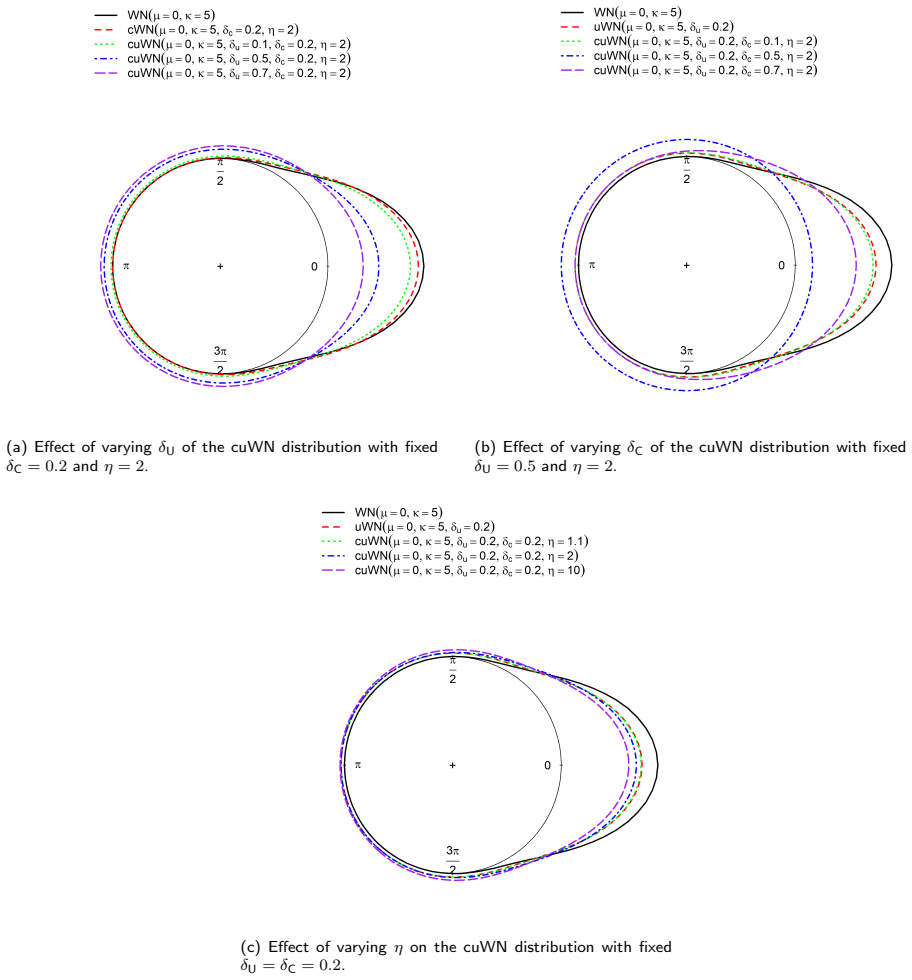
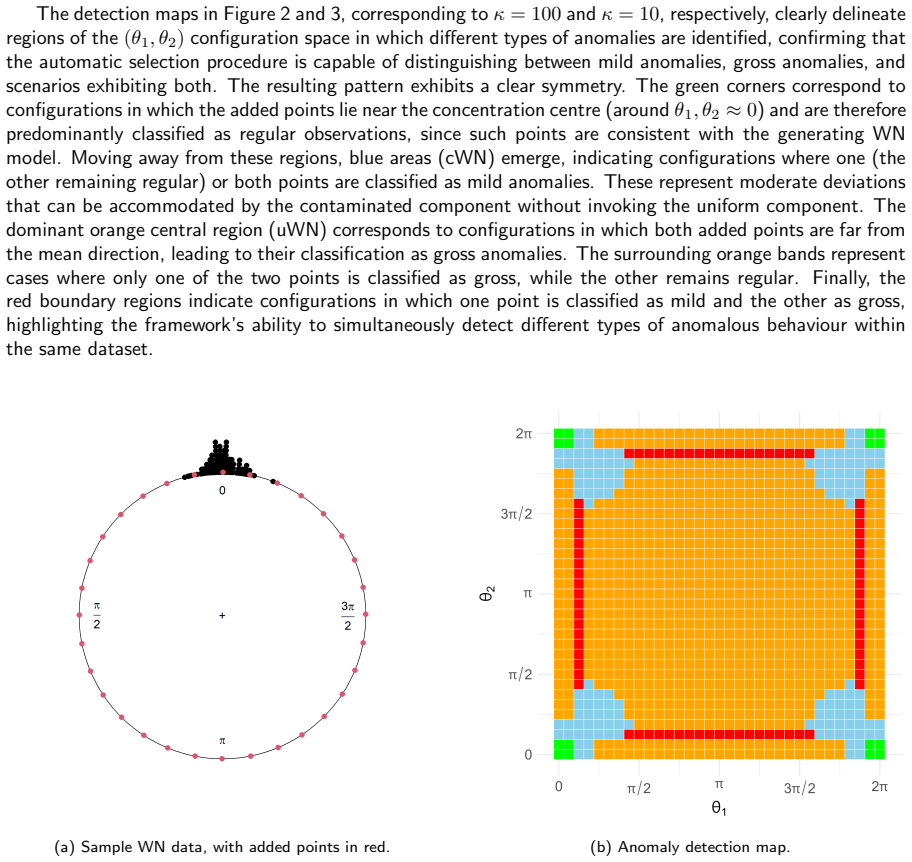
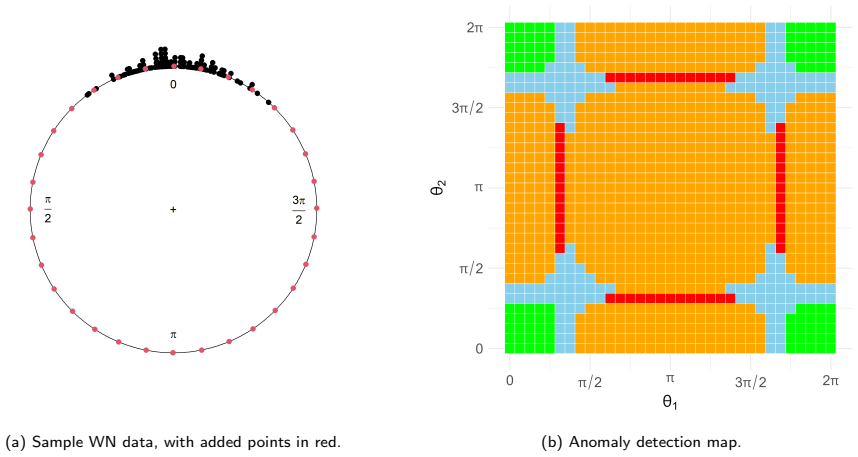
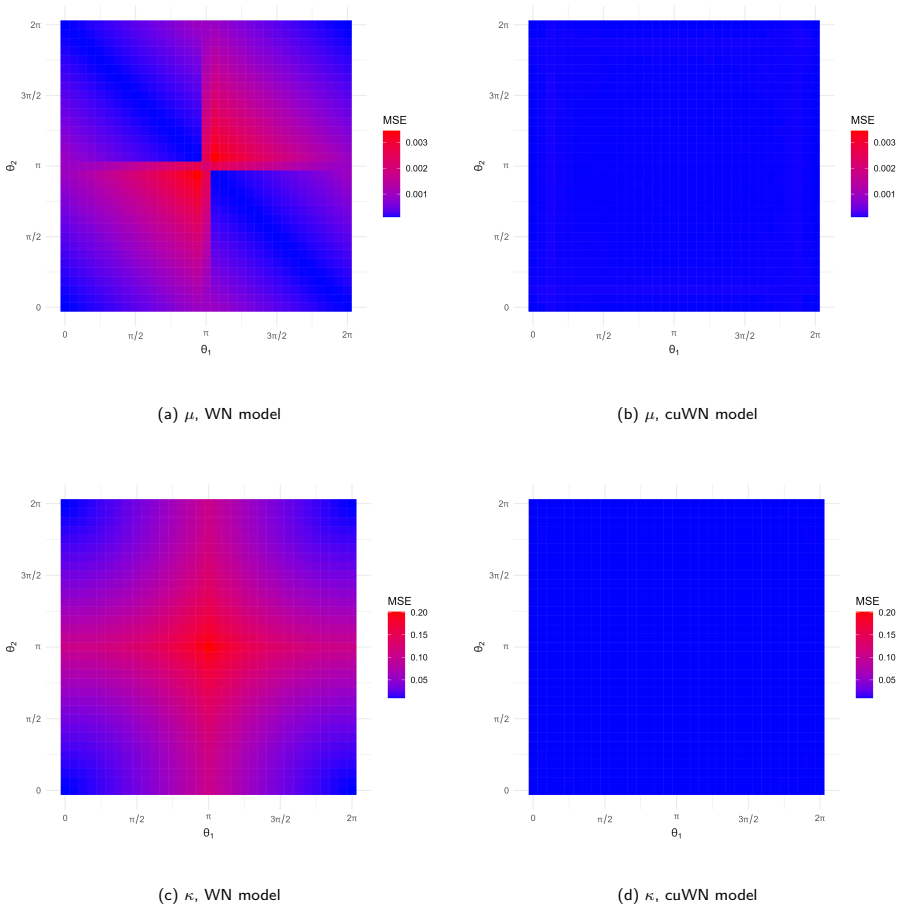
The central discovery is that finite mixture models constructed from a reference circular distribution by adding a uniform component for gross anomalies and a less concentrated version sharing the same mean for mild anomalies, including their combination in a double-contaminated model, enable robust inference where posterior component probabilities classify observations and mixing weights quantify anomaly levels, as shown in simulations and applications to directional data.
What carries the argument
The double-contaminated model: a three-component finite mixture of a reference distribution, its less concentrated counterpart with identical mean direction, and a circular uniform distribution.
If this is right
- Posterior probabilities provide automatic classification of observations as reference, mild anomaly, or gross anomaly without needing thresholds.
- Mixing weights serve as interpretable measures of the prevalence of each type of anomaly and the inflation of dispersion.
- Jointly modelling both anomaly types yields better model fit compared to modelling only one type.
- The approach identifies latent structure in the directional data beyond simple anomaly detection.
Where Pith is reading between the lines
- This framework could be extended to other circular distributions or to linear data with analogous contamination structures.
- The decomposition into components might aid in identifying behavioral patterns in movement data that correspond to different anomaly types.
- If the shared mean direction assumption is relaxed, more flexible models could capture directional shifts in anomalies.
Load-bearing premise
The reference distribution is unimodal and symmetric, mild anomalies are a less concentrated version with exactly the same mean direction, and gross anomalies follow a uniform distribution.
What would settle it
A simulation where data generated with mild anomalies having a different mean direction shows the double-contaminated model fails to improve fit or misclassifies observations would falsify the utility of the construction.
Figures
read the original abstract
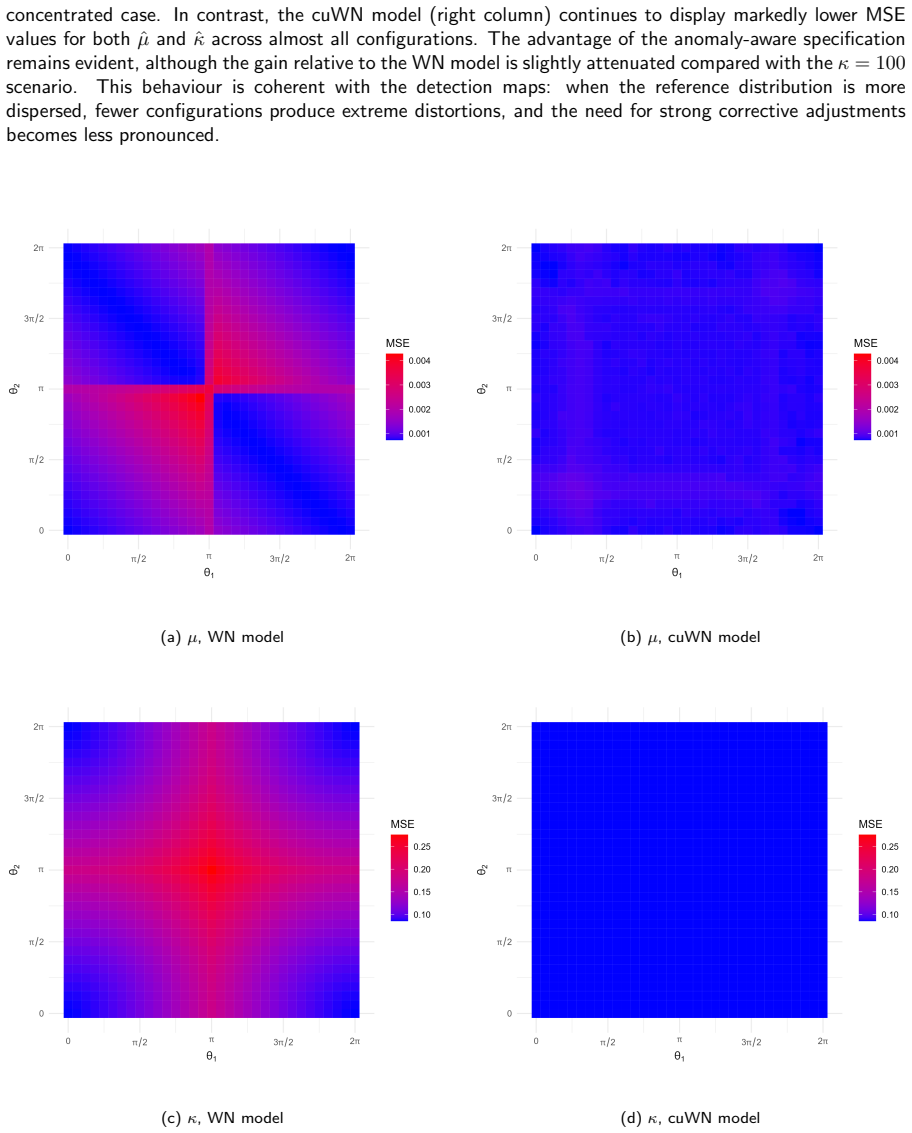
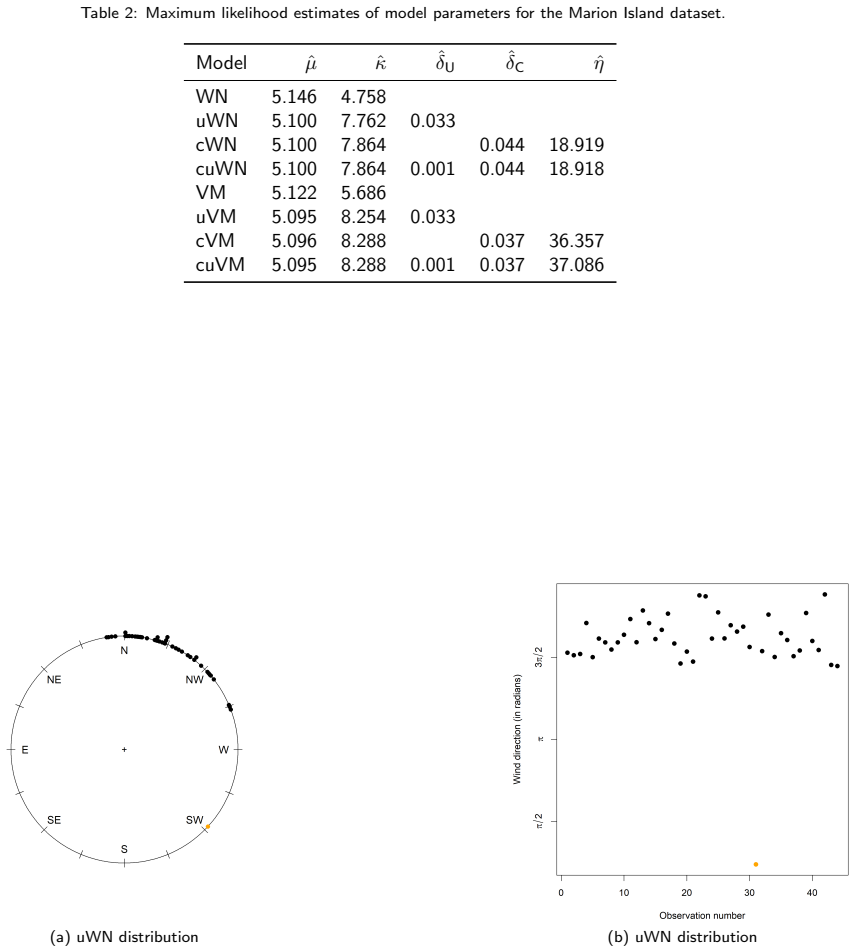
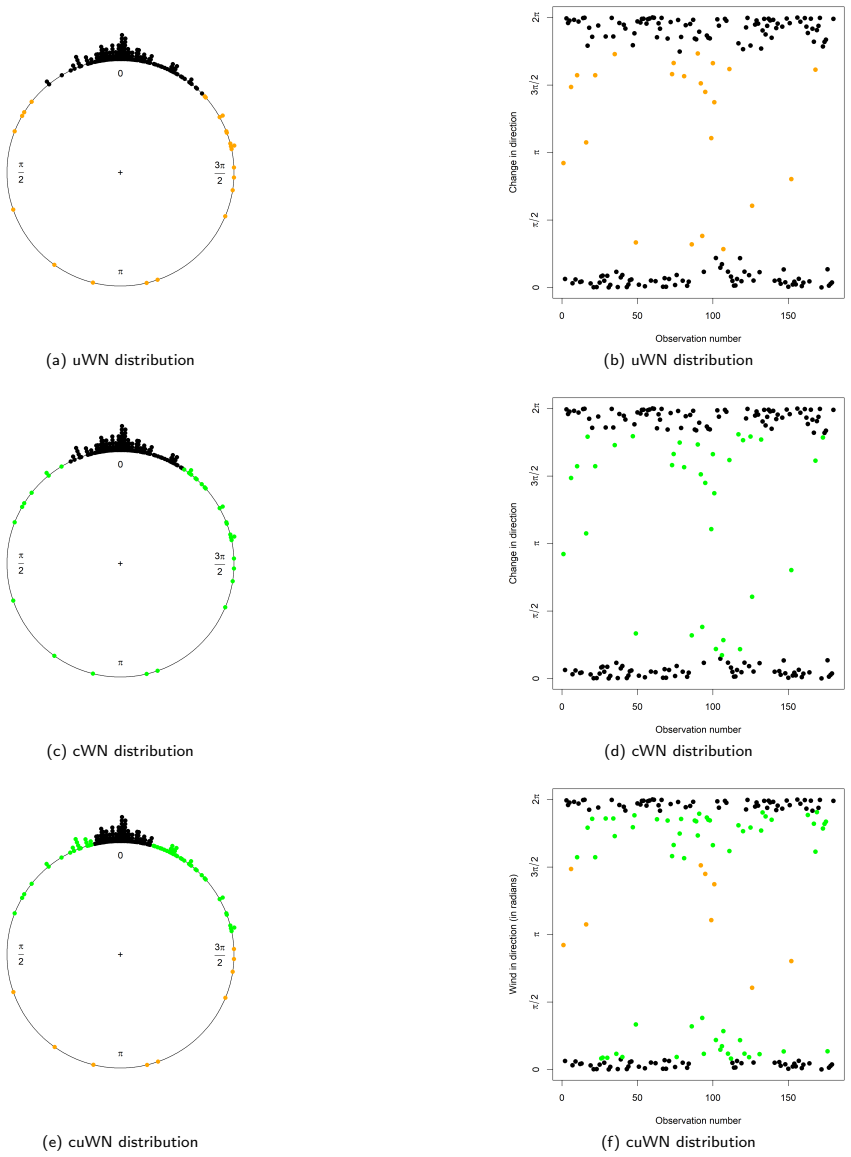
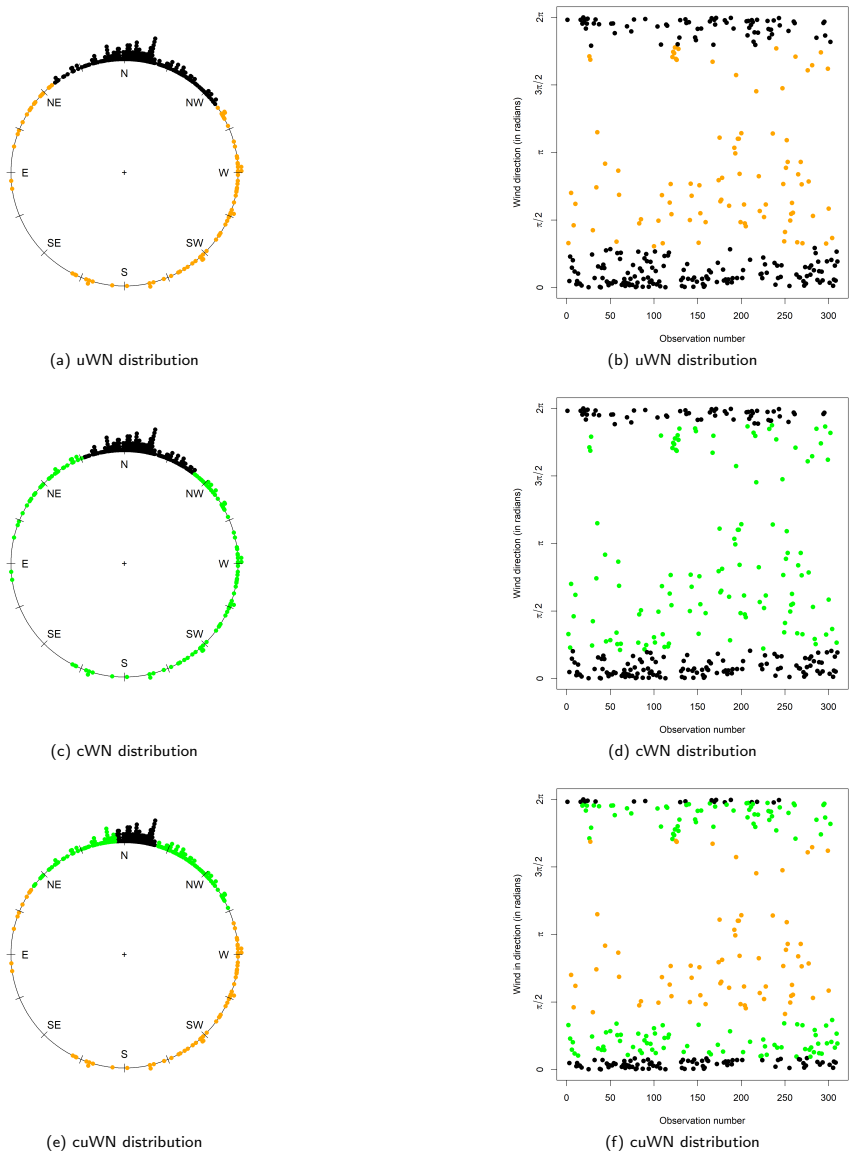
In this paper, we propose a model-based framework to robustify inference for circular data in the presence of anomalous observations, distinguishing between mild and gross anomalies. Starting from a unimodal and symmetric reference model on $[0,2\pi)$, parametrized by a mean direction and concentration, we construct a family of finite mixtures: a gross-anomaly model obtained by adding a circular uniform component; a mild-anomaly (contaminated) model obtained by mixing the reference distribution with a less concentrated version sharing the same mean direction; and a general three-component specification combining both models, the double-contaminated model. Posterior component probabilities provide an automatic classification of observations without ad hoc thresholds, while the mixing weights yield interpretable measures of anomaly prevalence and dispersion inflation. For illustration, we consider two classical circular reference distributions, the wrapped normal and von Mises. The methodology is evaluated through an extensive simulation study and three real-data applications involving animal movement directions and wind directions. The results indicate that jointly modelling mild and gross departures improves model fit and yields an informative decomposition of the directional data, demonstrating that mixture-based robustness is valuable not only for anomaly detection but also for the interpretation and the identification of latent structure in directional data.
Editorial analysis
A structured set of objections, weighed in public.
Referee Report
Summary. The paper proposes a model-based framework for robust inference on circular data by distinguishing mild and gross anomalies via finite mixture models. Starting from a unimodal symmetric reference distribution (von Mises or wrapped normal) parametrized by mean direction and concentration, it constructs a gross-anomaly model by adding a uniform component, a mild-anomaly model by mixing with a less concentrated version sharing the same mean, and a three-component double-contaminated model combining both. Posterior component probabilities enable automatic classification, while mixing weights provide measures of anomaly prevalence; the approach is illustrated on simulations and three real datasets (animal movement and wind directions), with the claim that joint modelling improves fit and yields an informative decomposition of latent structure.
Significance. If the central claims hold after addressing identifiability, the work would provide a principled extension of mixture-based robustness to directional data, enabling both anomaly detection and interpretable decomposition into mild versus gross departures. This could be valuable for applications in ecology and environmental science where distinguishing anomaly types aids interpretation beyond mere outlier removal.
major comments (2)
- [§2 (model construction)] §2 (model construction): the three-component double-contaminated model is defined by mixing the reference f(·; μ, κ), a mild component f(·; μ, κ') with κ' < κ, and a uniform gross component. When the fitted κ' approaches zero the mild and gross components become nearly indistinguishable, risking label-switching and unstable posterior probabilities. This directly threatens the abstract's claim that the model 'yields an informative decomposition' of mild versus gross anomalies, as opposed to simply improving in-sample fit via extra parameters. The manuscript must either impose identifiability constraints (e.g., κ' ≥ δ > 0) or demonstrate via targeted simulations that posterior classification remains reliable when κ' is small.
- [Simulation study and real-data sections] Simulation study and real-data sections: the abstract states that 'jointly modelling mild and gross departures improves model fit and yields an informative decomposition,' yet the provided text supplies no numerical results, recovery rates for mixing weights, or comparisons of posterior component stability across scenarios where κ' is near zero. Without such evidence the support for the decomposition claim cannot be verified and the weakest assumption (that mild anomalies are adequately captured by a less concentrated component sharing exactly the same mean) remains untested under boundary conditions.
minor comments (2)
- [Abstract] The abstract would benefit from a brief statement of the key numerical findings (e.g., improvement in log-likelihood or classification accuracy) from the simulation study and the three real-data examples.
- [Model specification] Notation for the concentration parameters (κ vs. κ') should be introduced with an explicit statement of the ordering constraint κ' < κ to avoid ambiguity in the mild-anomaly component definition.
Simulated Author's Rebuttal
We thank the referee for the thoughtful and constructive report. The two major comments raise important issues regarding identifiability and empirical support for the decomposition claims. We address each point below and outline the revisions we will make.
read point-by-point responses
-
Referee: [§2 (model construction)] §2 (model construction): the three-component double-contaminated model is defined by mixing the reference f(·; μ, κ), a mild component f(·; μ, κ') with κ' < κ, and a uniform gross component. When the fitted κ' approaches zero the mild and gross components become nearly indistinguishable, risking label-switching and unstable posterior probabilities. This directly threatens the abstract's claim that the model 'yields an informative decomposition' of mild versus gross anomalies, as opposed to simply improving in-sample fit via extra parameters. The manuscript must either impose identifiability constraints (e.g., κ' ≥ δ > 0) or demonstrate via targeted simulations that posterior classification remains reliable when κ' is small.
Authors: We agree that the risk of label-switching when κ' approaches zero is a substantive concern that could weaken the interpretability of the mild-versus-gross decomposition. In the revised manuscript we will impose a lower bound κ' ≥ 0.1 during estimation (implemented via constrained optimization) and will add a brief discussion of this constraint in Section 2. We will also include a small set of targeted simulations that deliberately set the true κ' close to the boundary and report posterior classification accuracy and mixing-weight recovery under those conditions. revision: yes
-
Referee: [Simulation study and real-data sections] Simulation study and real-data sections: the abstract states that 'jointly modelling mild and gross departures improves model fit and yields an informative decomposition,' yet the provided text supplies no numerical results, recovery rates for mixing weights, or comparisons of posterior component stability across scenarios where κ' is near zero. Without such evidence the support for the decomposition claim cannot be verified and the weakest assumption (that mild anomalies are adequately captured by a less concentrated component sharing exactly the same mean) remains untested under boundary conditions.
Authors: The existing simulation study reports overall model-fit improvements and mixing-weight recovery across a range of contamination levels, but we acknowledge that it does not contain the specific boundary-case experiments requested (κ' near zero, posterior stability metrics). We will add these targeted simulation results, including recovery rates and classification stability tables, to the revised simulation section. The real-data analyses already contain posterior-probability summaries; we will augment them with the same stability diagnostics where relevant. revision: yes
Circularity Check
Explicit mixture construction; no load-bearing reduction to fitted inputs
full rationale
The paper defines its double-contaminated model by direct construction: a three-component mixture of the reference distribution, a less-concentrated version sharing the mean direction, and a uniform component. Posterior probabilities and mixing weights are then computed from the fitted model as outputs. No equation equates a claimed result (e.g., anomaly decomposition) back to the mixing weights by definition, no self-citation supplies a uniqueness theorem, and no fitted parameter is relabeled as an independent prediction. The central claim therefore rests on the explicit parametric form rather than on circular re-use of its own fitted values.
Axiom & Free-Parameter Ledger
free parameters (2)
- mixing weights
- concentration parameters
axioms (1)
- domain assumption Reference distribution is unimodal and symmetric on [0,2π)
Reference graph
Works this paper leans on
-
[1]
Econometrics and Statistics , volume=
A tractable, parsimonious and flexible model for cylindrical data, with applications , author=. Econometrics and Statistics , volume=. 2017 , publisher=
2017
-
[2]
Statistical Papers , volume=
Sine-skewed circular distributions , author=. Statistical Papers , volume=. 2011 , publisher=
2011
-
[3]
Biometrika , volume=
A tractable and interpretable four-parameter family of unimodal distributions on the circle , author=. Biometrika , volume=. 2015 , publisher=
2015
-
[4]
Bernoulli , pages=
An extended family of circular distributions related to wrapped Cauchy distributions via Brownian motion , author=. Bernoulli , pages=. 2013 , publisher=
2013
-
[5]
A family of distributions on the circle with links to, and applications arising from, M
Kato, Shogo and Jones, MC , journal=. A family of distributions on the circle with links to, and applications arising from, M. 2010 , publisher=
2010
-
[6]
Ecological Indicators , volume=
Circular distributions of fallen logs as an indicator of forest disturbance regimes , author=. Ecological Indicators , volume=. 2012 , publisher=
2012
-
[7]
2017 , publisher=
Modern Directional Statistics , author=. 2017 , publisher=
2017
-
[8]
and Neuh
Pewsey, A. and Neuh. Circular Statistics in. 2013 , publisher=
2013
-
[9]
2013 , publisher=
Outlier Analysis , author=. 2013 , publisher=
2013
-
[10]
2015 , volume=
Robust Cluster Analysis and Variable Selection , author=. 2015 , volume=
2015
-
[11]
Journal of the American Statistical Association , volume=
The identification of multiple outliers , author=. Journal of the American Statistical Association , volume=. 1993 , publisher=
1993
-
[12]
2013 , publisher=
Identification of Outliers , author=. 2013 , publisher=
2013
-
[13]
Journal of Applied Statistics , volume=
Dichotomous unimodal compound models: application to the distribution of insurance losses , author=. Journal of Applied Statistics , volume=. 2020 , publisher=
2020
-
[14]
2011 , publisher=
Robust Statistics , author=. 2011 , publisher=
2011
-
[15]
Journal of Classification , year =
Melnykov, Yana , title =. Journal of Classification , year =
-
[16]
, title =
Lim, Heeju and Ordoñez, José Alejandro and Punzo, Antonio and Lachos, Victor H. , title =. Journal of Computational and Graphical Statistics , year =
-
[17]
Fr\"uhwirth-Schnatter, Sylvia , title =
-
[18]
Journal of Classification , year =
Zhang, Yingying and Melnykov, Volodymyr and Melnykov, Igor , title =. Journal of Classification , year =
-
[19]
Statistics and Probability Letters , year =
Dong, Aqi and Melnykov, Volodymyr , title =. Statistics and Probability Letters , year =
-
[20]
2009 , publisher=
Directional Statistics , author=. 2009 , publisher=
2009
-
[21]
Metrika , volume=
The large-sample joint distribution of key circular statistics , author=. Metrika , volume=. 2004 , publisher=
2004
-
[22]
Mixture models, outliers, and the
Aitkin, Murray and Wilson, Granville Tunnicliffe , journal=. Mixture models, outliers, and the. 1980 , publisher=
1980
-
[23]
Journal of classification , volume=
Fixed point clusters for linear regression: computation and comparison , author=. Journal of classification , volume=. 2002 , publisher=
2002
-
[24]
1994 , publisher=
Outliers in statistical data , author=. 1994 , publisher=
1994
-
[25]
Journal of the American Statistical Association , volume=
The masking breakdown point of multivariate outlier identification rules , author=. Journal of the American Statistical Association , volume=. 1999 , publisher=
1999
-
[26]
Statistics in Transition , volume=
Clustering methods: From classical models to new approaches , author=. Statistics in Transition , volume=
-
[27]
Gallegos, Mar. Trimmed. Sankhy. 2009 , publisher=
2009
-
[28]
2014 , publisher=
Robust cluster analysis and variable selection , author=. 2014 , publisher=
2014
-
[29]
Trimmed k -means:
Cuesta-Albertos, Juan Antonio and Gordaliza, Alfonso and Matr. Trimmed k -means:. The Annals of Statistics , volume=. 1997 , publisher=
1997
-
[30]
2005 , journal=
A robust method for cluster analysis , author=. 2005 , journal=
2005
-
[31]
Journal of Computational and Graphical Statistics , volume=
Trimming tools in exploratory data analysis , author=. Journal of Computational and Graphical Statistics , volume=. 2003 , publisher=
2003
-
[32]
The Annals of Statistics , volume=
A general trimming approach to robust cluster Analysis , author=. The Annals of Statistics , volume=
-
[33]
Advances in Data Analysis and Classification , volume=
A review of robust clustering methods , author=. Advances in Data Analysis and Classification , volume=. 2010 , publisher=
2010
-
[34]
Advances in Data Analysis and Classification , volume=
The influence function of the TCLUST robust clustering procedure , author=. Advances in Data Analysis and Classification , volume=. 2012 , publisher=
2012
-
[35]
Journal of the Royal Statistical Society: Series C (Applied Statistics) , volume=
Outliers in circular data , author=. Journal of the Royal Statistical Society: Series C (Applied Statistics) , volume=. 1980 , publisher=
1980
-
[36]
Robust estimation of the concentration parameter of the von
Ko, Daijin , journal=. Robust estimation of the concentration parameter of the von. 1992 , publisher=
1992
-
[37]
Book of the Short Papers-SIS 2023 Ancona , pages=
Anomaly detection in Circular Data , author=. Book of the Short Papers-SIS 2023 Ancona , pages=. 2023 , publisher=
2023
-
[38]
Communications in Statistics-Simulation and Computation , volume=
Statistics for a new test of discordance in circular data , author=. Communications in Statistics-Simulation and Computation , volume=. 2012 , publisher=
2012
-
[39]
Journal of Modern Applied Statistical Methods , volume=
Detection of outliers in univariate circular data using robust circular distance , author=. Journal of Modern Applied Statistical Methods , volume=
-
[40]
Communications in Statistics-Simulation and Computation , volume=
A new test of discordancy in circular data , author=. Communications in Statistics-Simulation and Computation , volume=. 2009 , publisher=
2009
-
[41]
Communications in Statistics-Simulation and Computation , volume=
A new discordancy test in circular data using spacings theory , author=. Communications in Statistics-Simulation and Computation , volume=. 2016 , publisher=
2016
-
[42]
Repository CRAN , volume=
Package ‘circular’ , author=. Repository CRAN , volume=
-
[43]
2001 , publisher=
Topics in Circular Statistics , author=. 2001 , publisher=
2001
-
[44]
Computational Statistics & Data Analysis , volume=
Robust estimation for circular data , author=. Computational Statistics & Data Analysis , volume=. 2007 , publisher=
2007
-
[45]
Jones, MC and Pewsey, Arthur , journal=. Inverse. 2012 , publisher=
2012
-
[46]
The Annals of Statistics , pages=
Identifiability of finite mixtures for directional data , author=. The Annals of Statistics , pages=. 1983 , publisher=
1983
-
[47]
Identifiability of finite mixtures-with applications to circular distributions , author=. Sankhy. 2004 , publisher=
2004
-
[48]
R: A language and environment for statistical computing
-
[49]
Choosing starting values for the
Biernacki, Christophe and Celeux, Gilles and Govaert, G. Choosing starting values for the. Computational Statistics & Data Analysis , volume=. 2003 , publisher=
2003
-
[50]
Biometrical Journal , volume=
Parsimonious mixtures of multivariate contaminated normal distributions , author=. Biometrical Journal , volume=. 2016 , publisher=
2016
-
[51]
Environmetrics , volume=
Modeling Bounded Count Environmental Data Using a Contaminated Beta-Binomial Regression Model , author=. Environmetrics , volume=. 2026 , publisher=
2026
-
[52]
1974 , publisher=
A new look at the statistical model identification , author=. 1974 , publisher=
1974
-
[53]
Estimating the dimension of a model , author=. The. 1978 , publisher=
1978
-
[54]
Model-based
Banfield, Jeffrey D and Raftery, Adrian E , journal=. Model-based. 1993 , publisher=
1993
-
[55]
Journal of Machine Learning Research , volume=
Consistency, breakdown robustness, and algorithms for robust improper maximum likelihood clustering , author=. Journal of Machine Learning Research , volume=
-
[56]
Estimation and computations for
Coretto, Pietro , journal=. Estimation and computations for. 2022 , publisher=
2022
-
[57]
Journal of Classification , volume=
On model-based clustering of directional data with heavy tails , author=. Journal of Classification , volume=. 2023 , publisher=
2023
-
[58]
Robust clustering in regression analysis via the contaminated
Punzo, Antonio and McNicholas, Paul D , journal=. Robust clustering in regression analysis via the contaminated. 2017 , publisher=
2017
-
[59]
Statistical Methods in Medical Research , volume=
A contaminated regression model for count health data , author=. Statistical Methods in Medical Research , volume=. 2025 , publisher=
2025
-
[60]
Statistics & Probability Letters , volume=
Contaminated Kent mixture model for clustering non-spherical directional data with heavy tails or scatter , author=. Statistics & Probability Letters , volume=. 2024 , publisher=
2024
-
[61]
Ecological Modelling , volume=
Investigation of ecologically relevant wind patterns on Marion Island using Computational Fluid Dynamics and measured data , author=. Ecological Modelling , volume=. 2022 , publisher=
2022
discussion (0)
Sign in with ORCID, Apple, or X to comment. Anyone can read and Pith papers without signing in.