REVIEW 4 major objections 4 minor 77 references
ALMA FACTS. II. Large Scale Variations in the 12CO(J=2-1) to 12CO(J=1-0) Line Ratio in Nearby Galaxies
T0 review · 4 major / 4 minor · reviewed 2026-08-15 · deepseek-v4-flash
Pith's one-line read Barred spiral galaxies show a roughly 20% decline in the CO line ratio inside the bar radius.
desk verdict A careful data paper with a new and plausible outlier-disk r21 effect, but the headline barred/unbarred bimodality is a post hoc visual split with no statistical support. read the letter →
The pith
A machine-rendered reading of the paper's core claim, the machinery that carries it, and where it could break.
The reading
What carries the argument
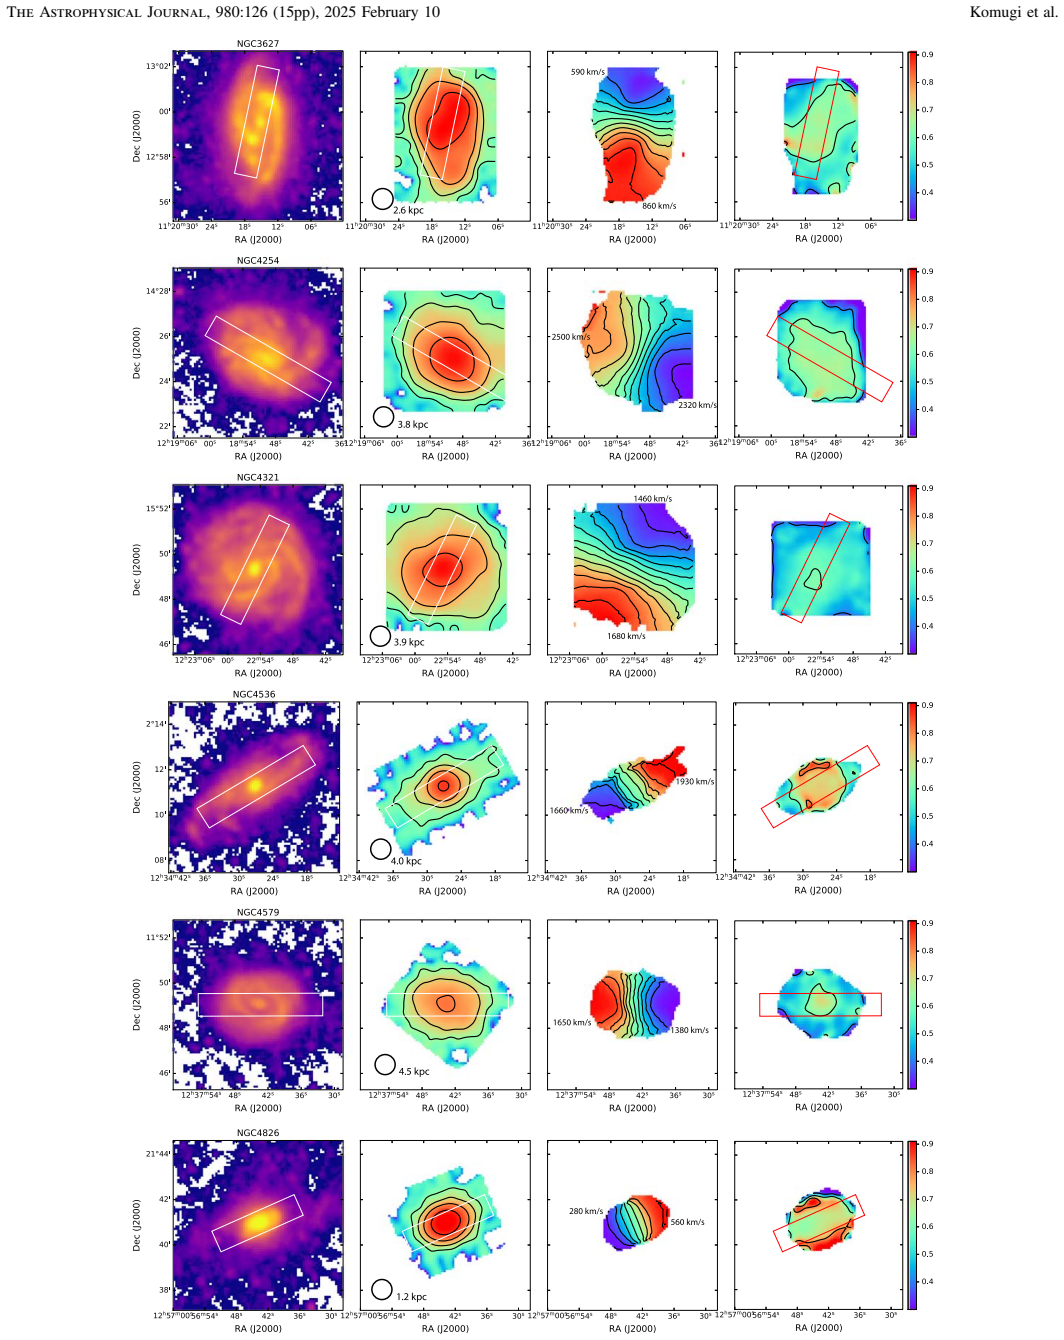
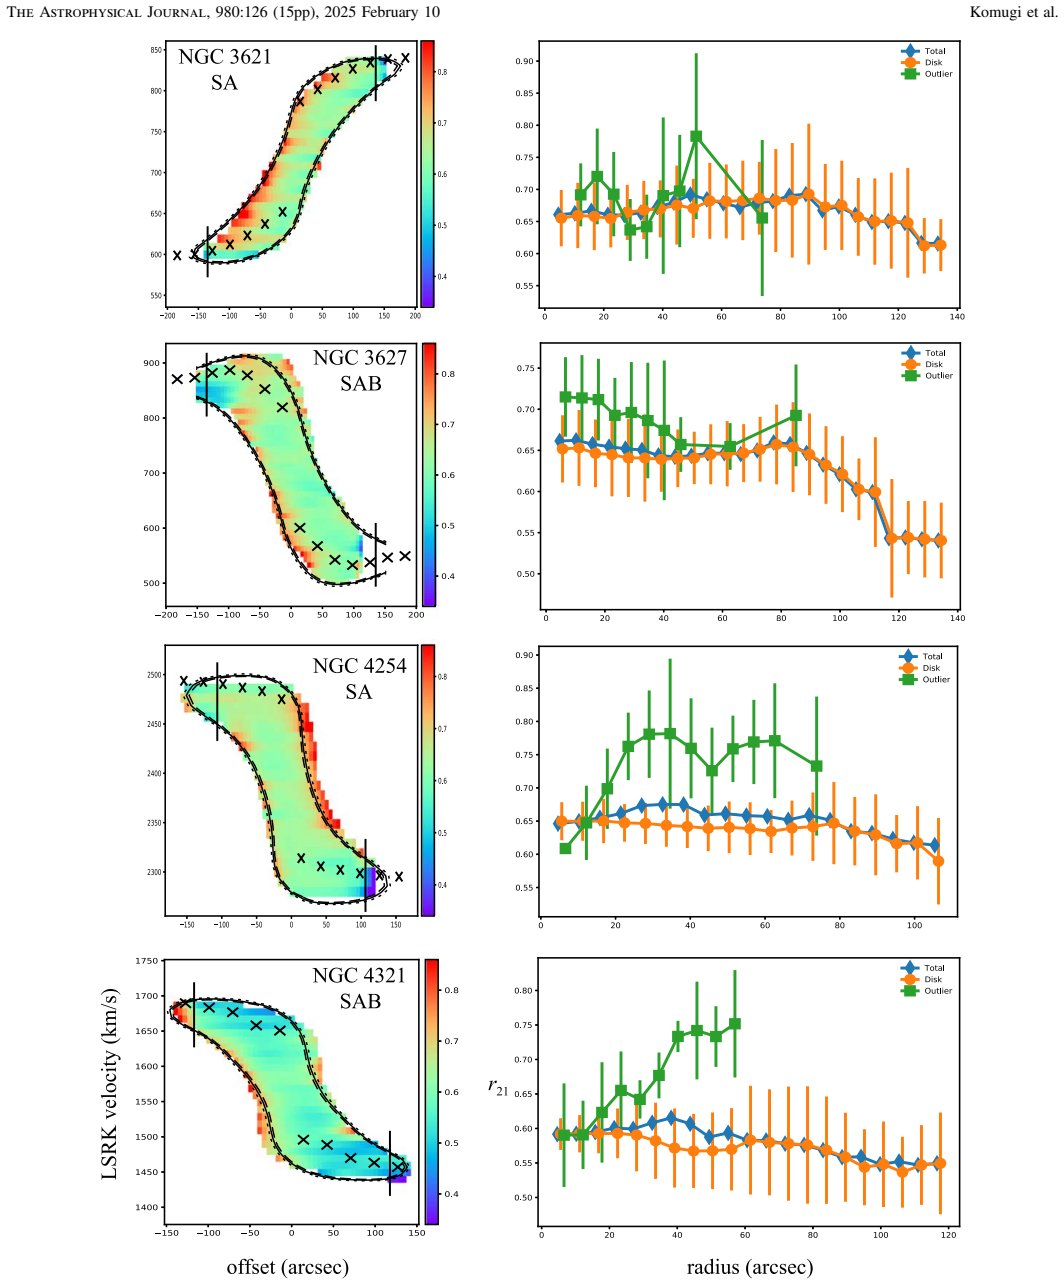
The central object is the line ratio $r_{21}=I_{\mathrm{CO}(2{-}1)}/I_{\mathrm{CO}(1{-}0)}$, measured from ALMA Total Power maps of CO(1–0) and matched CO(2–1) cubes, both smoothed to the same roughly 57 arcsecond beam. The key tool is the position–velocity diagram along the major axis, compared with a tilted-ring model of pure circular rotation fit to the CO(1–0) cube; the model contour at 30$\sigma$ (10$\sigma$ for two galaxies) defines the disk, and everything outside is a kinematic outlier. Radial profiles of the disk component, normalized to the central-beam value and to the optical radius $R_{25}$ or to the bar radius from the $m=2$ Fourier amplitude, are what expose the bimodal gradient. The load-bearing step is the assumption that this decomposition cleanly separates disk gas from non-circular components, so the radial profiles reflect the disk rather than contamination by nuclear or bar-driven gas.
What would settle it
A decisive test is to measure $r_{21}$ at about 100 parsec resolution along the bars of several SB galaxies using ALMA's 12 m array together with the Total Power array, and to model the gas kinematics with a bar-potential fit instead of a pure tilted ring. The bimodality claim predicts low $r_{21}$ throughout the bar and a rise near the bar ends; if the roughly 20% decline before 0.4 $R_{25}$ disappears or does not track the bar radius under that model, the claim fails.
Extended reading notes
Core claim
The central claim is that the radial gradient of $r_{21}$ is bimodal in nearby galaxies. After fitting a tilted-ring model to the CO(1–0) cube with the 3DBarolo code and using a 30$\sigma$ (or 10$\sigma$, for two galaxies) model contour to separate the rotating disk from kinematic outliers, the authors find two clearly separated classes: disks that keep $r_{21}$ constant or nearly flat out to 0.4 of the optical radius $R_{25}$, and disks that fall by about 20% before reaching 0.4 $R_{25}$, with the break located at the characteristic radius of the stellar bar. All SA galaxies fall in the flat class, all SB galaxies in the declining class, and the two SAB galaxies split between the classes. The same decomposition shows that kinematic outliers, gas at velocities that deviate from pure circular rotation, have systematically higher $r_{21}$ than the disk in every galaxy, with average values of 0.69 versus 0.62. The paper concludes that large-scale $r_{21}$ variation is real and morphology-dependent, not a calibration artifact, and is large enough to matter for molecular mass estimates made from CO(2–1) alone.
Load-bearing premise
The load-bearing premise is that the tilted-ring model fit to CO(1–0), with radial inflow and outflow forced to zero and a 10–30$\sigma$ contour threshold, cleanly separates the rotating disk from kinematic outliers, so the radial $r_{21}$ profiles of the disk are not biased by non-circular bar gas.
Editorial extensions
If this is right
- Surveys that observe only CO(2–1) and assume a constant $r_{21}$ will overestimate molecular gas surface density in the centers of barred galaxies and underestimate it at larger radii, flattening the apparent range of gas densities.
- The Schmidt–Kennicutt power-law index $N$ inferred from CO(2–1) at fixed $r_{21}$ will be systematically too low for barred galaxies; the paper's simple estimate turns $N=1$ into $N\simeq1.17$ when a radially varying $r_{21}$ is used.
- The absence of a difference in average $r_{21}$ between SA, SAB, and SB galaxies implies that the bar effect is not a global change in molecular gas excitation but a redistribution of the ratio with radius.
- Beyond the bar radius, even the steep-decline galaxies return to a shallow or constant $r_{21}$ gradient, so the morphology dependence is localized to the bar region and the central disk.
Reading between the lines
- If confirmed with a larger sample, the bimodality predicts that barred galaxies will appear to have systematically shallower radial CO(2–1) extent than unbarred galaxies of similar mass, because low-$r_{21}$ outer gas is undercounted relative to the center.
- A clean cross-check is available in existing data: the Schmidt–Kennicutt index for barred galaxies should be higher when molecular masses come from CO(1–0) than when they come from CO(2–1) at fixed ratio.
- The two SAB galaxies in the steep-gradient group, NGC 4536 and NGC 4579, are natural targets for high-resolution $r_{21}$ mapping: the bimodality picture predicts sub-kpc structure resembling SB galaxies, while the shallow-gradient SABs should resemble SA disks.
- Because barred and unbarred galaxies have different metallicity gradients, the net morphology dependence of inferred molecular gas fractions could partly cancel; separating the two requires abundance measurements along the same radii.
Signed reviews
Editorial analysis
A structured set of objections, weighed in public.
Referee Report
Summary. This paper presents ALMA Total Power observations of 12CO(J=1-0) for 12 nearby galaxies from the FACTS survey and compares them with archival ALMA TP 12CO(J=2-1) data at approximately 56 arcsecond resolution. After constructing ratio maps and major-axis position-velocity diagrams, the authors fit tilted-ring models to the CO(1-0) cubes with 3DBarolo, separate each galaxy into a rotating 'disk' component and a kinematic 'outlier' component, and measure the line ratio r21 in each component. They find that outliers have systematically higher r21 than the disk (Welch's t-test, Section 4.2), that the average r21 does not depend significantly on bar morphology, and that the radial gradient of the disk r21 is bimodal: galaxies classified as SA plus two SABs show constant or shallow gradients out to 0.4 R25, while all SB galaxies plus the remaining two SABs decline by about 20% within 0.4 R25, with the decline plausibly associated with the stellar bar radius. The paper also gives a crude estimate that a radially varying r21 would raise the Schmidt-Kennicutt index by about 20% for barred galaxies.
Significance. If the bimodal gradient is real, it is an important result: it would demonstrate that CO(2-1)/CO(1-0) varies systematically with bar morphology on kiloparsec scales, with direct implications for CO(2-1)-only molecular gas mass estimates and for the slope of the Schmidt-Kennicutt relation. The paper's strengths are its carefully documented ALMA TP calibration (execution-block scaling, ozone-line removal, propagation of flux uncertainties), its explicit separation of disk and outlier kinematic components, and the consistency of the global r21 values with earlier work. The data handling is transparent enough that the central claim can be tested, but that test is not currently supplied in the manuscript.
major comments (4)
- [Section 4.3, Figure 4] The headline bimodality is established only by visual inspection. No slope is fitted to the normalized radial profiles, the quoted ~20% decline is not accompanied by an uncertainty, and no statistical test compares the shallow-gradient group with the steep-gradient group. With n=11 and a grouping decided after inspecting the profiles, a chance separation is not excluded. Please add a quantitative definition of the two groups (for example, a fitted linear slope over 0-0.4 R25 with its uncertainty, or a likelihood-ratio/bimodality test) and report the resulting significance.
- [Section 4.1; Section 2; Table 1] The morphology grouping is sensitive to classification decisions that are not tested. NGC 3521 is moved from SAB to SA (Section 2), NGC 628 is excluded from the sample (Section 2), and Section 4.1 reports that lowering the disk/outlier threshold for NGC 4579 from 10 sigma to 5 sigma reclassifies the entire PV diagram as disk; NGC 4579 is in the steep-gradient group. Please show that the bimodality and its grouping survive these choices (for example, using RC3 classifications unchanged, or excluding NGC 4579), or soften the claim accordingly.
- [Section 4.1] The disk component itself may be contaminated by non-circular gas in barred galaxies because the tilted-ring model fixes radial inflow/outflow to zero and uses a sigma contour to separate disk from outliers. Since the bimodality claim is based solely on the disk r21 profiles, systematic mis-assignment of non-circular gas in bars could create or enhance the steep decline. I ask for a robustness check, for example refitting with radial motions allowed or with a different contour level, and showing that the disk r21 profiles are unchanged.
- [Figure 4, Section 4.3] Normalizing each profile by the value averaged over the central 28 arcseconds introduces correlated errors that are not propagated, and adjacent radial bins spaced by 5.6 arcseconds (one tenth of the beam) are not independent. The quoted ~20% decline needs an uncertainty that accounts for this covariance, and the central normalization should be checked against an alternative reference, such as a fitted intercept rather than a single-beam average.
minor comments (4)
- [Section 2.2] The beam size notation uses '56.6' without an arcsecond unit in several places; please standardize this as 56.6 arcseconds (or 56".6) throughout.
- [Section 4.4] The Schmidt-Kennicutt slope estimate contains garbled mathematics in the printed text: '~log 0.050.7 0.63' and '~log 0.10.63 0.5' appear to be missing fraction formatting. Please typeset these as log10(0.7/0.63) and log10(0.63/0.5), or equivalent.
- [Figure 2 caption] The caption says the right-hand panels show the radial change of r21, but it does not define the plotted error bars beyond 'standard deviation of the values on the PV diagram,' nor does it explain whether the disk+outlier values (blue diamonds) are area-weighted in the same way as the disk and outlier values. Please clarify.
- [Table 1] The footnote for NGC 3521 contains a typo, 'treat is as a nonbarred SA,' which should read 'treat it as a nonbarred SA.'
Circularity Check
No significant circularity: r21 values are direct ALMA measurements; the disk/outlier split and bimodal gradient are empirical classifications, not fitted predictions.
full rationale
The central observable r21 is formed by direct division of calibrated ALMA TP data cubes (Section 3.3) and is not the output of any fitted model. The 3DBarolo tilted-ring fit to the CO10 cube (Section 4.1) serves only to define a mask separating 'disk' from 'outlier' components; the r21 values inside each component are still measured from the data. The paper itself flags the threshold dependence: 'The S/N cuts used above are somewhat arbitrary' and notes that for NGC 4579 lowering the threshold reclassifies the whole PV diagram as disk; this is a robustness limitation, not circularity, because the line ratio is not derived from the model. Similarly, Section 4.2 acknowledges that the high end of the disk r21 distribution 'is likely due to our somewhat arbitrary distinction between the kinematic components,' which affects the disk/outlier comparison but does not make r21 a fitted prediction. The bimodal radial-gradient claim in Section 4.3 is a visual/empirical grouping of the measured normalized profiles without a slope fit or significance test; that is a statistical-support concern, not a circular reduction. Interpretive citations to the authors' own earlier galaxy studies (Koda et al. 2020; Egusa et al. 2022; Maeda et al. 2022) are independent observations of different targets and are not load-bearing for the derivation. The Schmidt-Kennicutt index estimate in Section 4.4 is explicitly labeled 'a very crude estimate' and is arithmetic applied to the measured gradient, not a fit. No step in the paper's derivation chain reduces by construction to its own inputs.
Assumptions & free parameters
free parameters (4)
- Disk/outlier PV contour threshold =
30 sigma (10 sigma for NGC 1512 and NGC 4579)
- PV ratio S/N threshold =
20 sigma (10 sigma for NGC 1512 and NGC 4579)
- Central normalization radius for r21 =
28 arcsec (one beam radius)
- Radial bin width =
5.6 arcsec (pixel size, one tenth of the beam)
assumptions (4)
- domain assumption Galaxy disks can be described by tilted-ring models with pure circular rotation and zero radial inflow/outflow.
- domain assumption ALMA absolute flux calibration uncertainty is 2.4% and common-mode systematic errors cancel when comparing r21 across galaxies.
- domain assumption After smoothing the CO(2-1) map to the CO(1-0) beam, the two lines trace the same emitting gas within each beam.
- domain assumption The RC3 morphological classifications, with NGC 3521 reassigned from SABbc to SA, correctly identify which galaxies harbor stellar bars.
Cite this review
Pith. "Pith review of ALMA FACTS. II. Large Scale Variations in the 12CO(J=2-1) to 12CO(J=1-0) Line Ratio in Nearby Galaxies." pith.science (2026). https://pith.science/paper/ZWBGKQXW
@misc{pith2026250508912,
  author       = {Pith},
  title        = {Pith review of: ALMA FACTS. II. Large Scale Variations in the 12CO(J=2-1) to 12CO(J=1-0) Line Ratio in Nearby Galaxies},
  year         = {2026},
  howpublished = {\url{https://pith.science/paper/ZWBGKQXW}},
  note         = {Machine review of arXiv:2505.08912}
}
read the original abstract
We present 12CO(J=1-0) mapping observations over ~1/2 of the optical disk of 12 nearby galaxies from the Fundamental CO 1-0 Transition Survey of nearby galaxies (FACTS), using the ALMA Total Power array. Variations in the 12CO(J=2-1)/12CO(J=1-0) line ratio r21 are investigated. The luminosity-weighted r21 of the 11 sample galaxies ranges from 0.52 to 0.69 with an average of 0.61. We use position-velocity diagrams along the major axis and tilted ring models to separate the normal rotating galactic disk from kinematic outliers that deviate from pure circular rotation. We find that r21 is systematically higher in outliers compared to the disk. We compare r21 between SA, SAB and SB galaxies, and find no significant difference in the average r21 depending on the presence of galactic bars. We find, however, that the radial gradient in r21 is bimodal, where a group containing all SA galaxies prefer constant or very shallow r21 gradients out 40% of the optical radius, while another group containing all SB galaxies have a steep r21 gradient, decreasing by ~20% before 40% of the optical radius, which also corresponds to the radius of the stellar bar. After this radius, these galaxies become consistent with a constant or shallow trend in r21. The large scale trend in r21 can have implications for how we interpret observations made solely in the 12CO(J=2-1) line.
Figures


Figures from the paper (4 more)


Reference graph
Works this paper leans on
- [1]
- [2]
- [3]
-
[4]
2008, AJ, 136, 2846
Bigiel, F., Leroy, A., Walter, F., et al. 2008, AJ, 136, 2846
2008
-
[5]
Bigiel, F., Leroy, A. K., Walter, F., et al. 2011, ApJL, 730, L13
work page 2011
-
[6]
Bolatto, A. D., Wol fire, M., & Leroy, A. K. 2013, ARA&A, 51, 207
work page 2013
- [7]
- [8]
Show all 77 references
-
[9]
J., Sheth, K., Athanassoula, E., et al
Buta, R. J., Sheth, K., Athanassoula, E., et al. 2015, ApJS, 217, 32 CASA Team, Bean, B., Bhatnagar, S., et al. 2022, PASP, 134, 114501
2015
-
[10]
P., & Turner, J
Crosthwaite, L. P., & Turner, J. L. 2007, AJ, 134, 1827 den Brok, J. S., Chatzigiannakis, D., Bigiel, F., et al. 2021, MNRAS, 504, 3221 den Brok, J. S., Leroy, A. K., Usero, A., et al. 2023, MNRAS, 526, 6347 de Vaucouleurs, G., de Vaucouleurs, A., Corwin, H. G., J., et al. 199...
2007
-
[11]
2022, ApJ, 935, 64
Egusa, F., Gao, Y., Morokuma-Matsui, K., Liu, G., & Maeda, F. 2022, ApJ, 935, 64
2022
-
[12]
F., Heithausen, A., et al
Falgarone, E., Panis, J. F., Heithausen, A., et al. 1998, A&A, 331, 669
1998
-
[13]
S., Partridge, B., Kneissl, R., et al
Farren, G. S., Partridge, B., Kneissl, R., et al. 2021, ApJS, 256, 19
2021
-
[14]
L., Madore, B
Freedman, W. L., Madore, B. F., Gibson, B. K., et al. 2001, ApJ, 553, 47
2001
-
[15]
M., Stutzki, J., & Winnewisser, G
Gierens, K. M., Stutzki, J., & Winnewisser, G. 1992, A&A, 259, 271
1992
-
[16]
1974, ApJ, 189, 441
Goldreich, P., & Kwan, J. 1974, ApJ, 189, 441
1974
-
[17]
1993, in AIP Conf
Handa, T., Hasegawa, T., Hayashi, M., et al. 1993, in AIP Conf. Ser. 278, Back to the Galaxy, ed. S. S. Holt & F. Verter (Melville, NY: AIP ), 315 Hatchfield, H. P., Sormani, M. C., Tress, R. G., et al. 2021, ApJ, 922, 79
1993
-
[18]
K., Bel fiore, F., Lelli, F., et al
Hunt, L. K., Bel fiore, F., Lelli, F., et al. 2023, A&A, 675, A64
2023
-
[19]
2009, PASJ, 61, 1
Iguchi, S., Morita, K.-I., Sugimoto, M., et al. 2009, PASJ, 61, 1
2009
-
[20]
D., Yun, M
Iono, D., Wilson, C. D., Yun, M. S., et al. 2009, ApJ, 695, 1537
2009
-
[21]
Israel, F. P. 1997, A&A, 328, 471
1997
-
[22]
2021, MNRAS, 504, 2360
Jiao, Q., Gao, Y., & Zhao, Y. 2021, MNRAS, 504, 2360
2021
-
[23]
K., Chikada, Y., et al
Kamazaki, T., Okumura, S. K., Chikada, Y., et al. 2012, PASJ, 64, 29
2012
- [24]
-
[25]
C., J., Armus, L., Bendo, G., et al
Kennicutt, R. C., J., Armus, L., Bendo, G., et al. 2003, PASP, 115, 928
2003
-
[26]
C., Calzetti, D., Aniano, G., et al
Kennicutt, R. C., Calzetti, D., Aniano, G., et al. 2011, PASP, 123, 1347
2011
-
[27]
2023, ApJ, 949, 108
Koda, J., Hirota, A., Egusa, F., et al. 2023, ApJ, 949, 108
2023
-
[28]
2020, ApJL, 890, L10
Koda, J., Sawada, T., Sakamoto, K., et al. 2020, ApJL, 890, L10
2020
-
[29]
2012, ApJ, 761, 41
Koda, J., Scoville, N., Hasegawa, T., et al. 2012, ApJ, 761, 41
2012
-
[30]
2002, A&A, 396, 867
Koda, J., & Wada, K. 2002, A&A, 396, 867
2002
-
[31]
2023, PASJ, 75, 1337
Komugi, S., Inaba, M., & Shindou, T. 2023, PASJ, 75, 1337
2023
-
[32]
2007, PASJ, 59, 55
Komugi, S., Kohno, K., Tosaki, T., et al. 2007, PASJ, 59, 55
2007
-
[33]
E., Kuno, N., & Tosaki, T
Komugi, S., Miura, R. E., Kuno, N., & Tosaki, T. 2018, PASJ, 70, 48
2018
-
[34]
2005, PASJ, 57, 733
Komugi, S., Sofue, Y., Nakanishi, H., Onodera, S., & Egusa, F. 2005, PASJ, 57, 733
2005
-
[35]
2012, ApJ, 757, 138
Komugi, S., Tateuchi, K., Motohara, K., et al. 2012, ApJ, 757, 138
2012
-
[36]
2011, PASJ, 63, L1
Komugi, S., Yasui, C., Kobayashi, N., et al. 2011, PASJ, 63, L1
2011
-
[37]
2007, PASJ, 59, 117
Kuno, N., Sato, N., Nakanishi, H., et al. 2007, PASJ, 59, 117
2007
-
[38]
E., Rosolowsky, E., et al
Lang, P., Meidt, S. E., Rosolowsky, E., et al. 2020, ApJ, 897, 122
2020
-
[39]
M., Koda, J., Hirota, A., Egusa, F., & Heyer, M
Lee, A. M., Koda, J., Hirota, A., Egusa, F., & Heyer, M. 2024, ApJ, 968, 97
2024
-
[40]
K., Bolatto, A., Gordon, K., et al
Leroy, A. K., Bolatto, A., Gordon, K., et al. 2011, ApJ, 737, 12
2011
-
[41]
K., Rosolowsky, E., Usero, A., et al
Leroy, A. K., Rosolowsky, E., Usero, A., et al. 2022, ApJ, 927, 149
2022
-
[42]
K., Schinnerer, E., Hughes, A., et al
Leroy, A. K., Schinnerer, E., Hughes, A., et al. 2021, ApJS, 257, 43
2021
-
[43]
K., Walter, F., Brinks, E., et al
Leroy, A. K., Walter, F., Brinks, E., et al. 2008, AJ, 136, 2782
2008
-
[44]
2011, ApJ, 735, 63
Liu, G., Koda, J., Calzetti, D., Fukuhara, M., & Momose, R. 2011, ApJ, 735, 63
2011
-
[45]
2023, ApJ, 943, 7
Maeda, F., Egusa, F., Ohta, K., Fujimoto, Y., & Habe, A. 2023, ApJ, 943, 7
2023
-
[46]
2022, ApJ, 926, 96
Maeda, F., Egusa, F., Ohta, K., et al. 2022, ApJ, 926, 96
2022
-
[47]
2020, MNRAS, 495, 3840
Maeda, F., Ohta, K., Fujimoto, Y., Habe, A., & Ushio, K. 2020, MNRAS, 495, 3840
2020
-
[48]
2014, A&A, 570, A13
Makarov, D., Prugniel, P., Terekhova, N., Courtois, H., & Vauglin, I. 2014, A&A, 570, A13
2014
-
[49]
McQuinn, K. B. W., Skillman, E. D., Dolphin, A. E., Berg, D., & Kennicutt, R. 2017, AJ, 154, 51
2017
-
[50]
C., J., et al
Momose, R., Koda, J., Kennicutt, R. C., J., et al. 2013, ApJL, 772, L13
2013
-
[51]
2007, PASJ, 59, 43
Muraoka, K., Kohno, K., Tosaki, T., et al. 2007, PASJ, 59, 43
2007
-
[52]
2016, PASJ, 68, 89
Muraoka, K., Sorai, K., Kuno, N., et al. 2016, PASJ, 68, 89
2016
-
[53]
2015, ApJS, 216, 18
Nishimura, A., Tokuda, K., Kimura, K., et al. 2015, ApJS, 216, 18
2015
-
[54]
1998, ApJ, 493, 730
Oka, T., Hasegawa, T., Hayashi, M., Handa, T., & Sakamoto, S. 1998, ApJ, 493, 730
1998
-
[55]
2023, A&A, 673, A147
Pessa, I., Schinnerer, E., Sanchez-Blazquez, P., et al. 2023, A&A, 673, A147
2023
-
[56]
2016, MNRAS, 456, 4128
Rahmani, S., Lianou, S., & Barmby, P. 2016, MNRAS, 456, 4128
2016
-
[57]
W., Sheth, K., & Vogel, S
Regan, M. W., Sheth, K., & Vogel, S. N. 1999, ApJ, 526, 97
1999
-
[58]
H., Lockhart, I
Rogstad, D. H., Lockhart, I. A., & Wright, M. C. H. 1974, ApJ, 193, 309
1974
-
[59]
1997, ApJ, 486, 276
Sakamoto, S., Hasegawa, T., Handa, T., Hayashi, M., & Oka, T. 1997, ApJ, 486, 276
1997
-
[60]
1994, ApJ, 425, 641
Sakamoto, S., Hayashi, M., Hasegawa, T., Handa, T., & Oka, T. 1994, ApJ, 425, 641
1994
-
[61]
M., Leroy, A
Sandstrom, K. M., Leroy, A. K., Walter, F., et al. 2013, ApJ, 777, 5
2013
-
[62]
2021, PASP, 133, 034504
Sawada, T., Chang, C.-S., Francke, H., et al. 2021, PASP, 133, 034504
2021
-
[63]
2001, ApJS, 136, 189
Sawada, T., Hasegawa, T., Handa, T., et al. 2001, ApJS, 136, 189
2001
-
[64]
K., Walter, F., et al
Schruba, A., Leroy, A. K., Walter, F., et al. 2011, AJ, 142, 37
2011
-
[65]
Schwab, F. R. 1980, Proc. SPIE , 231, 18
1980
-
[66]
Schwab, F. R. 1984, in Indirect Imaging. Measurement and Processing for Indirect Imaging, ed. J. A. Roberts (Cambridge: Cambridge Univ. Press), 333
1984
-
[67]
Z., & Solomon, P
Scoville, N. Z., & Solomon, P. M. 1974, ApJL, 187, L67
1974
-
[68]
2011, ApJ, 733, 87
Shi, Y., Helou, G., Yan, L., et al. 2011, ApJ, 733, 87
2011
-
[69]
2019, PASJ, 71, S14
Sorai, K., Kuno, N., Muraoka, K., et al. 2019, PASJ, 71, S14
2019
-
[70]
C., Barnes, A
Sormani, M. C., Barnes, A. T., Sun, J., et al. 2023, MNRAS, 523, 2918
2023
-
[71]
G., Sormani, M
Tress, R. G., Sormani, M. C., Glover, S. C. O., et al. 2020, MNRAS, 499, 4455
2020
-
[72]
B., Courtois, H
Tully, R. B., Courtois, H. M., Dolphin, A. E., et al. 2013, AJ, 146, 86
2013
-
[73]
B., Courtois, H
Tully, R. B., Courtois, H. M., & Sorce, J. G. 2016, AJ, 152, 50 van der Tak, F. F. S., Black, J. H., Schöier, F. L., Jansen, D. J., & van Dishoeck, E. F. 2007, A&A, 468, 627
2016
-
[74]
B., & Edmunds, M
Vila-Costas, M. B., & Edmunds, M. G. 1992, MNRAS, 259, 121
1992
-
[75]
Wilson, C. D. 1995, ApJL, 448, L97
1995
-
[76]
2021, PASJ, 73, 257
Yajima, Y., Sorai, K., Miyamoto, Y., et al. 2021, PASJ, 73, 257
2021
-
[77]
C., Jr., Huchra, J
Zaritsky, D., Kennicutt, R. C., Jr., Huchra, J. P., et al. 1994, ApJ, 420, 87 15 The Astrophysical Journal, 980:126 (15pp), 2025 February 10 Komugi et al
1994
Reviewed August 15, 2026 · model on record in the stance chip above.
Discussion (0). Continue with ORCID to comment.