REVIEW 3 major objections 3 minor 1 cited by
Two-zone emission modeling of PKS 1510-089 during the high state of 2015
T0 review · 3 major / 3 minor · reviewed 2026-08-14 · deepseek-v4-flash
Pith's one-line read In the 2015 high state of blazar PKS 1510-089, gamma-ray and optical/UV emission come from a blob at the outer edge of the broad line region, while X-rays come from a second blob in the dusty torus.
desk verdict The 2015 data reduction and SED fits are useful, but the two-zone BLR/DT location claim fails on a units error in Eq. 3, so the paper needs major revision before it can be taken seriously. read the letter →
The pith
A machine-rendered reading of the paper's core claim, the machinery that carries it, and where it could break.
The reading
What carries the argument
The core machinery is a two-zone time-dependent spectral energy distribution model built on GAMERA, a publicly available code that evolves an injected electron spectrum under synchrotron, synchrotron self-Compton, and external Compton losses using the full Klein–Nishina cross section. The two zones are placed along the jet with the flux-doubling distance relation $d = c t_d \delta/((1+z)\theta_{\rm jet})$ and the radius scaling laws $R_{\rm BLR} = 10^{17} L_{d,45}^{1/2}$ cm and $R_{\rm DT} = 2.5\times10^{18} L_{d,45}^{1/2}$ cm, where $L_{d,45}$ is the disk luminosity in units of $10^{45}$ erg/s. The external radiation energy densities in the two zones are set by $U'_{\rm ext} = \Gamma^2 \xi_{\rm ext} L_{\rm disk}/(4\pi c R_{\rm ext}^2)$, with $\xi_{\rm BLR}=0.06$ and $\xi_{\rm DT}=0.12$, which fixes the seed photon fields that the relativistic electrons upscatter into the observed gamma-ray and X-ray bands.
What would settle it
Recomputing Eq. (3) with $\theta_{\rm jet} = 0.12^\circ$ expressed in radians ($\approx 2.09\times10^{-3}$ rad) yields a gamma-ray zone distance of about $1.0\times10^{19}$ cm and an X-ray zone distance of about $5.7\times10^{19}$ cm, both larger than the quoted $R_{\rm BLR} = 2.6\times10^{17}$ cm and $R_{\rm DT} = 6.47\times10^{18}$ cm; that single recalculation would decide whether the two-zone placement as concluded is viable.
Extended reading notes
Core claim
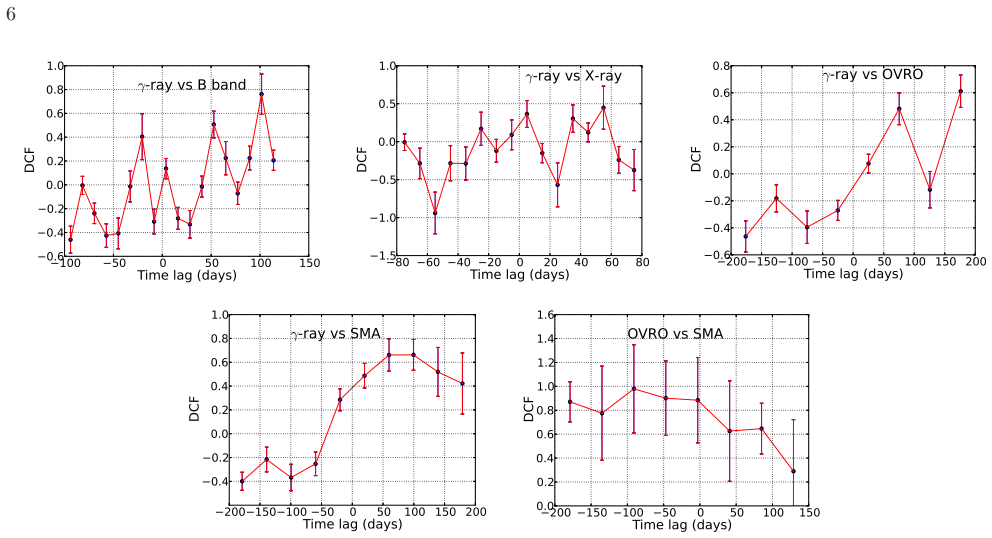
The central claim is that during the 2015 high state of PKS 1510-089, the gamma-ray and optical/UV emission originate in a single emission blob located at the outer edge of the broad line region (BLR), while the X-ray emission originates in a separate blob located farther out in the dusty torus (DT). Evidence comes from the measured flux doubling times, 10.6 hours in gamma rays versus 2.5 days in X-rays versus about 1 day in optical/UV bands, and from discrete correlation functions that show no strong or well-resolved correlation between gamma rays and X-rays. The authors place the blobs using the doubling-time distance formula together with BLR and DT radius scaling laws, then fit the multiwavelength spectral energy distributions of flares A, B, C, and D and quiescent state Q2 with the time-dependent code GAMERA, treating the BLR zone as the source of synchrotron and external-Compton emission for optical/UV and gamma rays and the DT zone as the source of X-rays.
Load-bearing premise
The load-bearing premise is that the jet half-opening angle $\theta_{\rm jet} = 0.12^\circ$ is used in radians in the distance formula $d = c t_d \delta / ((1+z)\theta_{\rm jet})$; if degrees are used instead, the inferred zone distances come out roughly 57 times smaller and the two zones no longer fall inside the broad line region and dusty torus radii.
Editorial extensions
If this is right
- A direct consequence is that gamma-ray and optical/UV variability should remain tightly correlated in the same flaring episodes, because both bands are powered by the same electron population in the BLR zone.
- X-ray variability should stay slower and largely decoupled from gamma-ray variability, since the X-rays come from a different blob with a different seed-photon field in the dusty torus.
- The fitted jet powers for all four flares and the quiescent state stay below the Eddington luminosity of PKS 1510-089, so the model explains the high state without invoking super-Eddington energy requirements.
- The same two-zone configuration should be testable in other flat-spectrum radio quasars that show similarly large differences between gamma-ray and X-ray flux doubling times.
Reading between the lines
- If the published distance estimates are corrected for the degree-to-radian conversion, the gamma-ray and X-ray blob distances increase by roughly a factor of 57, placing both beyond the stated BLR and dusty torus radii and calling for a revision of the zone placement or of the external photon field assumptions.
- A high-cadence simultaneous X-ray and gamma-ray monitoring campaign during a future flare could test the two-zone picture directly: the prediction is that the X-ray doubling time should remain systematically longer than the gamma-ray doubling time in every flare, not just in this one epoch.
- The model's choice of a log-parabola injected electron spectrum is a modeling assumption; if the same data could be described by a single-zone broken power-law injection, the need for two physically separated zones would be weakened.
Signed reviews
Editorial analysis
A structured set of objections, weighed in public.
Referee Report
Summary. The paper analyzes the 2015 high state of the flat-spectrum radio quasar PKS 1510-089 using Fermi-LAT, Swift-XRT/UVOT, OVRO, and SMA data. It identifies four gamma-ray flares (A, B, C, D) and three quiescent states (Q1, Q2, Q3), estimates flux doubling times in different bands, and performs discrete correlation function (DCF) analyses between energy bands. Based on different doubling times, the authors propose a two-zone model: one zone near the outer edge of the broad-line region (BLR) producing optical/UV and gamma-ray emission, and a second zone in the dusty torus (DT) producing X-ray emission. They fit the multi-wavelength SEDs of the four flares and of Q2 with the time-dependent code GAMERA, using external Compton radiation from BLR and DT photon fields, and conclude that the jet power remains below the Eddington luminosity.
Significance. If the geometric placement were correct, the paper would provide a useful multi-epoch, two-zone interpretation of a well-observed blazar, with the virtue of using public analysis tools and a time-dependent radiative code. The data reduction and variability analysis are careful, and the paper is transparent about several negative DCF results. However, the central claim that the gamma-ray zone is at the BLR edge and the X-ray zone is in the DT rests on a unit error in Eq. (3). Correcting that error moves both zones far outside the radii the paper itself derives for the BLR and DT, so the two-zone geometry is not supported by the analysis. This is a load-bearing flaw that affects the main conclusion, not a local presentation issue.
major comments (3)
- [Section 3.7, Eq. (3)] Equation (3) is used with θ_jet = 0.12° as a dimensionless number, but the small-angle relation d = c t_d δ / ((1+z) θ_jet) requires θ_jet in radians. Inserting 0.12 instead of 2.09×10^-3 underestimates both distances by a factor 180/π ≈ 57.3. The corrected values are d_γ ≈ 1.0×10^19 cm and d_X ≈ 5.7×10^19 cm, which exceed the same section's R_BLR = 2.6×10^17 cm and R_DT = 6.47×10^18 cm. Consequently, the gamma-ray zone is not at the BLR edge and the X-ray zone is not in the DT, so the central two-zone placement claim is unsupported. Because Eq. (4) and Table 2 evaluate the BLR and DT energy densities at those radii, the SED fits in Figure 3 are conditioned on this erroneous geometry.
- [Section 3.6 and Section 4.1] The DCF analysis does not find statistically significant correlations in any band pair, as the paper itself states. Nevertheless, the co-spatial origin of gamma-ray and optical/UV emission is inferred from a 'zero or small time lag.' This is not justified: the γ-B DCF peak at 3.9 days lies within the adopted 12.2-day DCF bin, the γ-X peak at 4.99 days lies within the 10.2-day bin, and peaks at the light-curve edges are discounted as unreliable. A non-significant DCF cannot bear the weight of the co-spatial assumption, which is one of the two foundational assumptions of the two-zone model.
- [Section 3.7 and Table 2] The model parameters are fitted separately for each epoch with no quoted uncertainties: α, β, γ_min, γ_max, B, and the electron normalization are all adjusted to reproduce each SED, and the resulting jet power is then computed from these fitted values. Because the model is fitted rather than predictive, the quality of the SED fits in Figure 3 does not independently confirm the zone locations. This would already weaken the empirical case for the two-zone geometry; combined with the unit error in Eq. (3), the paper's main conclusion lacks support.
minor comments (3)
- [Table 2] The DT energy density is listed as 0.002 erg cm^-3, but Eq. (4) with Γ=20, ξ_DT=0.12, L_disk=6.7×10^45 erg s^-1, and R_DT=6.47×10^18 cm gives approximately 0.02 erg cm^-3. The factor-of-ten discrepancy should be explained or corrected.
- [Section 3.6, Figure 2] The DCF panels would be easier to interpret if the adopted DCF time bin were marked on each panel, since the text repeatedly refers to whether a peak is inside or outside the bin.
- [Section 3.7] The text says the gamma-ray and optical/UV flux doubling times are 'closer to each other' and uses this to motivate co-spatiality, but the values (10.6 hr for gamma rays, ~0.7-1.4 days for optical/UV) differ by a factor of about two to three; this should be discussed more explicitly as a rough consistency rather than a tight equality.
Circularity Check
No significant circularity: the two-zone distances come from observed doubling times via Eq. (3), and the SED parameters are explicitly fitted, not predicted.
full rationale
The paper's central location claim is not equivalent to an input. In §3.7 the gamma-ray and X-ray source distances are computed from the observed flux-doubling times (10.6 hr and 2.5 days; Table 1) together with adopted δ, z, and θ_jet, and are then compared with R_BLR and R_DT obtained from the Ghisellini-Tavecchio scaling law. That calculation is independent of the GAMERA SED fits; the SED fits use the resulting locations as inputs, so the agreement of the model curves with the data is a consistency check, not a prediction. The paper does not call the SED agreement a prediction — it states that parameters were optimized to obtain the best fit. The co-spatial optical/γ-ray assumption is explicitly labeled as an assumption ('the optical and gamma-ray emission is assumed to be co-spatial'), and the DCF is reported as inconclusive ('it would not be justified to conclude anything about the locations of different emission regions from this analysis'), so no derived result is being smuggled back in as an output. Self-citations (Prince et al. 2017, 2018; Prince 2019) are methodological or supporting references, not load-bearing uniqueness or ansatz citations. A separate, non-circularity concern is that Eq. (3) appears to use θ_jet = 0.12° without conversion to radians; that would be a units/correctness error affecting the numerical distances, but it is not an instance of a result reducing to its own inputs.
Assumptions & free parameters
free parameters (10)
- Doppler factor delta =
25
- Lorentz factor Gamma =
20
- Jet opening angle theta_jet =
0.12 degrees
- Disk luminosity L_disk =
6.7e45 erg/s
- BLR covering factor xi_BLR =
0.06
- DT covering factor xi_DT =
0.12
- Per-epoch magnetic field in BLR zone =
2.8, 3.5, 5.1, 3.4, 3.8 G for Flare A, B, C, D, Q2
- Per-epoch magnetic field in DT zone =
0.01 G for all states
- Per-epoch electron injection parameters =
alpha = 1.7-2.2, beta = 0.07-0.17, gamma_min = 24-250, gamma_max = 800-27000
- Electron jet power P_e =
2.5e44 to 1.7e45 erg/s per zone per state
assumptions (9)
- domain assumption Variability distance relation d = c t_d delta / ((1+z) theta_jet), with theta_jet in radians.
- domain assumption BLR and DT radii from scaling laws R_BLR = 10^17 L_d,45^1/2 and R_DT = 2.5e18 L_d,45^1/2.
- domain assumption External radiation energy density U'_ext = Gamma^2 xi_ext L_disk / (4 pi c R_ext^2).
- ad hoc to paper Gamma-ray and optical/UV emission are co-spatial and from the same electron population.
- ad hoc to paper X-ray emission is external Compton of dusty torus photons in the second zone.
- domain assumption Injected electron spectrum is a log parabola.
- domain assumption Pair to cold proton ratio is 10:1 for jet power estimates.
- domain assumption External photon temperatures are BLR at 10^4 K and DT at 10^3 K.
- standard math Standard synchrotron, SSC, and EC radiative formulae as implemented in GAMERA.
Cite this review
Pith. "Pith review of Two-zone emission modeling of PKS 1510-089 during the high state of 2015." pith.science (2026). https://pith.science/paper/ZWC6W667
@misc{pith2026190804803,
  author       = {Pith},
  title        = {Pith review of: Two-zone emission modeling of PKS 1510-089 during the high state of 2015},
  year         = {2026},
  howpublished = {\url{https://pith.science/paper/ZWC6W667}},
  note         = {Machine review of arXiv:1908.04803}
}
read the original abstract
PKS 1510-089 is one of the most variable blazars in the third Fermi-LAT source catalog. During 2015, this source has shown four flares identified as flare A, B, C, and D in between three quiescent states Q1, Q2, and Q3. The multi-wavelength data from Fermi-LAT, Swift-XRT/UVOT, OVRO, and SMA observatory are used in our work to model these states. Different flux doubling times have been observed in different energy bands which indicate there could be multiple emission zones. The flux doubling time from the gamma-ray and X-ray light curves are found to be 10.6 hr, 2.5 days, and the average flux doubling time in the optical/UV band is 1 day. It is possible that the gamma-ray and optical/UV emission are produced in the same region whereas X-ray emission is coming from a different region along the jet axis. We have also estimated the discrete correlations functions (DCFs) among the light curves of different energy bands to infer about their emission regions. However, our DCF analysis does not show significant correlation in different energy bands though it shows peaks in some cases at small time lags. We perform a two-zone multi-wavelength time-dependent SED modeling with one emission zone located near the outer edge of the broad line region (BLR) and another further away in the dusty/molecular torus (DT/MT) region to study this high state.
Figures


Forward citations
Cited by 1 Pith paper
-
A two-zone model for blazar emission: implications for TXS 0506+056 and the neutrino event IceCube-170922A
A two-zone blazar model, with neutrinos produced near the broad-line region and the low-energy light from an outer zone, raises the predicted neutrino flux from TXS 0506+056 by about an order of magnitude.
Reference graph
Works this paper leans on
- [1]
- [2]
-
[3]
Acciari, V. A. et al., 2018, A & A, 619, 159
work page 2018
- [4]
-
[5]
Abramowski, A., et al., 2013, A & A, 550, 4
work page 2013
-
[6]
Aleksi \'c , J., Ansoldi, S., Antonelli, L. A. et al. 2014, A&A, 569, A46
work page 2014
- [7]
-
[8]
Acero, F., Ackermann, M., et al., 2015, ApJS, 218, 23
work page 2015
Show all 56 references
-
[9]
L., Ansoldi, S., Antonelli, L
Ahnen, M. L., Ansoldi, S., Antonelli, L. A. et al. 2017, A & A, 603, A29
2017
-
[10]
Barnacka, A., Moderski, R., Behera, B., Brun, P., Wagner, S., 2014, 567, A113
2014
-
[11]
Basumallick, P. P. & Gupta, N., 2016, APh, 88, 1
2016
-
[12]
& Gould, G., 1970, Rev
Blumenthal, R. & Gould, G., 1970, Rev. Mod. Phys., 42, 237
1970
-
[13]
M., et al
Bonning, E, W., Bailyn, C., Urry, C. M., et al. 2009, ApJL, 697, L81
2009
-
[14]
& Prakash A
B\"ottcher M., Reimer A., Sweeney K. & Prakash A. 2013, ApJ, 768, 54
2013
-
[15]
A., Landsman, W., et al., 2011, AIPC, 1358, 373-376
Breeveld, A. A., Landsman, W., et al., 2011, AIPC, 1358, 373-376
2011
-
[16]
Brown, A., 2013, MNRAS, 431, 824-835
2013
-
[17]
2014, A&A, 565, A60
Castignani, G., Guetta, D., Pian, E., et al. 2014, A&A, 565, A60
2014
-
[18]
2017, A&A, 601, A30
Castignani, G., Pian, E., Belloni, T M., et al. 2017, A&A, 601, A30
2017
-
[19]
1997, MNRAS, 286, 415
Celotti, A., Padovani, P., & Ghisellini, G. 1997, MNRAS, 286, 415
1997
-
[20]
Dotson, A., Georganopoulos, M., et al., 2015, ApJ, 809, 164
2015
-
[21]
A., & Krolik, J
Edelson, R. A., & Krolik, J. H., 1988, ApJ, 333, 646
1988
-
[22]
D., 2016, ApJ, 830, 94
Finke, J. D., 2016, ApJ, 830, 94
2016
-
[23]
2000, ApJ, 541, 153-165
Fossati,G., Celotti, A., Chiaberge, M., et al. 2000, ApJ, 541, 153-165
2000
-
[24]
2014, MNRAS, 441, 1899
Fuhrmann, L., Larsson, S., et al. 2014, MNRAS, 441, 1899
2014
-
[25]
Ghisellini, G., & Tavecchio, F., 2009, MNRAS, 397,985
2009
-
[26]
A., Peck, A
Gurwell, M. A., Peck, A. B., Hostler, S. R., Darrah, M. R., & Katz, C. A. 2007, in Astronomical Society of the Pacific Conference Series, Vol. 375,From Z-Machines to ALMA: (Sub)Millimeter Spectroscopy of Galaxies, ed. A. J. Baker, J. Glenn, A. I. Harris, J. G. Mangum, & M. S. Yun, 234
2007
-
[27]
Janiak, M., Sikora, M., et al., 2012, ApJ, 760, 129
2012
-
[28]
G., Marscher, A
Jorstad, S. G., Marscher, A. P., Lister, M. L., et al. 2005, AJ, 130, 1418
2005
-
[29]
Kalberla, P. M. W., Burton, W. B., et al., 2005, A & A, 440, 775-782
2005
-
[30]
Kataoka, J., et al., 2008, ApJ, 672, 787-799
2008
-
[31]
S., 2018, A & A, 617, 59
Kaur, N., Baliyan, K. S., 2018, A & A, 617, 59
2018
-
[32]
C., Misra, R., Singh, K
Kushwaha, P., Gupta, A. C., Misra, R., Singh, K. P., 2017, MNRAS, 464, 2046
2017
-
[33]
M., Villata, M., et al., 2016, MNRAS, 461, 3047-3056
Larionov, V. M., Villata, M., et al., 2016, MNRAS, 461, 3047-3056
2016
-
[34]
2017, MNRAS, 466, 4625-4632
Liodakis, I., Marchili, N., et al. 2017, MNRAS, 466, 4625-4632
2017
-
[35]
P., Jorstad, S., Larionov, V., et al
Marscher, A. P., Jorstad, S., Larionov, V., et al. 2010, ApJ, 710, L126
2010
-
[36]
Perri, M., Giomi, P
Massaro, E. Perri, M., Giomi, P. & Nesci, R., 2004, A & A, 413, 489
2004
-
[37]
2012, ApJ, 760, 69
Nalewajko, K., Sikora, M., Madejeski, G., et al. 2012, ApJ, 760, 69
2012
-
[38]
Nalewajko, K., 2013, MNRAS, 430, 1324-1333
2013
-
[39]
D., Ammando, F., Giroletti, M., et al
Orienti, M. D., Ammando, F., Giroletti, M., et al. 2013, MNRAS, 428, 241
2013
-
[40]
S., 2015, ApJL, 808, L48
Paliya, V. S., 2015, ApJL, 808, L48
2015
-
[41]
M., 2006 Alloin D
Peterson B. M., 2006 Alloin D. Lecture Notes in Physics, Vol. 693, Physics of Active Galactic Nuclei at all Scales Springer Berlin 77
2006
-
[42]
Prince, R., Majumdar P., Gupta N., 2017, ApJ, 844, 62
2017
-
[43]
2018, ApJ, 866, 16
Prince, R., Raman, G., et al. 2018, ApJ, 866, 16
2018
-
[44]
Prince, R., 2019, ApJ, 871, 101
2019
-
[45]
Rajput, B., Stalin, C. S. et al., 2019, MNRAS, 486, 1781
2019
-
[46]
2011, ApJS, 194, 29
Richards, J, L., Max-Moerbeck, W., et al. 2011, ApJS, 194, 29
2011
-
[47]
Roming, P. W. A., Kennedy, T. E., et al., 2005, ssr, 120, 95-142
2005
-
[48]
F., Finkbeiner, D
Schlafly, E. F., Finkbeiner, D. P., 2011, ApJ, 737, 103
2011
-
[49]
T., et al., 2013, ApJL, 766, L11
Saito, S., Stawarz, L., Tanaka, Y. T., et al., 2013, ApJL, 766, L11
2013
-
[50]
Saito, S., Stawarz, L., et al., 2015, ApJ, 809, 171
2015
-
[51]
M., Bechtold, J., Walker, C
Tanner, A. M., Bechtold, J., Walker, C. E., Black, J. H., & Cutri, R. M., 1996, AJ, 112, 62
1996
-
[52]
Tavecchio, F., Ghisellini, G., et al., 2010, MNRAS, 405, L94-L98
2010
-
[53]
S., & Uttley, P., 2003, MNRAS, 345, 1271
Vaughan, S., Edelson, R., Warwick, R. S., & Uttley, P., 2003, MNRAS, 345, 1271
2003
-
[54]
R., Balonek, T
Weaver, Z. R., Balonek, T. J., et al., 2019, ApJ, 875, 15
2019
-
[55]
2016, arXiv:1611.02098
Zacharias, M., B\"ottcher, M., Chakraborty, N., et al. 2016, arXiv:1611.02098
2016 arXiv
-
[56]
H., Celotti, A., Treves, A., Chiappetti, L., et al
Zhang, Y. H., Celotti, A., Treves, A., Chiappetti, L., et al. 1999, ApJ, 527, 719
1999
Reviewed August 14, 2026 · model on record in the stance chip above.
Discussion (0). Continue with ORCID to comment.