REVIEW 4 major objections 5 minor 38 references
The case of NGC 6302: The impact of shocks in the derivation of Nitrogen abundances
T0 review · 4 major / 5 minor · reviewed 2026-08-14 · deepseek-v4-flash
Pith's one-line read In NGC 6302, shocks lower the nitrogen-to-oxygen ionic ratio to about 0.6 times the value assumed by standard abundance corrections, overestimating nitrogen in shock-heated gas.
desk verdict A worthwhile first application of shock diagnostic diagrams to a whole PN, but the quantitative nitrogen correction rests on a distance inconsistency and an untested no-gradient assumption. read the letter →
The pith
A machine-rendered reading of the paper's core claim, the machinery that carries it, and where it could break.
The reading
What carries the argument
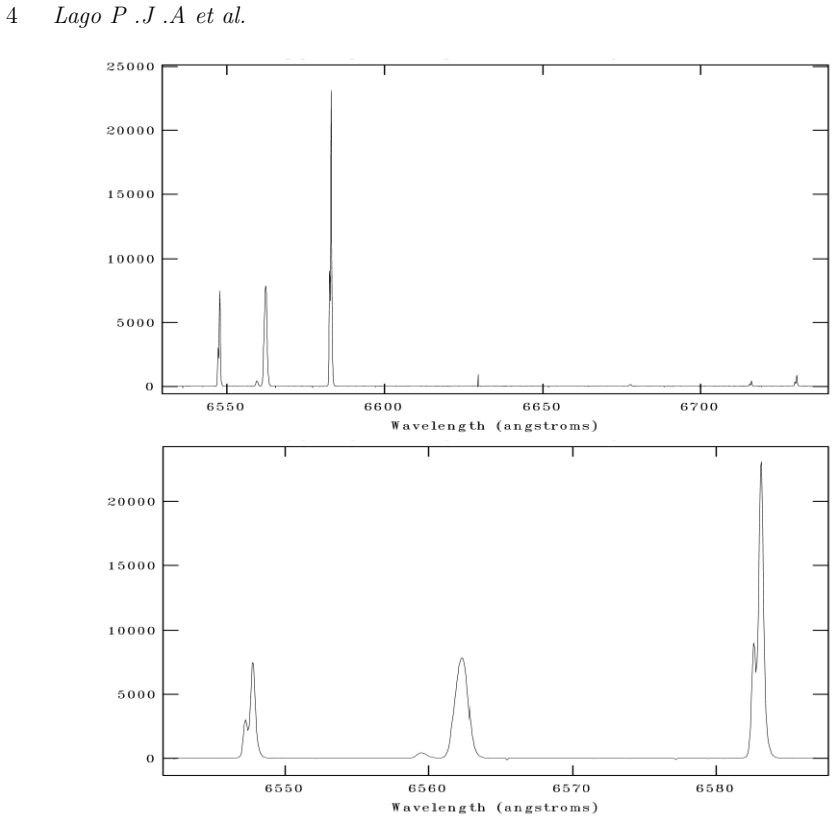
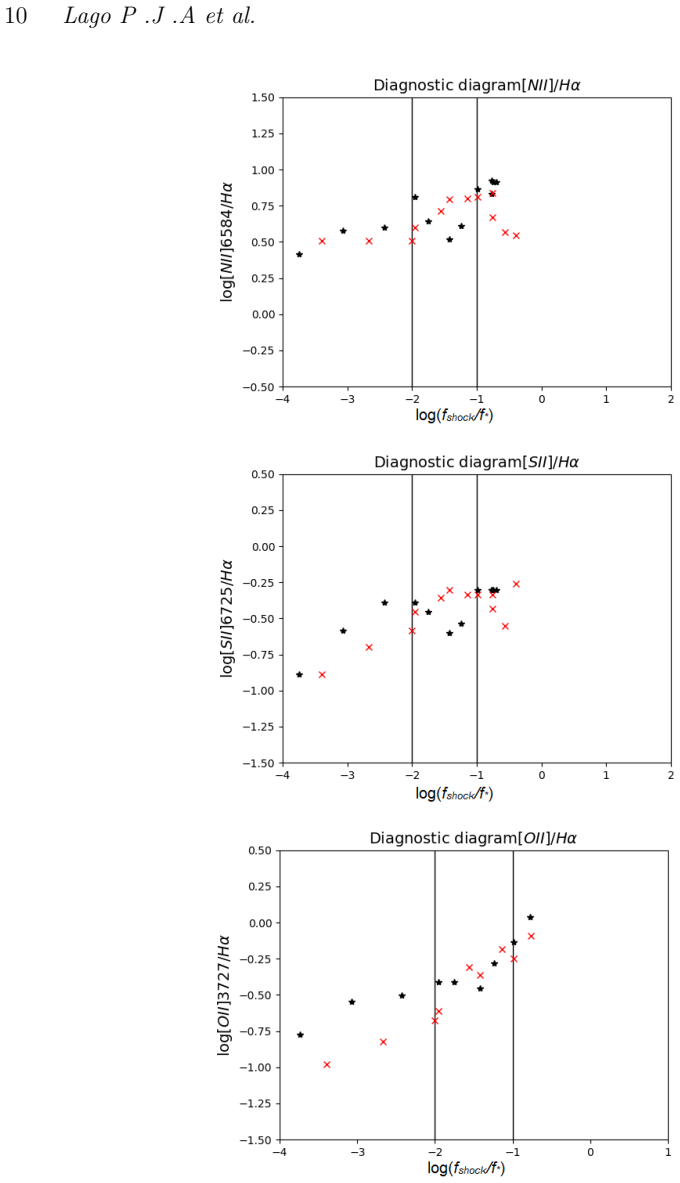
The argument runs on the ratio $f_{\rm shock}/f_*$, the shock photon flux relative to the stellar photon flux, computed from shock velocity, electron density, and stellar luminosity, combined with diagnostic diagrams plotting $[N\textsc{ii}]/H\alpha$, $[O\textsc{ii}]/[O\textsc{iii}]$, $[O\textsc{ii}]/H\beta$, and $[S\textsc{ii}]/H\alpha$ against $f_{\rm shock}/f_*$. Shock-dominated regions satisfy $\log(f_{\rm shock}/f_*) > -1$, transition zones lie between $-2$ and $-1$, and photoionized regions lie below $-2$. These diagrams are fed with an expansion law $V(r) = (1.7\pm0.3\,\mathrm{km\,s^{-1}\,arcsec^{-1}})r + (14\pm5.5\,\mathrm{km\,s^{-1}})$ derived from Gaussian fits to the split $[N\textsc{ii}]$ and $[S\textsc{ii}]$ profiles. Comparing the same ionic ratios in the two regimes, and assuming proportionality between line flux and ionic abundance, produces the 0.6 factor that quantifies the shock bias.
What would settle it
Measure the ionic N/O ratio in the same shock-dominated and photoionized apertures using temperature-insensitive recombination lines or infrared fine-structure lines; if the intrinsic N/O is identical in both regimes while the collisionally excited [N II]/[O II] ratio follows the 0.6 offset, the shock-ICF claim is supported, whereas a matching abundance difference would show the no-gradient assumption failed.
Extended reading notes
Core claim
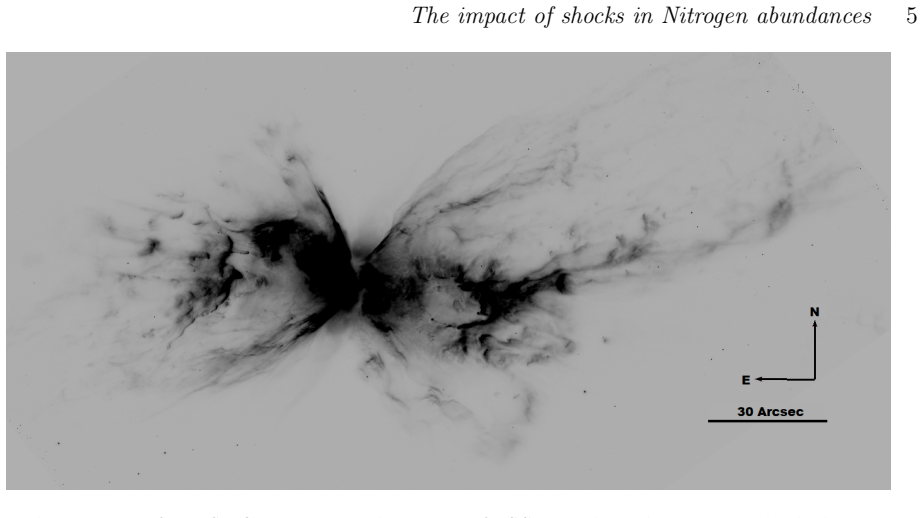
The central claim is that the standard ICF identity $N^+/N = O^+/O$, appropriate for photoionized nebulae, breaks down in shock-dominated regions of NGC 6302. Using the Akras-Gonçalves diagnostic diagrams, the authors identify the outer lobes as shock-excited and the inner region as photoionized, then compare line-ratio offsets between the two regimes. From an offset of 0.5 dex in $\log([N\textsc{ii}]/H\alpha)$ and the corresponding oxygen offset, they derive $N^+_{\rm shock}/N \approx 3.16\beta\, N^+/N$ and $O^+_{\rm shock}/O \approx 5\beta\, O^+/O$, which combine with the KB94 ICF into $N^+_{\rm shock}/N \approx 0.6\, O^+_{\rm shock}/O$. The paper concludes that abundances should not be derived from shocked gas with standard recipes because nitrogen is overestimated, that newer ICFs face the same problem with an extra factor $\xi$, and that NGC 6302 lies at $805\pm143$ pc.
Load-bearing premise
The load-bearing premise is that NGC 6302 has no abundance gradient, so line-ratio differences between bright filamentary shock regions and the inner photoionized gas reflect excitation rather than a real nitrogen enrichment of the filaments.
Editorial extensions
If this is right
- In any planetary nebula where shocks dominate peripheral gas, the standard Kingsburgh-Barlow ICF will overestimate nitrogen; shocked regions need a shock-aware correction factor.
- The diagnostic-diagram criterion can be applied to other well-sampled nebulae to map which regions are safe for ICF-based abundance work before abundances are computed.
- Newer ICF recipes, such as those of Delgado-Inglada et al. (2014), also require modification, with the shock correction entering as an extra factor $\xi$ in the nitrogen-oxygen relation.
- NGC 6302's distance is revised to $805\pm143$ pc, about 0.14 kpc closer than the earlier value but consistent within uncertainties.
- The high nitrogen abundance that earns NGC 6302 its Type-I classification is partly reinforced by shocks, so shock bias should be considered when interpreting Type-I statistics.
Reading between the lines
- If the no-abundance-gradient assumption fails because the shocked filaments are themselves nitrogen-enriched, the 0.6 factor would conflate composition with excitation; mapping N/O with temperature-insensitive recombination lines in the same apertures would settle this.
- The same ratio-symmetric comparison could be extended to sulfur, argon, or neon ICFs, which also assume proportionality between ionic and total abundances in photoionized gas.
- A practical application would be a shock-corrected ICF parameterized by $f_{\rm shock}/f_*$, allowing abundance surveys to flag or re-normalize objects with strong shocks.
- The kinematic distance method used here is transferable: comparing proper-motion velocity laws with spectroscopic expansion laws in other planetary nebulae provides distances independent of parallax.
Signed reviews
Editorial analysis
A structured set of objections, weighed in public.
Referee Report
Summary. The paper combines new long-slit spectroscopy of NGC 6302 with literature emission-line maps from Rauber et al. (2014) to construct the Akras & Gonçalves (2016) shock diagnostic diagrams. The authors find that most parts of the nebula lie in the transition or shock zones of these diagrams, and they use the extreme line-ratio values in the diagrams to argue that in shock-dominated regions N+/N is approximately 0.6 times O+/O, instead of the standard Kingsburgh & Barlow (1994) ICF assumption N+/N = O+/O. This leads to the conclusion that standard ICFs overestimate nitrogen abundances when shocks are present. The paper also derives a new distance to NGC 6302 of 805 ± 143 pc by comparing its expansion law with the proper-motion-based law of Szyszka et al. (2011).
Significance. If the central claim holds, the paper would be a valuable caution for empirical abundance determinations in planetary nebulae, extending earlier LIS-specific results to a whole Type I nebula and providing a target for future shock-aware ICFs. The paper has useful features: it applies existing diagnostic diagrams to a well-sampled nebula, it makes its algebraic steps explicit in Appendix A, and it provides the observed velocity data in Appendix B. However, the quantitative result currently depends on a small number of diagram-read offsets, on an untested no-abundance-gradient assumption, and on the use of a distance in the shock diagnostic that conflicts with the paper's own newly derived distance. These issues directly affect whether the peripheral regions can be classified as shock-dominated, and therefore whether the ICF correction is empirically grounded.
major comments (4)
- [Section 4 (Eq 3)] The diagnostic diagrams are built using d = 1.17 kpc, while the same section derives a distance of 805 ± 143 pc. Because fshock/f* ∝ d², adopting the new distance shifts all points in Figure 3 by 2 log10(805/1170) ≈ -0.32 dex toward the photoionized side. This shift is comparable to the widths of the shock and transition boundaries, so the statement that 'most of the points are in the transition zones or shock zone' and the identification of peripheral regions used for the shock line-ratio extremes in Eqs 4-7 are not secure. The claim that the two distances agree 'within uncertainties, about 0.14 kpc' is also internally inconsistent: 1.17 and 0.805 kpc differ by 0.365 kpc, about 2.5σ of the quoted 143 pc error.
- [Section 4 (Eqs 4-7) and Appendix A] The central quantitative result rests on the value 0.5 dex in Eq 4, which is 'derived directly from the diagrams' but is presented without an extraction method or error bars, and on the oxygen factor of 5 in Eq 6, whose origin in Appendix A is described only as 'considering proper values.' Because these two numbers combine with the ICF condition N+/N = O+/O to produce the 0.6 coefficient in Eq 7, the result is not reproducible as presented. The authors should show how the maximum and minimum line-ratio values were selected, provide uncertainties, and propagate them into Eq 7.
- [Section 4 (paragraph beginning 'Considering that there is no abundance gradient')] The assumption of no abundance gradient across NGC 6302 is load-bearing. If the peripheral filamentary regions selected as shock-dominated are actually nitrogen-enriched relative to the inner photoionized gas—a plausible situation for a Type I PN—then Eqs 4-7 would be measuring a composition difference rather than a shock-induced bias in the ICF. The authors present no test of this assumption, yet without it the central claim does not follow.
- [Section 4 (Eq 3)] The text states 'We assume that this velocity is the same that can be derived by equation 2,' i.e., the shock velocity is identified with the bulk expansion velocity. This assumption directly controls fshock/f* and therefore the classification of every point in Figure 3. The paper should at least compare this choice with shock velocities expected in the cited bow-shock simulations (Riera & Raga 2007; Raga et al. 2008) or demonstrate that the shock/photo classification is insensitive to plausible variations in Vs.
minor comments (5)
- [Section 2.2] There is a typo: 'Availeble' should be 'Available', and the URL contains a duplicated 'https:https'.
- [Figure 3 caption] The caption says the 'flux ratios (horizontal axis)' depend on distance to the central star; in the diagnostic diagrams the horizontal axis is log(fshock/f*), which is not itself an emission-line flux ratio. Please clarify the wording.
- [Section 4 (Eq 8)] The sentence 'the equivalent equation is 3:' before Eq 8 appears to refer to Eq 8 itself; the cross-reference should be corrected.
- [Appendix B] The velocity table would be more useful with per-measurement uncertainties; the text gives a typical error of 10 km/s, but individual values are presented without error bars.
- [Section 2.1] The spectra are stated to be not flux calibrated; since the subsequent analysis relies on line ratios from Rauber et al. (2014), it would help to state explicitly that the OPD spectra are used only for kinematics and not for the line-ratio measurements.
Circularity Check
No circularity: the 0.6 N/O shock factor is an algebraic read-off of external diagnostic diagrams, not an input fitted as output.
full rationale
The paper's central claim is that shocks alter the effective N/O ionic ratio, so that the standard Kingsburgh & Barlow (1994) ICF overestimates nitrogen in shock-dominated regions. The derivation of this claim is empirical rather than circular. Equation 4 ('log([NII]shock/Halpha_shock) - log([NII]/Halpha) = 0.5') is explicitly a direct read-off from the Akras & Gonçalves (2016) diagnostic diagrams: the paper states 'This equation is derived directly from the diagrams, by subtracting the values in the axis.' Equation 7 then follows algebraically from the observed line-ratio offsets and the KB94 photoionization ICF assumption; the intermediate H-alpha ratio beta cancels, so the 0.6 factor is just 3.16/5. This is a measurement, not a fitted parameter being renamed as a prediction. The 'no abundance gradient' assumption is an explicit, testable identification condition ('Considering that there is no abundance gradient in the nebula...'), not a definitional equivalence importing the conclusion. The cited diagnostic diagrams and model values are from Akras & Gonçalves (2016) and Gonçalves et al. (2006b), which are external to the present author list, so no self-citation chain is load-bearing. The inconsistency between the 1.17 kpc distance used in Equation 3 and the newly derived 805 pc distance is a real internal calibration concern that could affect the placement of points in the shock/photo zones, but it is a correctness or robustness issue, not a circular reduction: the shock classification was made with the 1.17 kpc value, and the new distance was not inserted back into the diagnostic construction. No equation in the paper is equivalent to an input by construction, and no externally fitted value is recycled as an independent result. Therefore the paper is not circular.
Assumptions & free parameters
free parameters (7)
- Expansion law slope (a) =
1.7 +/- 0.3 km/s/arcsec
- Expansion law intercept (b) =
14 +/- 5.5 km/s
- Adopted inclination (theta) =
12.8 +/- 2 degrees
- Adopted central star luminosity (lower limit) =
5690 Lsun
- Adopted distance for fshock/f* =
1.17 kpc
- Diagram offset for [NII]/Halpha =
0.5 dex
- Diagram offset factor for oxygen =
5 (about 0.7 dex)
assumptions (6)
- domain assumption The Akras and Goncalves (2016) diagnostic diagrams correctly discriminate shock-excited from photoionized regions, including for a whole nebula rather than knots.
- ad hoc to paper The gas has no abundance gradient across NGC 6302, so line-ratio differences between regions reflect excitation conditions, not composition.
- ad hoc to paper The shock velocity equals the expansion velocity from the linear law (Eq 2).
- ad hoc to paper Line flux ratios are proportional to ionic abundance ratios in shocked gas, as in photoionized gas.
- domain assumption Both lobes of NGC 6302 are symmetric and the velocity field is linear.
- domain assumption The Balmer decrement correction of 2.85 converts [OII]/Hbeta to [OII]/Halpha.
Cite this review
Pith. "Pith review of The case of NGC 6302: The impact of shocks in the derivation of Nitrogen abundances." pith.science (2026). https://pith.science/paper/ZZLAIBYK
@misc{pith2026190808053,
  author       = {Pith},
  title        = {Pith review of: The case of NGC 6302: The impact of shocks in the derivation of Nitrogen abundances},
  year         = {2026},
  howpublished = {\url{https://pith.science/paper/ZZLAIBYK}},
  note         = {Machine review of arXiv:1908.08053}
}
abstract
High nitrogen abundance is characteristic of Type I planetary nebulae as well as their highly filamentary structure. In the present work we test the hypothesis of shocks as a relevant excitation mechanism for a Type-I nebula, NGC 6302, using recently released diagnostic diagrams to distinguish shocks from photoexcitation. The construction of diagrams depends on emission line ratios and kinematical information. NGC 6302 shows the relevance of shocks in peripheral regions and the importance to the whole nebula. Using shocks, we question the usual assumption of ICF calculation, justifying a warning to broadly used abundance derivation methods. From a kinematical analysis, we derive a new distance for NGC 6302 of $805\pm143\,$ pc.
Figures
Reference graph
Works this paper leans on
-
[1]
write newline
" write newline "" before.all 'output.state := FUNCTION fin.entry write newline FUNCTION new.block output.state before.all = 'skip after.block 'output.state := if FUNCTION new.sentence output.state after.block = 'skip output.state before.all = 'skip after.sentence 'output.state := if if FUNCTION not #0 #1 if FUNCTION and 'skip pop #0 if FUNCTION or pop #1...
-
[2]
Akras S., Gon c alves D. R., 2016, @doi [ ] 10.1093/mnras/stv2139 , http://adsabs.harvard.edu/abs/2016MNRAS.455..930A 455, 930
-
[3]
Balick B., 1987, @doi [ ] 10.1086/114504 , http://adsabs.harvard.edu/abs/1987AJ.....94..671B 94, 671
doi:10.1086/114504 1987
-
[4]
N., 1993, @doi [ ] 10.1086/172881 , http://adsabs.harvard.edu/abs/1993ApJ...411..778B 411, 778
Balick B., Rugers M., Terzian Y., Chengalur J. N., 1993, @doi [ ] 10.1086/172881 , http://adsabs.harvard.edu/abs/1993ApJ...411..778B 411, 778
-
[5]
Balick B., Perinotto M., Maccioni A., Terzian Y., Hajian A., 1994, @doi [ ] 10.1086/173932 , http://adsabs.harvard.edu/abs/1994ApJ...424..800B 424, 800
doi:10.1086/173932 1994
-
[6]
Clyne N., Akras S., Steffen W., Redman M. P., Gon c alves D. R., Harvey E., 2015, @doi [ ] 10.1051/0004-6361/201526585 , http://adsabs.harvard.edu/abs/2015A
-
[7]
Contini M., Angeloni R., Rafanelli P., 2009, @doi [ ] 10.1111/j.1365-2966.2009.14792.x , http://adsabs.harvard.edu/abs/2009MNRAS.396..807C 396, 807
arXiv 2009
-
[8]
Corradi R. L. M., Manso R., Mampaso A., Schwarz H. E., 1996, , http://adsabs.harvard.edu/abs/1996A
work page 1996
Show all 38 references
-
[9]
Delgado-Inglada G., Morisset C., Stasi \'n ska G., 2014, @doi [ ] 10.1093/mnras/stu341 , http://adsabs.harvard.edu/abs/2014MNRAS.440..536D 440, 536
2014 doi
-
[10]
A., Sutherland R
Dopita M. A., Sutherland R. S., 1996, @doi [ ] 10.1086/192255 , http://adsabs.harvard.edu/abs/1996ApJS..102..161D 102, 161
1996 doi
-
[11]
A., Ali A., Karakas A
Dopita M. A., Ali A., Karakas A. I., Goldman D., Amer M. A., Sutherland R. S., 2018, @doi [ ] 10.1093/mnras/stx3180 , https://ui.adsabs.harvard.edu/abs/2018MNRAS.475..424D 475, 424
2018 doi
-
[12]
J., Storey P
Ercolano B., Barlow M. J., Storey P. J., Liu X.-W., 2003, @doi [ ] 10.1046/j.1365-8711.2003.06371.x , http://cdsads.u-strasbg.fr/abs/2003MNRAS.340.1136E 340, 1136
2003
-
[13]
Fang X., et al., 2014, @doi [ ] 10.1088/0004-637X/797/2/100 , http://adsabs.harvard.edu/abs/2014ApJ...797..100F 797, 100
2014 doi
-
[14]
J., Korista K
Ferland G. J., Korista K. T., Verner D. A., Ferguson J. W., Kingdon J. B., Verner E. M., 1998, @doi [ ] 10.1086/316190 , http://adsabs.harvard.edu/abs/1998PASP..110..761F 110, 761
1998 doi
-
[15]
T., L \'o pez J
Garc \' a-D \' az M. T., L \'o pez J. A., Steffen W., Richer M. G., 2012, @doi [ ] 10.1088/0004-637X/761/2/172 , http://adsabs.harvard.edu/abs/2012ApJ...761..172G 761, 172
2012 doi
-
[16]
Godard B., Pineau des For \^e ts G., Lesaffre P., Lehmann A., Gusdorf A., Falgarone E., 2019, arXiv e-prints, http://adsabs.harvard.edu/abs/2019arXiv190104273G
2019
-
[17]
R., Corradi R
Gon c alves D. R., Corradi R. L. M., Mampaso A., 2001, @doi [ ] 10.1086/318364 , http://adsabs.harvard.edu/abs/2001ApJ...547..302G 547, 302
2001 doi
-
[18]
R., Ercolano B., Carnero A., Mampaso A., Corradi R
Gon c alves D. R., Ercolano B., Carnero A., Mampaso A., Corradi R. L. M., Barlow M. J., 2006a, in Barlow M. J., M \'e ndez R. H., eds, IAU Symposium Vol. 234, Planetary Nebulae in our Galaxy and Beyond. pp 405--406, @doi 10.1017/S1743921306003462
-
[19]
R., Ercolano B., Carnero A., Mampaso A., Corradi R
Gon c alves D. R., Ercolano B., Carnero A., Mampaso A., Corradi R. L. M., 2006b, @doi [ ] 10.1111/j.1365-2966.2005.09794.x , http://adsabs.harvard.edu/abs/2006MNRAS.365.1039G 365, 1039
2005
-
[20]
A., Toal \'a J
Guerrero M. A., Toal \'a J. A., Medina J. J., Luridiana V., Miranda L. F., Riera A., Vel \'a zquez P. F., 2013, @doi [ ] 10.1051/0004-6361/201321786 , http://adsabs.harvard.edu/abs/2013A
2013 doi
-
[21]
L., Barlow M
Kingsburgh R. L., Barlow M. J., 1994, @doi [ ] 10.1093/mnras/271.2.257 , http://adsabs.harvard.edu/abs/1994MNRAS.271..257K 271, 257
1994 doi
-
[22]
R., Fitzgerald P
Kwok S., Purton C. R., Fitzgerald P. M., 1978, @doi [ ] 10.1086/182621 , http://adsabs.harvard.edu/abs/1978ApJ...219L.125K 219, L125
1978 doi
-
[23]
J., Ferland G
Lame N. J., Ferland G. J., 1991, @doi [ ] 10.1086/169619 , http://adsabs.harvard.edu/abs/1991ApJ...367..208L 367, 208
1991 doi
-
[24]
Matsuura M., et al., 2009, @doi [ ] 10.1088/0004-637X/700/2/1067 , http://adsabs.harvard.edu/abs/2009ApJ...700.1067M 700, 1067
2009 doi
-
[25]
Meaburn J., Lloyd M., Vaytet N. M. H., L \'o pez J. A., 2008, @doi [ ] 10.1111/j.1365-2966.2007.12782.x , http://adsabs.harvard.edu/abs/2008MNRAS.385..269M 385, 269
2008
-
[26]
D., Hasco \"e t R., Vurm I., Beloborodov A
Metzger B. D., Hasco \"e t R., Vurm I., Beloborodov A. M., Chomiuk L., Sokoloski J. L., Nelson T., 2014, @doi [ ] 10.1093/mnras/stu844 , http://adsabs.harvard.edu/abs/2014MNRAS.442..713M 442, 713
2014 doi
-
[27]
Peimbert M., Costero R., 1969, Boletin de los Observatorios Tonantzintla y Tacubaya, http://adsabs.harvard.edu/abs/1969BOTT....5....3P 5, 3
1969
-
[28]
R., ed., IAU Symposium Vol
Peimbert M., Torres-Peimbert S., 1983, in Flower D. R., ed., IAU Symposium Vol. 103, Planetary Nebulae. pp 233--241
1983
-
[29]
Raga A., Noriega-Crespo A., 1998, @doi [ ] 10.1086/300641 , http://adsabs.harvard.edu/abs/1998AJ....116.2943R 116, 2943
1998 doi
-
[30]
C., Riera A., Mellema G., Esquivel A., Vel \'a zquez P
Raga A. C., Riera A., Mellema G., Esquivel A., Vel \'a zquez P. F., 2008, @doi [ ] 10.1051/0004-6361:20079157 , http://adsabs.harvard.edu/abs/2008A
2008 doi
-
[31]
B., Copetti M
Rauber A. B., Copetti M. V. F., Krabbe A. C., 2014, @doi [ ] 10.1051/0004-6361/201323363 , http://adsabs.harvard.edu/abs/2014A
2014 doi
-
[32]
C., 2007, in Asymmetrical Planetary Nebulae IV
Riera A., Raga A. C., 2007, in Asymmetrical Planetary Nebulae IV
2007
-
[33]
Sabbadin F., 1984, @doi [ ] 10.1093/mnras/210.2.341 , http://adsabs.harvard.edu/abs/1984MNRAS.210..341S 210, 341
1984 doi
-
[34]
Steffen W., et al., 2014, The Messenger, http://adsabs.harvard.edu/abs/2014Msngr.158...26S 158, 26
2014
-
[36]
F., Esquivel A., Raga A
Uscanga L., Vel \'a zquez P. F., Esquivel A., Raga A. C., Boumis P., Cant \'o J., 2014, @doi [ ] 10.1093/mnras/stu1064 , http://adsabs.harvard.edu/abs/2014MNRAS.442.3162U 442, 3162
2014 doi
-
[37]
E., 1953, Carnegie Institute Washington D.C
Wilson R. E., 1953, Carnegie Institute Washington D.C. Publication, http://adsabs.harvard.edu/abs/1953GCRV..C......0W
1953
-
[38]
J., Barlow M
Wright N. J., Barlow M. J., Ercolano B., Rauch T., 2011, @doi [ ] 10.1111/j.1365-2966.2011.19490.x , http://adsabs.harvard.edu/abs/2011MNRAS.418..370W 418, 370
2011
-
[39]
Zhang Y., Liu S., 2019, @doi [ ] 10.1093/mnras/sty3136 , http://adsabs.harvard.edu/abs/2019MNRAS.482.5268Z 482, 5268
2019 doi
Reviewed August 14, 2026 · model on record in the stance chip above.
Discussion (0). Continue with ORCID to comment.